Competing retailers and inventory an empirical investigation of
Amazon Fulfillment
1. 1
EXECUTIVE REPORT – September 2016
FULFILLMENT TIME PERFORMANCE OF AMAZON RELATIVE TO
OTHER ONLINE RETAILERS – AN EMPIRICAL ANALYSIS
Rohit Das1
, Amanda Helminsky2
, Jingran Zhang2
, Sevilay Onal2
and Sanchoy Das2
1 College of Business, University of Illinois, Urbana-Champaign, IL 61820
2 College of Engineering, New Jersey Institute of Technology, NJ 07102
INTRODUCTION:
When selecting an online retailer, the two main criteria from a consumer perspective are the price and
fulfillment time. Where fulfillment time is defined as the interval between customer’s order placement and
onsite delivery. Previous studies have confirmed a strong relationship between order fulfillment times and
consumer buying behavior. These studies show that order fulfillment efficiency is an important determinant
of overall customer satisfaction and retention. The phenomenal growth of Amazon and its widespread
impact on the U.S. retail industry is now well documented. The general opinion is that Amazon has designed
and built a fulfillment infrastructure that allows it to achieve delivery times that significantly outperform all
other online retailers. One day and in some instances same day fulfillment, motivates customers to shift
their buying behavior to the web, and in most cases specifically to Amazon. The market shifts and economic
impacts of online buying on traditional retailers is clearly evident in their quarterly reports. This study shows
that building a competitive fulfillment infrastructure is key for any online retailer to effectively participate and
benefit from these market shifts.
While many retailers are able to offer competitive prices and an attractive product variety in their online
stores, we believe quick online fulfillment is not easily achieved from traditional warehouses and logistics
systems. This research uses a survey method to evaluate the fulfillment time performance behavior of
consumer orders made through the Amazon website and several competing online retailers. The goal of
the study is to empirically confirm whether the Amazon fulfillment infrastructure provides it with a
competitive advantage relative to other online retailers. Specifically, three research questions investigating
the comparative fulfillment times of Amazon versus other major retailers are analyzed. We explore the issue
of whether by simply offering products for online sale, a conventional retailer can effectively match the
fulfillment performance of Amazon. The results are important in that they provide fulfillment time
benchmarks for existing and new online retailers, allowing them to build a more directed and target driven
fulfillment strategy.
SURVEY DATA:
The survey method involved placing an online order for the identical product on both Amazon and a
competing online retailer. The sample set consisted of a thousand products (N=1000). To focus the results
on Amazon logistics and inventory policies, only Amazon Fulfilled products were selected. To ensure the
generality of the survey population, three factors were used in product selection: (i) Type – Five types that
are most commonly ordered in online retail were chosen, except for fashion the other retailer was limited
to one or two leading competitors; (ii) Price – Four pricing categories were assigned; and (iii) Size –
represented by the product volume, three categories were assigned. Factor selection was limited to causal
2. 2
factors that are most likely to influence the product flow and associated logistics. For example a large office
product (e.g. High back chair) is likely to have lower inventory levels and require more fulfillment resources,
likewise a small electronics product (e.g. Memory stick) requires significantly less resources. Fashion
represents a special case in that few identical products are available on both Amazon and a single
competing retailer, thus requiring the survey to expand the set of other retailers.
Table 1. SURVEY PRODUCT DISTRIBUTION (N=1000)
1. TYPE Ratio 2. PRICE Ratio 3. SIZE Ratio
Electronics (Best Buy/Walmart) 25% Less than $50 45% Small 43%
Home Improvement (Home Depot) 20% $50 to $100 20% Medium 42%
Fashion (Multiple) 20% $101 to $200 20% Large 15%
Office Products (Staples/Office Depot) 20% More than $200 15%
Books (Barnes & Noble) 15%
Table 1 shows the distribution of the surveyed products, specific competing retailers for each type are
also identified. Survey data was collected over a five week period (May to June 2016). To minimize the
effects of weekend logistic delays, order placement was done Sunday to Thursday. For every product both
the Amazon and competing retailer order were placed on the same day at the same time. For each product
three data points were collected: OP - Order placement date; OA - Amazon order fulfill promise date; and
OC – Competing retailer order fulfill promise date.
FULFILLMENT PERFORMANCE ANALYTICS
The performance metrics of interest are the Amazon Fulfillment Time: FA = OA – OP, and the
Competition Fulfillment Time: FC = OC – OP. The analytical dataset is then defined by FA and FC for all
N=1000 products. Where the fulfillment straddles a Sunday, then FA and/or FC is reduced by one. Less than
5% of the data set was adjusted by this rule. Three study questions were analyzed using the data set.
3. 3
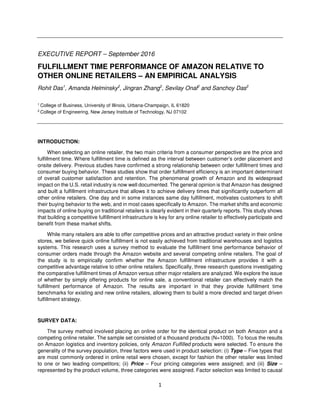
R1 – Mean fulfillment time for Amazon orders is shorter than other retailers – Figure 1 shows the FA
and FC distributions across the survey set. The observed mean and standard deviation for FA was 1.92 and
2.43 days, while for FC it was 4.81 and 3.41 days. The shorter fulfillment time dominance of Amazon is
clear from figure 1. For 89% of orders FA was 2 days or less, while the corresponding ratio for FC was only
26%. An independent-samples t-test was conducted to compare FA and FC. A significant difference in FA
and FC was observed with conditions; t(999)=-22.5, p=0.05. These results suggest that the Amazon
fulfillment infrastructure allows them to achieve much shorter fulfillment times relative to the competition.
R2 – What is the fulfillment time difference between Amazon and other retailers – While R1 studied
the overall delivery performance, R2 focuses on each specific order. The study metric here is the fulfillment
time advantage of Amazon described by Δ = FC - FA. Figure 2 shows the Δ distribution across the survey
set. For 4% of orders Amazon was slower than the competition, while for 15% of orders they were equally
fast, but for 81% of orders Amazon was at least a day faster. Further analysis of the Δ distribution confirms
the fulfillment time dominance of Amazon, and we find that for 41% of orders Amazon was at least 4 days
faster than the competition.
R3 – What is the fulfillment time behavior within each survey factor – The purpose of this question
was to investigate the fulfillment time behavior within each factor. Table 2 shows the detailed behavior
within each factor, and interesting differences within each factor are clearly evident. The product type
analysis provides insights into Amazon’s behavior against specific retailers. An independent-samples t-
test was conducted to compare FA and FC for each retailer pair, and a significant difference was confirmed
at p=0.05: Best Buy/Walmart - t(249)=-7.1, Home Depot - t(199)=-7.9; Fashion Multiple - t(199)=-16.6;
Staples/Office Depot - t(199)=-7.4; and Barnes & Noble - t(149)=-44.0. The fulfillment dominance of
Amazon is strongest in the Books category and smallest in the Electronics category. Surprisingly, Fashion
had the fastest delivery times for both Amazon and other retailers along with with small variances.
The product size analysis exhibited, as expected, an increase in FA and FC with increasing size. Larger
products require more storage space and handling effort, both at the warehouse and on distribution
vehicles. But this differentiation was less evident in the competing retailer data, with only a 25% increase
in FC between small and large products.
The product price analysis displays contrasting behaviors, for Amazon an increase in fulfillment time is
observed with price, while for other retailers the time actually decreases. In particular the FA and FC
difference for products priced at less than $50 was surprisingly large.
4. 4
Table 2. ORDER FULFILLMENT TIMES (Days)
FACTOR
Amazon Other Retailers
Mean Std. Dev Mean Std. Dev
Product Type
Electronics (Best Buy/Walmart) 2.19 3.32 4.21 3.04
Home Improvement (Home Depot) 2.83 3.28 5.39 3.01
Fashion (Multiple) 1.21 1.39 3.45 1.44
Office Products (Staples/Office Depot) 1.32 0.82 4.09 5.42
Books (Barnes & Noble) 2.03 1.00 7.23 1.07
Product Size
Small 1.53 1.58 4.38 3.16
Medium 1.93 2.48 5.01 3.55
Large 3.03 3.67 5.48 3.55
Product Price
Less than $50 1.64 1.30 5.04 3.57
$55 to $100 1.64 1.61 4.91 3.71
$101 to $200 2.02 3.03 4.42 2.63
More than $200 2.98 4.11 4.55 3.45
CONCLUSIONS
From an analysis of the survey data, this study confirms the fulfillment time dominance of Amazon. The
study results show specifically the time advantages it has achieved through its warehousing and logistics
infrastructure. Clearly, an online retail strategy which does not include an innovative and detailed fulfillment
solution is unlikely to be successful. For the few products where Δ was zero or less, the most common
strategy was found to be BOFOS (Buy Online Fulfilment Out of Retail Stores). Possibly, this provides a
quick solution for an omnichannel retailer. But BOFOS fulfillment costs are likely to be much higher than a
dedicated online warehouse, so the strategy maybe shortsighted. For Amazon orders the study found that
5% had same day and 41% had next day fulfillment. As these ratios increase further the competitive
landscape for purely brick-and-mortar retail does not bode well.
Across all factors, large products had the longest fulfillment time for Amazon, this could be good and
bad news for competing retailers. As Amazon further evolves its fulfillment infrastructure large product times
may decrease significantly this increasing the competitive challenges for large product retailers.
Alternatively, other retailers could focus on large product fulfillment allowing them to match Amazon since
the Δ gap is relatively smaller. The fulfillment time behavior across product price and product size is
indicative of the weak online fulfillment infrastructure of the other retailers. In a related study we have
identified and described the explosive storage policy used at Amazon’s internet fulfillment warehouses plus
the extensive digital control of all transactional activities. Significant evolution and redesign will be required
from other retailers if they are to achieve fulfillment time parity with Amazon.
Correspondence: For additional information please contact Prof. Sanchoy Das at das@njit.edu