NY Prostate Cancer Conference - J. Bellmunt - Panel discussion D: Do we need ...
CRP as PTSD Biomarker
1. Copyright 2014 American Medical Association. All rights reserved.
Assessment of Plasma C-Reactive Protein
as a Biomarker of Posttraumatic Stress Disorder Risk
Satish A. Eraly, MD, PhD; Caroline M. Nievergelt, PhD; Adam X. Maihofer, MS; Donald A. Barkauskas, PhD;
Nilima Biswas, PhD; Agorastos Agorastos, MD; Daniel T. O’Connor, MD; Dewleen G. Baker, MD;
for the Marine Resiliency Study Team
IMPORTANCE Posttraumatic stress disorder (PTSD) has been associated in cross-sectional
studies with peripheral inflammation. It is not known whether this observed association is the
result of PTSD predisposing to inflammation (as sometimes postulated) or to inflammation
predisposing to PTSD.
OBJECTIVE To determine whether plasma concentration of the inflammatory marker
C-reactive protein (CRP) helps predict PTSD symptoms.
DESIGN, SETTING, AND PARTICIPANTS The Marine Resiliency Study, a prospective study
of approximately 2600 war zone–deployed Marines, evaluated PTSD symptoms and various
physiological and psychological parameters before deployment and at approximately 3 and 6
months following a 7-month deployment. Participants were recruited from 4 all-male infantry
battalions imminently deploying to a war zone. Participation was requested of 2978
individuals; 2610 people (87.6%) consented and 2555 (85.8%) were included in the present
analysis. Postdeployment data on combat-related trauma were included for 2208
participants (86.4% of the 2555 included) and on PTSD symptoms at 3 and 6 months after
deployment for 1861 (72.8%) and 1617 (63.3%) participants, respectively.
MAIN OUTCOMES AND MEASURES Severity of PTSD symptoms 3 months after deployment
assessed by the Clinician-Administered PTSD Scale (CAPS).
RESULTS We determined the effects of baseline plasma CRP concentration on
postdeployment CAPS using zero-inflated negative binomial regression (ZINBR), a procedure
designed for distributions, such as CAPS in this study, that have an excess of zeroes in
addition to being positively skewed. Adjusting for the baseline CAPS score, trauma exposure,
and other relevant covariates, we found baseline plasma CRP concentration to be a highly
significant overall predictor of postdeployment CAPS scores (P = .002): each 10-fold
increment in CRP concentration was associated with an odds ratio of nonzero outcome
(presence vs absence of any PTSD symptoms) of 1.51 (95% CI, 1.15-1.97; P = .003) and a fold
increase in outcome with a nonzero value (extent of symptoms when present) of 1.06 (95%
CI, 0.99-1.14; P = .09).
CONCLUSIONS AND RELEVANCE A marker of peripheral inflammation, plasma CRP may be
prospectively associated with PTSD symptom emergence, suggesting that inflammation may
predispose to PTSD.
JAMA Psychiatry. 2014;71(4):423-431. doi:10.1001/jamapsychiatry.2013.4374
Published online February 26, 2014.
Supplemental content at
jamapsychiatry.com
Author Affiliations: Author
affiliations are listed at the end of this
article.
Group Information Marine
Resiliency Study (MRS) Team
members are listed at the end of this
article.
Corresponding Author: Dewleen G.
Baker, MD, Veterans Affairs Center of
Excellence for Stress and Mental
Health, 3350 La Jolla Village Dr,
Ste 116A, San Diego, CA 92161
(dgbaker@ucsd.edu).
Research
Original Investigation
423
Copyright 2014 American Medical Association. All rights reserved.
Downloaded From: http://archpsyc.jamanetwork.com/ by a University of California - San Diego User on 02/05/2015
2. Copyright 2014 American Medical Association. All rights reserved.
O
bservational studies1
largely support an association of
posttraumatic stress disorder (PTSD) with increased
peripheral inflammation, as discussed in a recent re-
view of the overall evidence.2
For instance, one large cross-
sectional community-based study3
found that patients with
PTSD had approximately twice the odds of those without this
disorder of elevation in the inflammatory marker C-reactive
protein (CRP). Similarly, although some case-control studies4,5
have had negative or equivocal findings, in most such
studies6-11
PTSD cohorts have had significantly greater plasma
levelsofCRPorinterleukin6,amongotherinflammatorymark-
ers, than did controls. This association is of prognostic signifi-
cance because low-grade inflammation is likely involved in the
pathophysiology of the metabolic syndrome,12-14
a major car-
diovascular risk factor15,16
; indeed, PTSD has been found to be
associated with this syndrome.17-24
It is plausible that the observed association between PTSD
and inflammation is due to PTSD-related stress hormone dys-
regulation leading to alterations in immune, and therefore in-
flammatory, signaling.7,25-27
However, given the cross-
sectional nature of the evidence at hand, it remains possible
that rather than PTSD promoting inflammation, inflamma-
tion places individuals at heightened risk for developing PTSD
in the setting of trauma. In other words, the direction of cau-
sality runs from inflammation to PTSD rather than from PTSD
to inflammation.
Service members serving in the Iraq and Afghanistan con-
flictsenduresubstantialcombatstressandconsequentPTSD.28
The Marine Resiliency Study (MRS) is a prospective field study
of approximately 2600 Marines and sailors deployed to Iraq or
Afghanistan, during which PTSD severity and various physi-
ological and psychological parameters were determined pre-
deploymentandpostdeployment,affordinganoutstandingop-
portunity to investigate the causal relationship between
inflammation and PTSD. In the present study, we determined
whetherbaselineperipheralinflammation,assessedbyplasma
CRP levels in the MRS, contributes to postdeployment PTSD
symptoms, assessed by scores on the Clinician-Administered
PTSD Scale (CAPS), adjusting for trauma exposure and other
relevant covariates.
Methods
Participants
The MRS is a prospective longitudinal study of biological and
neuropsychological modulators of combat stress–related
PTSD in Marines.29
Approval was received and has been
maintained since August 2007 from the institutional review
boards of the University of California, San Diego, Veterans
Affairs San Diego Research Service, and Naval Health
Research Center. Participants were recruited from 4 all-male
infantry battalions that were imminently deploying to a war
zone. Participation was requested of 2978 individuals, of
whom 2610 (87.6%) provided written informed consent and
were enrolled and given financial compensation. Assessment
of the participants began on July 14, 2008, and continued
through May 24, 2012. Fifty-five of the enrollees were ex-
cluded from the present analysis because they did not deploy
with their cohort or withdrew before completing the prede-
ployment visit, so that the number of participants included
was 2555 (85.8%). The demographics of these individuals are
summarized in Table 1.
Data were collected approximately 1 month before a
7-monthdeployment(baseline;visit0)andat1week,3months,
and 6 months following the deployment (visits 1, 2, and 3, re-
spectively). Among the 2555 included participants, baseline
plasma CRP concentrations were included from 2484 partici-
pants (97.2%) and baseline CAPS scores from 2533 partici-
pants (99.1%). For the other specific baseline variables used in
the present statistical analyses (anthropometrics, psychomet-
rics, and demographics; see below), the number of individu-
als with included data ranged from 2482 to 2548 (97.1%-
99.7%). Data on deployment-related trauma were obtained at
visit 1 and were included from 2208 participants (86.4%), visit
2 CAPS scores from 1861 participants (72.8%), and visit 3 CAPS
scores from 1617 participants (63.3%).
Measures
The CAPS,30
a criterion standard PTSD symptom scale, was the
primary outcome measure for our analyses because, as a 136-
point numeric scale, it would be expected to yield greater dis-
criminant power than the binary outcome of PTSD diagnosis.
Trauma exposure occurring during combat was assessed with
the Deployment Risk and Resilience Inventory Combat Expo-
sure Scale (CES) (http://www.ptsd.va.gov/professional
/assessment/te-measures/ces.asp), and exposure occurring in
the aftermath of combat with the Deployment Risk and Resil-
ience Inventory Post-battle Experiences (PBE) scale (http:
//www.ptsd.va.gov/professional/assessment/deployment
/exposure-aftermath-battle.asp). Baseline high-sensitive CRP
plasma levels were measured using an enzyme-linked immu-
nosorbent assay (ALPCO Diagnostics). Measures for variables
not included in the final regression model are described in the
Supplement (eMethods).
Statistical Analysis
The association of our predictors of interest with CAPS was
determined using zero-inflated negative binomial regression
(ZINBR). A description of this method and the rationale for its
choice are in the Supplement (eMethods). Potential con-
founders were selected for inclusion in regression modeling
on the basis of their univariate association at a lenient signifi-
cance threshold (P < .20), with both the outcome (postde-
ployment CAPS) and the predictor of interest (plasma CRP
concentration) (determined by analysis of variance, linear
regression, or ZINBR as appropriate). The values for plasma
CRP concentrations were skewed and were therefore log
transformed before analyses. Ordinal and binomial logistic
regression were used to determine the effects of the same
predictors as in the final ZINBR model (Table 2) on the cat-
egorical outcomes at visit 2 of full PTSD (as defined in the
DSM-IV-R),31
partial PTSD,32-34
or no PTSD. Statistical analy-
ses were performed with either SPSS, version 20.0 (IBM) or,
for ZINBR, the R statistical package (http://cran.r-project.org).
All P values reported are 2-tailed.
Research Original Investigation C-Reactive Protein in PTSD Risk
424 JAMA Psychiatry April 2014 Volume 71, Number 4 jamapsychiatry.com
Copyright 2014 American Medical Association. All rights reserved.
Downloaded From: http://archpsyc.jamanetwork.com/ by a University of California - San Diego User on 02/05/2015
3. Copyright 2014 American Medical Association. All rights reserved.
Results
Choice of Outcomes and Model Covariates
Baseline and postdeployment values of participants for the
variables included in the statistical models are listed in Table 1
along with selected additional characteristics. Posttraumatic
stress disorder symptoms, assessed by CAPS scores (see the
Methods section), increased significantly between the base-
line and 3-month postdeployment visits used for our analysis
(visits 0 and 2), and then trended back toward baseline in line
withfindingsinarecentsystematicreview.35
Incontrasttotheir
Table 1. Selected Baseline and Postdeployment Characteristics of Participantsa
Characteristic No. Mean (SD) or %b
Median (Range)c
Demographics
Age, y 2548 22.78 (3.51) 21.83 (18-48)
Ethnicity 2534
Non-Hispanic 1944 76.5 …
Hispanic 590 23.2 …
Race 2503
European American 2113 82.7 …
African American 119 4.7 …
Asian American 69 2.7 …
American Indian 35 1.4 …
Pacific Islander 38 1.5 …
Mixed 129 5.0 …
Highest educational level 2482
High school 1645 64.3 …
At least some college 825 32.3 …
Postgraduate 12 0.5 …
Marital status 2538
Never married 1560 61.1 …
Married 889 34.8 …
Divorced or separated 89 3.5 …
Military characteristics
Service length, mo 2538 36.29 (24.45) 26.00 (0-324)
Previously deployed 2541 51.3 …
Enlisted 2540 97.4 …
CRP, mg/L 2484 1.93 (3.31) 0.79 (0.03-28.53)
Waist circumference, cm 2533 85.39 (7.62) 84.46 (65.41-123.52)
BMI 2533 27.60 (3.24) 27.42 (18.83-41.41)
Mean arterial blood pressure, mm Hg 2527 90.38 (7.98) 90.00 (64.67-148.33)
AUDIT-C score 2527 5.06 (3.61) 5.00 (0-12)
BAI score
Visit 0 2519 6.79 (7.85) 4.00 (0-53)
Visit 2 1850 4.79 (7.36) 2.00 (0-57)
Visit 3 1609 4.22 (7.26) 1.00 (0-63)
BDI score
Visit 0 2526 6.59 (7.67) 4.00 (0-51)
Visit 2 1854 5.05 (6.80) 2.00 (0-54)
Visit 3 1612 4.79 (6.82) 2.00 (0-46)
CAPS score
Visit 0 2533 14.89 (15.37) 10.00 (0-101)
Visit 2 1861 17.40 (18.01) 12.00 (0-120)
Visit 3 1617 15.41 (17.39) 10.00 (0-107)
PTSDd
Visit 0 2533 4.7 …
Visit 2 1861 6.3 …
Visit 3 1617 5.1 …
CES 2189 13.57 (11.39) 9.00 (0-64)
PBE 2204 5.65 (4.79) 4.00 (0-15)
Abbreviations: AUDIT-C, Alcohol Use
Disorders Identification
Test–consumption; BAI, Beck Anxiety
Inventory; BDI, Beck Depression
Inventory; BMI, body mass index
(calculated as weight in kilograms
divided by height in meters squared);
CAPS, Clinician-Administered
Posttraumatic Stress Disorder (PTSD)
Scale; CES, Combat Exposure Scale;
CRP, baseline plasma C-reactive
protein; PBE, Post-battle
Experiences; ellipses, not applicable.
a
See the Methods section for
definition of variables and
additional details concerning
demographics and military
characteristics.
b
A small proportion of participants
did not provide data on
demographic traits; therefore, the
percentages do not total 100%.
c
Median (range) values were not
determined for values reported as
percentages.
d
Visit 0, baseline; visit 2, 3 months
postdeployment; visit 3, 6 months
postdeployment.
C-Reactive Protein in PTSD Risk Original Investigation Research
jamapsychiatry.com JAMA Psychiatry April 2014 Volume 71, Number 4 425
Copyright 2014 American Medical Association. All rights reserved.
Downloaded From: http://archpsyc.jamanetwork.com/ by a University of California - San Diego User on 02/05/2015
4. Copyright 2014 American Medical Association. All rights reserved.
scores on CAPS, participants’ scores on the Beck Anxiety In-
ventory and Beck Depression Inventory (Supplement
[eMethods]) dropped markedly after completion of deploy-
ment (Table 1), potentially reflecting the relief experienced by
service personnel on return from combat. Thus, the ob-
served postdeployment increases in PTSD symptoms were not
attributable to broad psychopathology or general psychologi-
cal distress.
We included baseline CAPS scores (CAPS0) as a covariate
in all statistical analyses of the outcome of visit 2 CAPS (CAPS2)
so as to adjust for any differences between participants in
CAPS2 that were attributable to preexisting differences in
CAPS0;thisalsoadjustedforanyeffectsofbaselinePTSDsymp-
toms on the subsequent trajectory of the disorder. In addi-
tion to CAPS0, CES and PBE scores (determined at visit 1 im-
mediately following deployment) were included as covariates
in regression models to adjust for differences between par-
ticipants in traumatic exposure during and after combat, re-
spectively (as detailed in the Methods section). Moreover, be-
cause the 4 MRS battalions differed from one another in their
war zone experiences and in the timing of their training regi-
men relative to the period of data collection, cohort assign-
ment of each participant was set as a factor in regression analy-
sis. Multiple other potential confounders were evaluated,
including several previously associated with both PTSD and
peripheral inflammation (eg, baseline depression, anxiety, and
alcohol and tobacco use36-52
) and various anthropometric and
demographic variables (Table 1); however, none met the cri-
teria for inclusion in the regression models.
ZINBR of Postdeployment CAPS
In accordance with the analyses described above, our ZINBR
model (described in the Methods section) of CAPS2 com-
prised plasma CRP concentration, CAPS0, cohort assign-
ment, and CES and PBE scores. C-reactive protein was a highly
significant overall predictor of CAPS2 in this model (P = .002
by likelihood ratio test), as was each of the other predictors
(Table 2). C-reactive protein was also a highly significant pre-
dictor in the analogous linear regression model with the same
covariates (P = .002); however, ZINBR is significantly supe-
rior to linear regression when modeling the outcome of CAPS
(Supplement [eMethods]). We assessed all 2-way interactions
with CRP; none was statistically significant. Based on analy-
sis of the scores on CAPS subscales, the greatest effect of CRP
appeared to be in the domain of hyperarousal (subscale D of
CAPS; overall P < .001), with less of an effect on numbing (sub-
scale CN; P = .03), and even lesser effects on reexperiencing
(subscale B; P = . 28) and avoidance (subscale CA; P = .57).
InthezerocomponentoftheZINBRmodel,CRPwasaposi-
tivepredictorofCAPS2:each1-Uincrementinlog10 plasmaCRP
concentration (ie, each 10-fold increase in CRP concentra-
tion)wasassociatedwithafoldchangeintheapproximateodds
of obtaining a CAPS2 score greater than zero (ie, odds ratio [OR]
of nonzero CAPS2) of 1.51 (95% CI, 1.15-1.97; P = .003) (Table 2).
Stated in the context of the range of CRP concentrations in our
study population, a 1-SD increase in log10 CRP (corresponding
to a 3.57-fold increase in CRP concentration) was associated
with an OR of 1.25 (1.08-1.45) (Figure 1A). By comparison, 1-SD
increases in CAPS0, CES, and PBE were associated with ORs
of 4.15 (95% CI, 3.06-5.63; P < .001), 1.39 (1.06-1.83; P = .019),
and 1.43 (1.13-1.80; P = .003), respectively. Consistent with the
findings obtained with CRP treated as a continuous predic-
tor, categorization of CRP revealed a trend toward a greater OR
of nonzero outcome with increasing CRP category (although
there was, as expected, a loss of statistical power) (Figure 1B).
Likewise, CRP was a positive predictor of CAPS2 scores in
the count component of the ZINBR model (which predicts
approximately the extent of the outcome when it is nonzero,
as described in the Supplement [eMethods]): each 10-fold
increase in CRP concentration was associated with a 1.06-fold
increase in CAPS2. However, this effect was statistically sig-
nificant only at the trend level (95% CI, 0.99-1.14; P = .09
Table 2. Zero-Inflated Negative Binomial Regression Model of Postdeployment (Visit 2) CAPS Score in 1719 Participants
Variable
Zero Model Count Model
Overall
P Valuee
OR (95% CI)a,b
P Value Fold Change (95% CI)c,d
P Value
Interceptb,d
1.25 (0.76-2.05) .37 10.57 (9.29-12.03) <.001
Cohort 1 1.92 (1.08-3.43) .03 1.03 (0.90-1.19) .68 <.001
Cohort 2 0.57 (0.36-0.90) .02 0.94 (0.83-1.07) .35 <.001
Cohort 3 0.63 (0.41-0.97) .04 0.78 (0.70-0.86) <.001 <.001
Cohort 4 0f
CAPS0 score 1.10 (1.08-1.12) <.001 1.02 (1.02-1.02) <.001 <.001
CES score 1.03 (1.01-1.05) .02 1.01 (1.00-1.01) .001 <.001
PBE score 1.08 (1.03-1.13) .003 1.04 (1.03-1.05) <.001 <.001
Log CRP 1.51 (1.15-1.97) .003 1.06 (0.99-1.14) .09 .002
Abbreviations: CAPS0, Clinician-Administered Posttraumatic Stress Disorder
(PTSD) Scale score at visit 0 (baseline); CES, Combat Exposure Scale; CRP, baseline
plasma C-reactive protein; OR, odds ratio; PBE, Post-battle Experiences.
a
Ratio of approximate odds of nonzero outcome (computed by exponentiating
the corresponding coefficient in the regression model and adjusted for the
variables listed in the table).
b
Value for the intercept indicates approximate odds of nonzero outcome at
baseline (cohort equals 4 and all other variables have zero values).
c
Approximate fold change in outcome, in the event of a nonzero outcome
(computed by exponentiating the corresponding coefficient in the regression
model and adjusted for the variables listed in the table).
d
Value for the intercept indicates approximate outcome in the event of a nonzero
outcome at baseline (cohort equals 4 and all other variables have zero values).
e
By the likelihood ratio test.
f
This variable was set to zero because it is redundant.
Research Original Investigation C-Reactive Protein in PTSD Risk
426 JAMA Psychiatry April 2014 Volume 71, Number 4 jamapsychiatry.com
Copyright 2014 American Medical Association. All rights reserved.
Downloaded From: http://archpsyc.jamanetwork.com/ by a University of California - San Diego User on 02/05/2015
5. Copyright 2014 American Medical Association. All rights reserved.
[2-tailed]) (Table 2). Accounting for the ranges in values of the
predictors, a 1-SD increase in log10 CRP was associated with
1.03-fold change (95% CI, 1.00-1.07) in CAPS2; 1-SD increases
in CAPS0, CES, and PBE were associated with fold changes of
1.36 (1.31-1.42; P < .001), 1.11 (1.05-1.18; P = .001), and 1.20
(1.13-1.28; P < .001), respectively (Figure 1B).
Logistic Regression of Postdeployment PTSD
In addition to analysis of the continuous outcome of CAPS2,
we performed logistic regression of the categorical outcome
of PTSD (DSM-IV-R definition 31
) at visit 2 using the same co-
variates as in the ZINBR model. C-reactive protein was a sig-
nificant predictor in this analysis as well, albeit not to as great
a degree as in the ZINBR model: each 10-fold increment in CRP
concentration was associated with a PTSD OR of 1.50 (95% CI,
1.02-2.22; P = .04) (Table 3). Taking into account the ranges of
predictor values, a 1-SD increase in log10 CRP was associated
withaPTSDORof1.25;bycomparison,1-SDincreasesinCAPS0,
CES, and PBE were associated with ORs of 2.30, 1.43, and 1.35,
respectively(Figure2A).Conversely,adjustedbaselineCRPval-
ues for participants with and without PTSD at visit 2 were 1.00
and 0.76 mg/L (to convert to nanomoles per liter, multiply by
9.524), respectively (adjusted for the same covariates as the
logistic regression model) (Figure 2B). C-reactive protein was
similarly a significant predictor in ordinal logistic regression
of the diagnostic categories of PTSD, partial PTSD,32-34
or nei-
ther (P = .03) (Supplement [eResults, eTable, and eFigure]).
We also performed subgroup analyses excluding partici-
pantsatvariousthresholdsofthemodelvariables:plasmaCRP,
baselineCAPS,CES,andPBE.C-reactiveproteineffectsinthese
subsets were generally similar to those obtained when con-
sidering all participants, indicating that the effects are not sub-
stantially influenced by individuals at the extremes of plasma
CRP, baseline PTSD symptoms, or combat exposure (data not
shown). Moreover, CRP was not significantly associated with
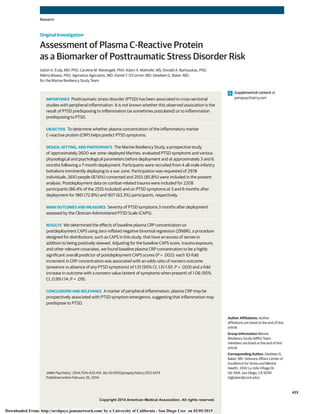
Figure 1. Effects of Baseline Plasma C-Reactive Protein (CRP)
Concentration and Other Predictors on Postdeployment
Posttraumatic Stress Disorder (PTSD) Symptoms
10.0
1.0
0.1
AORofNonzeroCAPS2Score
With1-SDIncrease
A
CAPS0
a
CES
b
PBE
c
Log CRP
c
10.0
1.0
0.1
FoldChangeinCAPS2Score
With1-SDIncrease
B
CAPS0
a
CES
a
PBE
a
Log CRP
d
10.0
1.0
0.1
AORofNonzeroCAPS2Score
CRP Concentration, mg/L
C
≤1 >1 to 3
d
>3 to 10
b
>10
d
A, Adjusted odds ratios (AORs) of a nonzero Clinician-Administered PTSD Scale
score at visit 2 (CAPS2) associated with 1-SD increases in the indicated variables.
B, Adjusted fold changes in CAPS2 associated with 1-SD increases in the
indicated variables. Data in A and B are from the zero-inflated negative
binomial regression (ZINBR) model summarized in Table 2. C, The AORs
of nonzero CAPS2 by baseline plasma CRP concentration category
(reference category, Յ1; to convert to nanomoles per liter, multiply by 9.524),
as determined by ZINBR and adjusted for the same covariates as the model in
Table 2. CAPS0 indicates Clinician-Administered PTSD Scale at visit 0 (baseline);
CES, Combat Exposure Scale; and PBE, Post-battle Experiences. Error bars
delineate 95% CIs; the y-axes use a log scale. All P values are 2-tailed.
a
P < .001.
b
P < .05.
c
P < .01.
d
P < .10.
Table 3. Binomial Logistic Regression of Postdeployment (Visit 2)
PTSD Diagnosis in 1719 Participants
Variable OR (95% CI)a,b
P Value
Interceptb
0.01 (0.004-0.02) <.001
Cohort 1 1.00 (0.41-2.45) >.99
Cohort 2 1.13 (0.54-2.37) .75
Cohort 3 0.81 (0.45-1.46) .48
Cohort 4 0c
CAPS0 score 1.06 (1.04-1.07) <.001
CES score 1.03 (1.01-1.06) .01
PBE score 1.06 (0.99-1.14) .08
Log CRP 1.50 (1.02-2.22) .04
Abbreviations: CAPS0, Clinician-Administered Posttraumatic Stress Disorder
(PTSD) Scale score at visit 0 (baseline); CES, Combat Exposure Scale;
CRP, baseline plasma C-reactive protein; OR, odds ratio; PBE, Post-battle
Experiences.
a
Odds ratio of PTSD (computed by exponentiating the corresponding
coefficient in the regression model and adjusted for the variables listed in the
table).
b
Value for intercept indicates the odds of PTSD at baseline (cohort equals 4 and
all other variables have zero values).
c
This variable was set to zero because it is redundant.
C-Reactive Protein in PTSD Risk Original Investigation Research
jamapsychiatry.com JAMA Psychiatry April 2014 Volume 71, Number 4 427
Copyright 2014 American Medical Association. All rights reserved.
Downloaded From: http://archpsyc.jamanetwork.com/ by a University of California - San Diego User on 02/05/2015
6. Copyright 2014 American Medical Association. All rights reserved.
baseline CAPS or PTSD diagnosis (P = .52 and .22, respec-
tively), indicating that CRP is not a mediator or proxy for the
effects of one of these other predictors on CAPS2.
Discussion
We report a significant effect of baseline CRP on postdeploy-
ment PTSD symptom emergence in Marine and Navy combat-
ants, suggesting that higher levels of this inflammatory marker
may be prospectively associated with risk for PTSD. C-
reactive protein predominantly influenced the likelihood of
participants demonstrating the presence vs absence of PTSD
symptoms rather than the extent of symptoms when present
(as indicated by its greater statistical significance in the zero
model of the ZINBR vs the count and logistic regression mod-
els) and had a greater effect on the hyperarousal and numb-
ing symptom clusters than on the other clusters. Conceiv-
ably,highCRPlevelsmarkastateofvulnerabilitytodeveloping
these symptoms of PTSD, and the influences of other factors
prevail in determining the severity of symptoms once they are
manifested.
It is sometimes postulated7,25-27
that the observed asso-
ciation between PTSD and peripheral inflammation is due to
the former disorder predisposing to the latter, plausibly due
to PTSD-induced dysregulation of the stress axis resulting in
disinhibition of proinflammatory pathways. Our data raise the
converse possibility—that individuals with lesser inflamma-
tion may be relatively resilient and those with greater inflam-
mation relatively vulnerable to developing PTSD symptoms.
This supposition is also supported by the recent finding that
the risk for PTSD following medical illness during military de-
ployment is comparable to that following physical injury.53,54
However, the possibility that higher CRP levels at baseline re-
sulted from preceding trauma cannot be excluded.
The underlying mechanism may involve the actions of in-
flammatory cytokines, which, in addition to their well-
characterized adverse effects on metabolic and therefore car-
diovascular health,12-14
have adverse effects on mental
health.55-57
In particular, depression has long been known to
be associated with increased peripheral inflammation,36,46-50
with some studies37,38
suggesting that baseline inflammation
may predict subsequent depression, and inflammatory cyto-
kines are known to elicit symptoms of depression,58-63
as dis-
cussed in reviews.2,56,57,64
Furthermore, peripheral inflamma-
tion has been associated65-69
with impairments in memory and
executivefunction.Notably,inflammatorycytokineshavebeen
demonstrated to significantly suppress hippocampal neuro-
genesis in animals70
and have been associated with low hip-
pocampal volume in humans,71
a neuroanatomical trait that
might mark vulnerability to PTSD—in studies of identical twins
discordant for combat trauma exposure, twin pairs in which
thecombat-exposedmemberdevelopedPTSDhadsmallerhip-
pocampi than the other twin pairs.72,73
Nevertheless, the causal relationships between psychiat-
ric disorders and inflammation are likely to be complex. For
instance, in one recent large, prospective, population-based
study, cumulative episodes of depression predicted subse-
quent CRP levels74
(although this effect was attenuated after
controlling for body mass index and smoking, suggesting that
it might be attributable in part to depression-related lifestyle
changes rather than directly to the neurophysiological char-
acteristics of depression). Moreover, with respect to PTSD,
much work in animal models75-77
supports the conclusion that
chronic stress induces immunologic changes that culminate
inaproinflammatoryphenotype.Thus,inflammationmayboth
contribute to PTSD and be a consequence of the stressors that
led to the disorder.
Strengths of our study include its size, prospective
design, and adjustment for multiple potential confounders.
Figure 2. Effects of Baseline Plasma C-Reactive Protein (CRP) Concentration and Other Predictors on Postdeployment Posttraumatic Stress Disorder
(PTSD) Diagnosis
1.6
0.8
1.4
1.2
1.0
0.6
0.4
0.2
PTSDNo PTSD
10.0
1.0
0.1
AORofPTSDWith1-SDIncrease
A
CAPS0
a
CES
b
PBE
c
Log CRP
b
0.0
CRPConcentration,mg/L
B
b
A, Adjusted odds ratios (AORs) of posttraumatic stress disorder (PTSD) at visit 2
associated with 1-SD increases in the indicated variables. Data are from the
binomial logistic regression model summarized in Table 3. The y-axis uses a log
scale. B, Baseline plasma CRP concentration of participants without or with
PTSD at visit 2, adjusted for the same covariates as the logistic regression model
in Table 3. CAPS0 indicates Clinician-Administered PTSD Scale at visit 0
(baseline); CES, Combat Exposure Scale; PBE, Post-battle Experiences. Error
bars delineate 95% CIs. All P values are 2-tailed.
a
P < .001.
b
P < .05.
c
P < .10.
Research Original Investigation C-Reactive Protein in PTSD Risk
428 JAMA Psychiatry April 2014 Volume 71, Number 4 jamapsychiatry.com
Copyright 2014 American Medical Association. All rights reserved.
Downloaded From: http://archpsyc.jamanetwork.com/ by a University of California - San Diego User on 02/05/2015
7. Copyright 2014 American Medical Association. All rights reserved.
Moreover, owing to the youth of the study participants (mean
age, 22.78 years) and their relative physical fitness (given the
requirements for combat deployment), it is unlikely that
chronic physical illness confounded the observed effects of
baseline CRP on postdeployment PTSD symptoms. However,
certain limitations merit discussion. The relative fitness of
our cohort also limits the generalizability of our findings, as
does the absence of women. In addition, whereas CRP con-
centrations fluctuate substantially in response to transient
inflammatory states (eg, minor infections78
), values in our
participants were determined only once and thus may be
relatively “noisy.” Moreover, use of anti-inflammatory medi-
cations, which might also have contributed to variability in
CRP levels, was not ascertained in our study. However, such
variability would generally be expected to bias toward the
null hypothesis.
Finally, with regard to missing data, 27.2% of the partici-
pants did not have determination of CAPS2 scores. However,
CRP values did not differ significantly between individuals
for whom CAPS2 scores were present vs absent; conversely,
CAPS2 scores were not significantly different when compar-
ing participants for whom CRP values were present vs absent
(not shown). Moreover, we found the effect size of CRP on
CAPS2 or PTSD diagnosis (the CRP-associated OR or fold
change) to be generally similar across subsets of participants
having markedly different mean values for the various covar-
iates in our regression models (data not shown). This sug-
gests that even if the individuals with missing data were con-
siderably different from the other participants with regard to
CES, PBE, or baseline CAPS scores, the CRP effect sizes that
would have been obtained had the data not been missing are
likely to be similar to those that were in fact observed. Taken
together, these results suggest that missing data might not
have appreciably biased our findings concerning CRP effects
on PTSD symptoms.
Conclusions
Our results, if validated by future studies, could have impor-
tant clinical implications. If peripheral inflammation contrib-
utes to the development of PTSD, interventions to decrease in-
flammation, such as dietary or lifestyle modifications,79-81
might ameliorate the severity of this disorder. At minimum,
our findings are consistent with the adage mens sana in cor-
pore sano: a healthy mind in a healthy body.
ARTICLE INFORMATION
Submitted for Publication: July 2, 2013; final
revision received September 21, 2013; accepted
November 8, 2013.
Published Online: February 26, 2014.
doi:10.1001/jamapsychiatry.2013.4374.
Author Affiliations: Department of Medicine,
University of California, San Diego (UCSD) (Eraly,
Biswas, O’Connor); Veterans Affairs (VA) San Diego
Healthcare System, San Diego, California (Eraly,
Nievergelt, O’Connor, Baker); VA Center of
Excellence for Stress and Mental Health, San Diego,
California (Nievergelt, Baker); Department of
Psychiatry, UCSD, La Jolla (Nievergelt, Maihofer,
Baker); Department of Preventive Medicine,
University of Southern California, Los Angeles
(Barkauskas); Department of Psychiatry and
Psychotherapy, University Medical Center
Hamburg-Eppendorf, Hamburg, Germany
(Agorastos).
Author Contributions: Drs Nievergelt and Baker
had full access to all the data in the study and take
responsibility for the integrity of the data and the
accuracy of the data analysis.
Study concept and design: Eraly, Nievergelt,
O’Connor, Baker.
Acquisition of data: Nievergelt, Biswas, O’Connor,
Baker.
Analysis and interpretation of data: Eraly,
Nievergelt, Maihofer, Barkauskas, Agorastos, Baker.
Drafting of the manuscript: Eraly, Nievergelt, Baker.
Critical revision of the manuscript for important
intellectual content: All authors.
Statistical analysis: Eraly, Nievergelt, Maihofer,
Barkauskas, Agorastos.
Obtained funding: Eraly, Baker.
Administrative, technical, or material support:
Biswas, O’Connor.
Study supervision: Nievergelt, Baker.
Conflict of Interest Disclosures: None reported.
Funding/Support: Dr Eraly was funded by a UCSD
Department of Medicine Career Award and by
National Heart, Lung, and Blood Institute grant
HL094728; Drs Nievergelt, O’Connor, Baker, and
MRS personnel were supported by VA Health
Service Research and Development Project
Number SDR 09-0128, National Institutes of Health
MH093500, the US Marine Corps, and the US Navy
Bureau of Medicine and Surgery.
Role of the Sponsor: The sponsors had no role in
the design and conduct of the study; collection,
management, analysis, and interpretation of the
data; preparation, review, or approval of the
manuscript; and decision to submit the manuscript
for publication.
Disclaimer: The content is solely the responsibility
of the authors and does not necessarily represent
the official views of the federal government.
Group Information: MRS coinvestigators: Mark A.
Geyer, PhD (Department of Psychiatry, UCSD),
Victoria B. Risbrough, PhD (VA Center of Excellence
for Stress and Mental Health and Department of
Psychiatry, UCSD), Gerald E. Larson, PhD (Naval
Health Research Center), Brett T. Litz, PhD
(Department of Psychiatry, Boston University
School of Medicine, VA Boston Healthcare System),
William P. Nash, MD (Boston VA Research Institute),
Nicholas J. Schork, PhD (Scripps Translational
Research Institute), Jennifer J. Vasterling, PhD
(Department of Psychiatry, Boston University
School of Medicine, VA Boston Healthcare System),
Paul S. Hammer, MD (Defense Center of Excellence
for Psychological Health and Traumatic Brain
Injury), and Jennifer A. Webb-Murphy, PhD (Naval
Center for Combat and Operational Stress Control);
members of the administrative core: Anjana Patel,
BS, BA, Andrew De La Rosa, BS, and Patricia
Gorman, BSc, DC; and members of the MRS Team,
including logistic coordinators, clinician-
interviewers, and data collection staff listed in our
methods article.29
Additional Contributions: Michael G. Ziegler, MD
(Department of Medicine, UCSD), Deborah L.
Wingard, PhD (Department of Family and
Preventative Medicine, UCSD), Felix K. Yam,
PharmD (School of Pharmacy, UCSD), and Florin
Vaida, PhD (Department of Family and Preventative
Medicine, UCSD) participated in helpful
discussions. We thank the Marine and Navy
Corpsmen volunteers for their military service and
participation in this study.
REFERENCES
1. Yehuda R. Post-traumatic stress disorder. N Engl J
Med. 2002;346(2):108-114.
2. Baker DG, Nievergelt CM, O’Connor DT.
Biomarkers of PTSD: neuropeptides and immune
signaling. Neuropharmacology. 2012;62(2):
663-673.
3. Spitzer C, Barnow S, Völzke H, et al. Association
of posttraumatic stress disorder with low-grade
elevation of C-reactive protein: evidence from the
general population. J Psychiatr Res.
2010;44(1):15-21.
4. von Kanel R, Begre S, Abbas CC, Saner H,
Gander ML, Schmid JP. Inflammatory biomarkers in
patients with posttraumatic stress disorder caused
by myocardial infarction and the role of depressive
symptoms. Neuroimmunomodulation.
2010;17(1):39-46.
5. von Kanel R, Hepp U, Kraemer B, et al. Evidence
for low-grade systemic proinflammatory activity in
patients with posttraumatic stress disorder.
J Psychiatr Res. 2007;41(9):744-752.
6. Aurer A, Aurer-Kozelj J, Stavljenić-Rukavina A,
Kalenić S, Ivić-Kardum M, Haban V. Inflammatory
mediators in saliva of patients with rapidly
progressive periodontitis during war stress induced
incidence increase. Coll Antropol.
1999;23(1):117-124.
C-Reactive Protein in PTSD Risk Original Investigation Research
jamapsychiatry.com JAMA Psychiatry April 2014 Volume 71, Number 4 429
Copyright 2014 American Medical Association. All rights reserved.
Downloaded From: http://archpsyc.jamanetwork.com/ by a University of California - San Diego User on 02/05/2015
8. Copyright 2014 American Medical Association. All rights reserved.
7. Hoge EA, Brandstetter K, Moshier S, Pollack MH,
Wong KK, Simon NM. Broad spectrum of cytokine
abnormalities in panic disorder and posttraumatic
stress disorder. Depress Anxiety. 2009;26(5):
447-455.
8. Tucker P, Jeon-Slaughter H, Pfefferbaum B, Khan
Q, Davis NJ. Emotional and biological stress
measures in Katrina survivors relocated to
Oklahoma. Am J Disaster Med. 2010;5(2):113-125.
9. Vidovic A, Gotovac K, Vilibic M, et al. Repeated
assessments of endocrine- and immune-related
changes in posttraumatic stress disorder.
Neuroimmunomodulation. 2011;18(4):199-211.
10. Guo M, Liu T, Guo JC, Jiang XL, Chen F, Gao YS.
Study on serum cytokine levels in posttraumatic
stress disorder patients. Asian Pac J Trop Med.
2012;5(4):323-325.
11. Maes M, Lin AH, Delmeire L, et al. Elevated
serum interleukin-6 (IL-6) and IL-6 receptor
concentrations in posttraumatic stress disorder
following accidental man-made traumatic events.
Biol Psychiatry. 1999;45(7):833-839.
12. Shoelson SE, Herrero L, Naaz A. Obesity,
inflammation, and insulin resistance.
Gastroenterology. 2007;132(6):2169-2180.
13. Olefsky JM, Glass CK. Macrophages,
inflammation, and insulin resistance. Annu Rev
Physiol. 2010;72:219-246.
14. Glass CK, Olefsky JM. Inflammation and lipid
signaling in the etiology of insulin resistance. Cell
Metab. 2012;15(5):635-645.
15. Mottillo S, Filion KB, Genest J, et al. The
metabolic syndrome and cardiovascular risk:
a systematic review and meta-analysis. J Am Coll
Cardiol. 2010;56(14):1113-1132.
16. Grundy SM. Pre-diabetes, metabolic syndrome,
and cardiovascular risk. J Am Coll Cardiol.
2012;59(7):635-643.
17. Agyemang C, Goosen S, Anujuo K, Ogedegbe G.
Relationship between post-traumatic stress
disorder and diabetes among 105 180 asylum
seekers in the Netherlands. Eur J Public Health.
2012;22(5):658-662.
18. Boyko EJ, Jacobson IG, Smith B, et al. Risk of
diabetes in US military service members in relation
to combat deployment and mental health. Diabetes
Care. 2010;33(8):1771-1777.
19. Qureshi SU, Pyne JM, Magruder KM, Schulz PE,
Kunik ME. The link between post-traumatic stress
disorder and physical comorbidities: a systematic
review. Psychiatr Q. 2009;80(2):87-97.
20. Jin H, Lanouette NM, Mudaliar S, et al.
Association of posttraumatic stress disorder with
increased prevalence of metabolic syndrome. J Clin
Psychopharmacol. 2009;29(3):210-215.
21. Heppner PS, Crawford EF, Haji UA, et al. The
association of posttraumatic stress disorder and
metabolic syndrome: a study of increased health
risk in veterans. BMC Med. 2009;7(1):1.
doi:10.1186/1741-7015-7-1.
22. Violanti JM, Fekedulegn D, Hartley TA, et al.
Police trauma and cardiovascular disease: association
between PTSD symptoms and metabolic syndrome.
Int J Emerg Ment Health. 2006;8(4):227-237.
23. Goodwin RD, Davidson JR. Self-reported
diabetes and posttraumatic stress disorder among
adults in the community. Prev Med.
2005;40(5):570-574.
24. Heppner PS, Lohr JB, Kash TP, Jin H, Wang H,
Baker DG. Metabolic syndrome: relative risk
associated with post-traumatic stress disorder
(PTSD) severity and antipsychotic medication use.
Psychosomatics. 2012;53(6):550-558.
25. Rohleder N, Karl A. Role of endocrine
and inflammatory alterations in comorbid somatic
diseases of post-traumatic stress disorder. Minerva
Endocrinol. 2006;31(4):273-288.
26. Gill JM, Saligan L, Woods S, Page G. PTSD is
associated with an excess of inflammatory immune
activities. Perspect Psychiatr Care. 2009;45(4):
262-277.
27. Jiang JX. Posttraumatic stress and immune
dissonance. Chin J Traumatol. 2008;11(4):203-208.
28. Seal KH, Bertenthal D, Miner CR, Sen S, Marmar
C. Bringing the war back home: mental health
disorders among 103,788 US veterans returning
from Iraq and Afghanistan seen at Department of
Veterans Affairs facilities. Arch Intern Med.
2007;167(5):476-482.
29. Baker DG, Nash WP, Litz BT, et al. Predictors of
risk and resilience for posttraumatic stress disorder
among ground combat Marines: methods of the
Marine Resiliency Study. Prev Chronic Dis.
2012;9:97. doi:10.5888/pcd9.110134.
30. Blake DD, Weathers FW, Nagy LM, et al. The
development of a Clinician-Administered PTSD
Scale. J Trauma Stress. 1995;8(1):75-90.
31. American Psychiatric Association. Diagnostic
and Statistical Manual of Mental Disorders. 4th ed,
text revision. Washington, DC: American Psychiatric
Association; 2000.
32. Schnyder U, Moergeli H, Klaghofer R,
Buddeberg C. Incidence and prediction of
posttraumatic stress disorder symptoms in severely
injured accident victims. Am J Psychiatry.
2001;158(4):594-599.
33. Pietrzak RH, Goldstein MB, Malley JC, Johnson
DC, Southwick SM. Subsyndromal posttraumatic
stress disorder is associated with health and
psychosocial difficulties in veterans of Operations
Enduring Freedom and Iraqi Freedom. Depress
Anxiety. 2009;26(8):739-744.
34. Adams RE, Boscarino JA, Galea S. Alcohol use,
mental health status and psychological well-being 2
years after the World Trade Center attacks in New
York City. Am J Drug Alcohol Abuse.
2006;32(2):203-224.
35. Santiago PN, Ursano RJ, Gray CL, et al.
A systematic review of PTSD prevalence and
trajectories in DSM-5 defined trauma exposed
populations: intentional and non-intentional
traumatic events. PLoS One. 2013;8(4):e59236.
doi:10.1371/journal.pone.0059236.
36. Duivis HE, de Jonge P, Penninx BW, Na BY,
Cohen BE, Whooley MA. Depressive symptoms,
health behaviors, and subsequent inflammation in
patients with coronary heart disease: prospective
findings from the Heart and Soul Study. Am J
Psychiatry. 2011;168(9):913-920.
37. Wium-Andersen MK, Orsted DD, Nielsen SF,
Nordestgaard BG. Elevated C-reactive protein levels,
psychological distress, and depression in 73 131
individuals. JAMA Psychiatry. 2013;70(2):176-184.
38. Gimeno D, Kivimaki M, Brunner EJ, et al.
Associations of C-reactive protein and interleukin-6
with cognitive symptoms of depression: 12-year
follow-up of the Whitehall II study. Psychol Med.
2009;39(3):413-423.
39. Whitfield JB, Heath AC, Madden PA, Pergadia
ML, Montgomery GW, Martin NG. Metabolic
and biochemical effects of low-to-moderate alcohol
consumption. Alcohol Clin Exp Res.
2013;37(4):575-586.
40. Alkerwi A, Boutsen M, Vaillant M, et al. Alcohol
consumption and the prevalence of metabolic
syndrome: a meta-analysis of observational studies.
Atherosclerosis. 2009;204(2):624-635.
41. Pai JK, Hankinson SE, Thadhani R, Rifai N,
Pischon T, Rimm EB. Moderate alcohol consumption
and lower levels of inflammatory markers in US men
and women. Atherosclerosis. 2006;186(1):113-120.
42. Deverts DJ, Cohen S, Kalra P, Matthews KA. The
prospective association of socioeconomic status
with C-reactive protein levels in the CARDIA study.
Brain Behav Immun. 2012;26(7):1128-1135.
43. Yanbaeva DG, Dentener MA, Creutzberg EC,
Wesseling G, Wouters EF. Systemic effects of
smoking. Chest. 2007;131(5):1557-1566.
44. Fu SS, McFall M, Saxon AJ, et al. Post-traumatic
stress disorder and smoking: a systematic review.
Nicotine Tob Res. 2007;9(11):1071-1084.
45. Schäfer I, Najavits LM. Clinical challenges in the
treatment of patients with posttraumatic stress
disorder and substance abuse. Curr Opin Psychiatry.
2007;20(6):614-618.
46. Deverts DJ, Cohen S, DiLillo VG, et al.
Depressive symptoms, race, and circulating
C-reactive protein: the Coronary Artery Risk
Development in Young Adults (CARDIA) study.
Psychosom Med. 2010;72(8):734-741.
47. Elovainio M, Keltikangas-Jarvinen L,
Pulkki-Raback L, et al. Depressive symptoms
and C-reactive protein: the Cardiovascular Risk in
Young Finns Study. Psychol Med. 2006;36(6):
797-805.
48. Morris AA, Zhao L, Ahmed Y, et al. Association
between depression and inflammation—differences
by race and sex: the META-Health study. Psychosom
Med. 2011;73(6):462-468.
49. Howren MB, Lamkin DM, Suls J. Associations of
depression with C-reactive protein, IL-1, and IL-6:
a meta-analysis. Psychosom Med. 2009;71(2):171-186.
50. De Berardis D, Campanella D, Gambi F, et al.
The role of C-reactive protein in mood disorders. Int
J Immunopathol Pharmacol. 2006;19(4):721-725.
51. Baker DG, Heppner P, Afari N, et al. Trauma
exposure, branch of service, and physical injury in
relation to mental health among US veterans
returning from Iraq and Afghanistan. Mil Med.
2009;174(8):773-778.
52. Rasmusson AM, Schnurr PP, Zukowska Z, Scioli
E, Forman DE. Adaptation to extreme stress:
post-traumatic stress disorder, neuropeptide Y
and metabolic syndrome. Exp Biol Med.
2010;235(10):1150-1162.
53. Forbes HJ, Jones N, Woodhead C, et al. What
are the effects of having an illness or injury whilst
deployed on post deployment mental health?
a population based record linkage study of UK army
personnel who have served in Iraq or Afghanistan.
BMC Psychiatry. 2012;12:178. doi:10.1186
/1471-244X-12-178.
54. McFarlane AC. Health surveillance of deployed
military personnel occasionally leads to unexpected
Research Original Investigation C-Reactive Protein in PTSD Risk
430 JAMA Psychiatry April 2014 Volume 71, Number 4 jamapsychiatry.com
Copyright 2014 American Medical Association. All rights reserved.
Downloaded From: http://archpsyc.jamanetwork.com/ by a University of California - San Diego User on 02/05/2015
9. Copyright 2014 American Medical Association. All rights reserved.
findings. BMC Med. 2012;10:126. doi:10.1186/1741
-7015-1110-1126.
55. Raison CL, Borisov AS, Majer M, et al Activation
of central nervous system inflammatory pathways
by interferon-alpha: relationship to monoamines
and depression. Biol Psychiatry. 2009;65(4):
296-303.
56. Miller AH, Maletic V, Raison CL. Inflammation
and its discontents: the role of cytokines in the
pathophysiology of major depression. Biol
Psychiatry. 2009;65(9):732-741.
57. Reichenberg A, Yirmiya R, Schuld A, et al.
Cytokine-associated emotional and cognitive
disturbances in humans. Arch Gen Psychiatry.
2001;58(5):445-452.
58. Harrison NA, Brydon L, Walker C, Gray MA,
Steptoe A, Critchley HD. Inflammation causes mood
changes through alterations in subgenual cingulate
activity and mesolimbic connectivity. Biol
Psychiatry. 2009;66(5):407-414.
59. Eisenberger NI, Berkman ET, Inagaki TK,
Rameson LT, Mashal NM, Irwin MR.
Inflammation-induced anhedonia: endotoxin
reduces ventral striatum responses to reward. Biol
Psychiatry. 2010;68(8):748-754.
60. Wright CE, Strike PC, Brydon L, Steptoe A.
Acute inflammation and negative mood: mediation
by cytokine activation. Brain Behav Immun.
2005;19(4):345-350.
61. Miyaoka H, Otsubo T, Kamijima K, Ishii M, Onuki
M, Mitamura K. Depression from interferon therapy
in patients with hepatitis C. Am J Psychiatry.
1999;156(7):1120.
62. Musselman DL, Lawson DH, Gumnick JF, et al.
Paroxetine for the prevention of depression
induced by high-dose interferon alfa. N Engl J Med.
2001;344(13):961-966.
63. Valentine AD, Meyers CA, Kling MA, Richelson
E, Hauser P. Mood and cognitive side effects of
interferon-alpha therapy. Semin Oncol.
1998;25(1)(suppl 1):39-47.
64. Raison CL, Miller AH. Is depression
an inflammatory disorder? Curr Psychiatry Rep.
2011;13(6):467-475.
65. Komulainen P, Lakka TA, Kivipelto M, et al.
Serum high sensitivity C-reactive protein
and cognitive function in elderly women. Age
Ageing. 2007;36(4):443-448.
66. Wersching H, Duning T, Lohmann H, et al.
Serum C-reactive protein is linked to cerebral
microstructural integrity and cognitive function.
Neurology. 2010;74(13):1022-1029.
67. Cavalieri M, Ropele S, Petrovic K, et al.
Metabolic syndrome, brain magnetic resonance
imaging, and cognition. Diabetes Care.
2010;33(12):2489-2495.
68. Bettcher BM, Wilheim R, Rigby T, et al.
C-reactive protein is related to memory and medial
temporal brain volume in older adults. Brain Behav
Immun. 2012;26(1):103-108.
69. Elderkin-Thompson V, Irwin MR, Hellemann G,
Kumar A. Interleukin-6 and memory functions of
encoding and recall in healthy and depressed
elderly adults. Am J Geriatr Psychiatry.
2012;20(9):753-763.
70. Goshen I, Kreisel T, Ben-Menachem-Zidon O,
et al. Brain interleukin-1 mediates chronic
stress-induced depression in mice via
adrenocortical activation and hippocampal
neurogenesis suppression. Mol Psychiatry.
2008;13(7):717-728.
71. Frodl T, Carballedo A, Hughes MM, et al.
Reduced expression of glucocorticoid-inducible
genes GILZ and SGK-1: high IL-6 levels are
associated with reduced hippocampal volumes in
major depressive disorder. Transl Psychiatry.
2012;2:e88. doi:10.1038/tp.2012.1014.
72. Gilbertson MW, Shenton ME, Ciszewski A, et al.
Smaller hippocampal volume predicts pathologic
vulnerability to psychological trauma. Nat Neurosci.
2002;5(11):1242-1247.
73. Pitman RK, Gilbertson MW, Gurvits TV, et al;
Harvard/VA PTSD Twin Study Investigators.
Clarifying the origin of biological abnormalities in
PTSD through the study of identical twins
discordant for combat exposure. Ann N Y Acad Sci.
2006;1071(11):242-254.
74. Copeland WE, Shanahan L, Worthman C,
Angold A, Costello EJ. Cumulative depression
episodes predict later C-reactive protein levels:
a prospective analysis. Biol Psychiatry.
2012;71(1):15-21.
75. Chida Y, Sudo N, Sonoda J, Hiramoto T, Kubo C.
Early-life psychological stress exacerbates adult
mouse asthma via the hypothalamus-pituitary-
adrenal axis. Am J Respir Crit Care Med.
2007;175(4):316-322.
76. Wei L, Simen A, Mane S, Kaffman A. Early life
stress inhibits expression of a novel innate immune
pathway in the developing hippocampus.
Neuropsychopharmacology. 2012;37(2):567-580.
77. Powell ND, Bailey MT, Mays JW, et al. Repeated
social defeat activates dendritic cells and enhances
Toll-like receptor dependent cytokine secretion.
Brain Behav Immun. 2009;23(2):225-231.
78. Pepys MB, Hirschfield GM, Tennent GA, et al.
Targeting C-reactive protein for the treatment of
cardiovascular disease. Nature. 2006;440(7088):
1217-1221.
79. Kao PC, Shiesh SC, Wu TJ. Serum C-reactive
protein as a marker for wellness assessment. Ann
Clin Lab Sci. 2006;36(2):163-169.
80. Shen J, Ordovas JM. Impact of genetic
and environmental factors on hsCRP
concentrations and response to therapeutic agents.
Clin Chem. 2009;55(2):256-264.
81. Beavers KM, Nicklas BJ, Shen J, et al. Effects of
lifestyle interventions on inflammatory markers in
the metabolic syndrome. Front Biosci (Schol Ed).
2011;3(2):168-177.
C-Reactive Protein in PTSD Risk Original Investigation Research
jamapsychiatry.com JAMA Psychiatry April 2014 Volume 71, Number 4 431
Copyright 2014 American Medical Association. All rights reserved.
Downloaded From: http://archpsyc.jamanetwork.com/ by a University of California - San Diego User on 02/05/2015