SlideShare a Scribd company logo
1 of 20
Download to read offline
data.table talk
January 21, 2015
The data.table package
author: Pete Dodd date: 4 November, 2014
dataframes in R
What is a dataframe?
default R objects for holding data
can mix numeric, and text data
ordered/unordered factors
many statistical functions require dataframe inputs
dataframes in R
Problems:
print!
slow searching
verbose syntax
no built-in methods for aggregation
Which is most annoying depends on who you are. . .
Constructing data.tables
myDT <- data.table(
number=1:3,
letter=c('a','b','c')
) # like data.frame constructor
myDT2 <- as.data.frame(myDF) #conversion
The data.table class inherits dataframe, so data.tables (mostly) can
be used exactly like dataframes, and should not break existing code.
Examples
WHO TB data:
D <- read.csv('TB_burden_countries_2014-09-10.csv')
names(D)[1:10]
## [1] "country" "iso2" "iso3"
## [5] "g_whoregion" "year" "e_pop_num"
## [9] "e_prev_100k_lo" "e_prev_100k_hi"
Examples
WHO TB data:
head(D[,c(1,6,8)])
## country year e_prev_100k
## 1 Afghanistan 1990 327
## 2 Afghanistan 1991 359
## 3 Afghanistan 1992 387
## 4 Afghanistan 1993 412
## 5 Afghanistan 1994 431
## 6 Afghanistan 1995 447
Examples
Mean TB in Afghanistan
mean(D[D$country=='Afghanistan','e_prev_100k'])
## [1] 397.6087
As data.table:
library(data.table)
E <- as.data.table(D) #convert
E[country=='Afghanistan',mean(e_prev_100k)]
## [1] 397.6087
Examples
dataframe multi-column access:
D[D$country=='Afghanistan',
c('e_prev_100k','e_prev_100k_lo',
'e_prev_100k_hi')]
data.table multi-column means, renamed:
E[country=='Afghanistan',
list(mid=mean(e_prev_100k),
lo=mean(e_prev_100k_lo),
hi=mean(e_prev_100k_hi))]
## mid lo hi
## 1: 397.6087 187.913 684.7391
Examples
Means for each country? data.table solution:
E[,list(mid=mean(e_prev_100k)),by=country]
## country mid
## 1: Afghanistan 397.60870
## 2: Albania 29.52174
## 3: Algeria 133.95652
## 4: American Samoa 15.09130
## 5: Andorra 30.71304
## ---
## 215: Wallis and Futuna Islands 117.86957
## 216: West Bank and Gaza Strip 11.14783
## 217: Yemen 180.30435
## 218: Zambia 501.39130
## 219: Zimbabwe 386.30435
Examples
A more complicated example:
E[,
list(lo=mean(e_prev_100k_lo),
hi=mean(e_prev_100k_hi)),
by=list(country,
century=factor(year<2000)
)]
Examples
Output:
## country century lo hi
## 1: Afghanistan TRUE 189.20000 749.80000
## 2: Afghanistan FALSE 186.92308 634.69231
## 3: Albania TRUE 13.20000 65.40000
## 4: Albania FALSE 10.59231 47.53846
## 5: Algeria TRUE 49.40000 212.80000
## ---
## 427: Yemen FALSE 62.69231 218.38462
## 428: Zambia TRUE 291.60000 1024.90000
## 429: Zambia FALSE 197.00000 733.76923
## 430: Zimbabwe TRUE 14.81000 1074.60000
## 431: Zimbabwe FALSE 56.07692 1219.61538
Examples
eo <- E[,plot(sort(e_prev_100k))]
0 1000 2000 3000 4000 5000
050010001500
Index
sort(e_prev_100k)
(1-
line combination with aggregations
Fast insertion
A new column can be inserted by:
E[,country_t := paste0(country,year)]
head(E[,country_t])
## [1] "Afghanistan1990" "Afghanistan1991" "Afghanistan1992
## [5] "Afghanistan1994" "Afghanistan1995"
Keys: fast row retrieval
Need to pre-compute (setkey line)
setkey(E,country) #must be sorted
E['Afghanistan',e_inc_100k]
## country e_inc_100k
## 1: Afghanistan 189
## 2: Afghanistan 189
## 3: Afghanistan 189
## 4: Afghanistan 189
## 5: Afghanistan 189
## 6: Afghanistan 189
## 7: Afghanistan 189
## 8: Afghanistan 189
## 9: Afghanistan 189
## 10: Afghanistan 189
## 11: Afghanistan 189
## 12: Afghanistan 189
Gotchas: column access
E[,1]
## [1] 1
E[,1,with=FALSE]
## country
## 1: Afghanistan
## 2: Afghanistan
## 3: Afghanistan
## 4: Afghanistan
## 5: Afghanistan
## ---
## 4899: Zimbabwe
## 4900: Zimbabwe
## 4901: Zimbabwe
## 4902: Zimbabwe
## 4903: Zimbabwe
Gotchas: copying
E2 <- E
E[,foo:='bar']
head(E2[,foo])
## [1] "bar" "bar" "bar" "bar" "bar" "bar"
Gotchas: copying
This is because copying is by reference.
Use:
E2 <- copy(E)
instead.
Summary
more compact
faster (sometimes lots)
less memory
great for aggregation/exploratory data crunching
But: - a few traps for the unwary
Good package vignettes & FAQ,
Related
aggregate in base R
plyr: use of ddply
sqldf: good if you know SQL
RSQLlite: ditto
other: - RODBC etc: talk to databases - dplyr: nascent, by Hadley,
internal & external

More Related Content

What's hot

Introduction to pandas
Introduction to pandasIntroduction to pandas
Introduction to pandasPiyush rai
 
Introduction to Pandas and Time Series Analysis [PyCon DE]
Introduction to Pandas and Time Series Analysis [PyCon DE]Introduction to Pandas and Time Series Analysis [PyCon DE]
Introduction to Pandas and Time Series Analysis [PyCon DE]Alexander Hendorf
 
Move your data (Hans Rosling style) with googleVis + 1 line of R code
Move your data (Hans Rosling style) with googleVis + 1 line of R codeMove your data (Hans Rosling style) with googleVis + 1 line of R code
Move your data (Hans Rosling style) with googleVis + 1 line of R codeJeffrey Breen
 
4 R Tutorial DPLYR Apply Function
4 R Tutorial DPLYR Apply Function4 R Tutorial DPLYR Apply Function
4 R Tutorial DPLYR Apply FunctionSakthi Dasans
 
Python Seaborn Data Visualization
Python Seaborn Data Visualization Python Seaborn Data Visualization
Python Seaborn Data Visualization Sourabh Sahu
 
2. R-basics, Vectors, Arrays, Matrices, Factors
2. R-basics, Vectors, Arrays, Matrices, Factors2. R-basics, Vectors, Arrays, Matrices, Factors
2. R-basics, Vectors, Arrays, Matrices, Factorskrishna singh
 
R Programming: Importing Data In R
R Programming: Importing Data In RR Programming: Importing Data In R
R Programming: Importing Data In RRsquared Academy
 
Data preparation, depth function
Data preparation, depth functionData preparation, depth function
Data preparation, depth functionFAO
 
Python Pandas
Python PandasPython Pandas
Python PandasSunil OS
 
10. Getting Spatial
10. Getting Spatial10. Getting Spatial
10. Getting SpatialFAO
 
R Programming: Export/Output Data In R
R Programming: Export/Output Data In RR Programming: Export/Output Data In R
R Programming: Export/Output Data In RRsquared Academy
 
R Programming: Learn To Manipulate Strings In R
R Programming: Learn To Manipulate Strings In RR Programming: Learn To Manipulate Strings In R
R Programming: Learn To Manipulate Strings In RRsquared Academy
 
3 R Tutorial Data Structure
3 R Tutorial Data Structure3 R Tutorial Data Structure
3 R Tutorial Data StructureSakthi Dasans
 
Pandas Cheat Sheet
Pandas Cheat SheetPandas Cheat Sheet
Pandas Cheat SheetACASH1011
 

What's hot (20)

Introduction to pandas
Introduction to pandasIntroduction to pandas
Introduction to pandas
 
Rsplit apply combine
Rsplit apply combineRsplit apply combine
Rsplit apply combine
 
Introduction to Pandas and Time Series Analysis [PyCon DE]
Introduction to Pandas and Time Series Analysis [PyCon DE]Introduction to Pandas and Time Series Analysis [PyCon DE]
Introduction to Pandas and Time Series Analysis [PyCon DE]
 
Move your data (Hans Rosling style) with googleVis + 1 line of R code
Move your data (Hans Rosling style) with googleVis + 1 line of R codeMove your data (Hans Rosling style) with googleVis + 1 line of R code
Move your data (Hans Rosling style) with googleVis + 1 line of R code
 
R factors
R   factorsR   factors
R factors
 
R seminar dplyr package
R seminar dplyr packageR seminar dplyr package
R seminar dplyr package
 
4 R Tutorial DPLYR Apply Function
4 R Tutorial DPLYR Apply Function4 R Tutorial DPLYR Apply Function
4 R Tutorial DPLYR Apply Function
 
R code for data manipulation
R code for data manipulationR code for data manipulation
R code for data manipulation
 
Python Seaborn Data Visualization
Python Seaborn Data Visualization Python Seaborn Data Visualization
Python Seaborn Data Visualization
 
2. R-basics, Vectors, Arrays, Matrices, Factors
2. R-basics, Vectors, Arrays, Matrices, Factors2. R-basics, Vectors, Arrays, Matrices, Factors
2. R-basics, Vectors, Arrays, Matrices, Factors
 
Pandas
PandasPandas
Pandas
 
R Programming: Importing Data In R
R Programming: Importing Data In RR Programming: Importing Data In R
R Programming: Importing Data In R
 
Data preparation, depth function
Data preparation, depth functionData preparation, depth function
Data preparation, depth function
 
Python Pandas
Python PandasPython Pandas
Python Pandas
 
Data Analysis in Python
Data Analysis in PythonData Analysis in Python
Data Analysis in Python
 
10. Getting Spatial
10. Getting Spatial10. Getting Spatial
10. Getting Spatial
 
R Programming: Export/Output Data In R
R Programming: Export/Output Data In RR Programming: Export/Output Data In R
R Programming: Export/Output Data In R
 
R Programming: Learn To Manipulate Strings In R
R Programming: Learn To Manipulate Strings In RR Programming: Learn To Manipulate Strings In R
R Programming: Learn To Manipulate Strings In R
 
3 R Tutorial Data Structure
3 R Tutorial Data Structure3 R Tutorial Data Structure
3 R Tutorial Data Structure
 
Pandas Cheat Sheet
Pandas Cheat SheetPandas Cheat Sheet
Pandas Cheat Sheet
 

Viewers also liked

How to win $10m - analysing DOTA2 data in R (Sheffield R Users Group - May)
How to win $10m - analysing DOTA2 data in R (Sheffield R Users Group - May)How to win $10m - analysing DOTA2 data in R (Sheffield R Users Group - May)
How to win $10m - analysing DOTA2 data in R (Sheffield R Users Group - May)Paul Richards
 
Sheffield R Jan 2015 - Using R to investigate parasite infections in Asian el...
Sheffield R Jan 2015 - Using R to investigate parasite infections in Asian el...Sheffield R Jan 2015 - Using R to investigate parasite infections in Asian el...
Sheffield R Jan 2015 - Using R to investigate parasite infections in Asian el...Paul Richards
 
Sheffield_R_ July meeting - Interacting with R - IDEs, Git and workflow
Sheffield_R_ July meeting - Interacting with R - IDEs, Git and workflowSheffield_R_ July meeting - Interacting with R - IDEs, Git and workflow
Sheffield_R_ July meeting - Interacting with R - IDEs, Git and workflowPaul Richards
 
Introduction to knitr - May Sheffield R Users group
Introduction to knitr - May Sheffield R Users groupIntroduction to knitr - May Sheffield R Users group
Introduction to knitr - May Sheffield R Users groupPaul Richards
 
constants, variables and datatypes in C
constants, variables and datatypes in Cconstants, variables and datatypes in C
constants, variables and datatypes in CSahithi Naraparaju
 
Data and its types by adeel
Data and its types by adeelData and its types by adeel
Data and its types by adeelAyaan Adeel
 
Concept Of C++ Data Types
Concept Of C++ Data TypesConcept Of C++ Data Types
Concept Of C++ Data Typesk v
 
How to Present Data in PowerPoint
How to Present Data in PowerPointHow to Present Data in PowerPoint
How to Present Data in PowerPointMatt Hunter
 

Viewers also liked (11)

How to win $10m - analysing DOTA2 data in R (Sheffield R Users Group - May)
How to win $10m - analysing DOTA2 data in R (Sheffield R Users Group - May)How to win $10m - analysing DOTA2 data in R (Sheffield R Users Group - May)
How to win $10m - analysing DOTA2 data in R (Sheffield R Users Group - May)
 
Sheffield R Jan 2015 - Using R to investigate parasite infections in Asian el...
Sheffield R Jan 2015 - Using R to investigate parasite infections in Asian el...Sheffield R Jan 2015 - Using R to investigate parasite infections in Asian el...
Sheffield R Jan 2015 - Using R to investigate parasite infections in Asian el...
 
Sheffield_R_ July meeting - Interacting with R - IDEs, Git and workflow
Sheffield_R_ July meeting - Interacting with R - IDEs, Git and workflowSheffield_R_ July meeting - Interacting with R - IDEs, Git and workflow
Sheffield_R_ July meeting - Interacting with R - IDEs, Git and workflow
 
Introduction to knitr - May Sheffield R Users group
Introduction to knitr - May Sheffield R Users groupIntroduction to knitr - May Sheffield R Users group
Introduction to knitr - May Sheffield R Users group
 
constants, variables and datatypes in C
constants, variables and datatypes in Cconstants, variables and datatypes in C
constants, variables and datatypes in C
 
Data and its types by adeel
Data and its types by adeelData and its types by adeel
Data and its types by adeel
 
Data types
Data typesData types
Data types
 
Data presentation 2
Data presentation 2Data presentation 2
Data presentation 2
 
Presentation of data
Presentation of dataPresentation of data
Presentation of data
 
Concept Of C++ Data Types
Concept Of C++ Data TypesConcept Of C++ Data Types
Concept Of C++ Data Types
 
How to Present Data in PowerPoint
How to Present Data in PowerPointHow to Present Data in PowerPoint
How to Present Data in PowerPoint
 

Similar to The data.table Package: A Faster Way to Work with Dataframes in R

Webinar: The Whys and Hows of Predictive Modelling
Webinar: The Whys and Hows of Predictive Modelling Webinar: The Whys and Hows of Predictive Modelling
Webinar: The Whys and Hows of Predictive Modelling Edureka!
 
Data structure manual
Data structure manualData structure manual
Data structure manualsameer farooq
 
"Optimization of a .NET application- is it simple ! / ?", Yevhen Tatarynov
"Optimization of a .NET application- is it simple ! / ?",  Yevhen Tatarynov"Optimization of a .NET application- is it simple ! / ?",  Yevhen Tatarynov
"Optimization of a .NET application- is it simple ! / ?", Yevhen TatarynovFwdays
 
Data manipulation and visualization in r 20190711 myanmarucsy
Data manipulation and visualization in r 20190711 myanmarucsyData manipulation and visualization in r 20190711 myanmarucsy
Data manipulation and visualization in r 20190711 myanmarucsySmartHinJ
 
3. R- list and data frame
3. R- list and data frame3. R- list and data frame
3. R- list and data framekrishna singh
 
Getting started with Pandas Cheatsheet.pdf
Getting started with Pandas Cheatsheet.pdfGetting started with Pandas Cheatsheet.pdf
Getting started with Pandas Cheatsheet.pdfSudhakarVenkey
 
R Programming.pptx
R Programming.pptxR Programming.pptx
R Programming.pptxkalai75
 
fINAL Lesson_5_Data_Manipulation_using_R_v1.pptx
fINAL Lesson_5_Data_Manipulation_using_R_v1.pptxfINAL Lesson_5_Data_Manipulation_using_R_v1.pptx
fINAL Lesson_5_Data_Manipulation_using_R_v1.pptxdataKarthik
 
Introduction to R
Introduction to RIntroduction to R
Introduction to RStacy Irwin
 
Writing Readable Code with Pipes
Writing Readable Code with PipesWriting Readable Code with Pipes
Writing Readable Code with PipesRsquared Academy
 
CUDA First Programs: Computer Architecture CSE448 : UAA Alaska : Notes
CUDA First Programs: Computer Architecture CSE448 : UAA Alaska : NotesCUDA First Programs: Computer Architecture CSE448 : UAA Alaska : Notes
CUDA First Programs: Computer Architecture CSE448 : UAA Alaska : NotesSubhajit Sahu
 
Python Programming.pptx
Python Programming.pptxPython Programming.pptx
Python Programming.pptxSudhakarVenkey
 

Similar to The data.table Package: A Faster Way to Work with Dataframes in R (20)

R Programming Homework Help
R Programming Homework HelpR Programming Homework Help
R Programming Homework Help
 
Doc 20180130-wa0005
Doc 20180130-wa0005Doc 20180130-wa0005
Doc 20180130-wa0005
 
Doc 20180130-wa0004-1
Doc 20180130-wa0004-1Doc 20180130-wa0004-1
Doc 20180130-wa0004-1
 
Doc 20180130-wa0004
Doc 20180130-wa0004Doc 20180130-wa0004
Doc 20180130-wa0004
 
Introduction to tibbles
Introduction to tibblesIntroduction to tibbles
Introduction to tibbles
 
RBootcam Day 2
RBootcam Day 2RBootcam Day 2
RBootcam Day 2
 
Webinar: The Whys and Hows of Predictive Modelling
Webinar: The Whys and Hows of Predictive Modelling Webinar: The Whys and Hows of Predictive Modelling
Webinar: The Whys and Hows of Predictive Modelling
 
Data structure manual
Data structure manualData structure manual
Data structure manual
 
"Optimization of a .NET application- is it simple ! / ?", Yevhen Tatarynov
"Optimization of a .NET application- is it simple ! / ?",  Yevhen Tatarynov"Optimization of a .NET application- is it simple ! / ?",  Yevhen Tatarynov
"Optimization of a .NET application- is it simple ! / ?", Yevhen Tatarynov
 
Data manipulation and visualization in r 20190711 myanmarucsy
Data manipulation and visualization in r 20190711 myanmarucsyData manipulation and visualization in r 20190711 myanmarucsy
Data manipulation and visualization in r 20190711 myanmarucsy
 
3. R- list and data frame
3. R- list and data frame3. R- list and data frame
3. R- list and data frame
 
Getting started with Pandas Cheatsheet.pdf
Getting started with Pandas Cheatsheet.pdfGetting started with Pandas Cheatsheet.pdf
Getting started with Pandas Cheatsheet.pdf
 
R Programming.pptx
R Programming.pptxR Programming.pptx
R Programming.pptx
 
fINAL Lesson_5_Data_Manipulation_using_R_v1.pptx
fINAL Lesson_5_Data_Manipulation_using_R_v1.pptxfINAL Lesson_5_Data_Manipulation_using_R_v1.pptx
fINAL Lesson_5_Data_Manipulation_using_R_v1.pptx
 
Introduction to R
Introduction to RIntroduction to R
Introduction to R
 
Computer Science Assignment Help
Computer Science Assignment Help Computer Science Assignment Help
Computer Science Assignment Help
 
Writing Readable Code with Pipes
Writing Readable Code with PipesWriting Readable Code with Pipes
Writing Readable Code with Pipes
 
Big Data Analytics Lab File
Big Data Analytics Lab FileBig Data Analytics Lab File
Big Data Analytics Lab File
 
CUDA First Programs: Computer Architecture CSE448 : UAA Alaska : Notes
CUDA First Programs: Computer Architecture CSE448 : UAA Alaska : NotesCUDA First Programs: Computer Architecture CSE448 : UAA Alaska : Notes
CUDA First Programs: Computer Architecture CSE448 : UAA Alaska : Notes
 
Python Programming.pptx
Python Programming.pptxPython Programming.pptx
Python Programming.pptx
 

More from Paul Richards

SheffieldR July Meeting - Multiple Imputation with Chained Equations (MICE) p...
SheffieldR July Meeting - Multiple Imputation with Chained Equations (MICE) p...SheffieldR July Meeting - Multiple Imputation with Chained Equations (MICE) p...
SheffieldR July Meeting - Multiple Imputation with Chained Equations (MICE) p...Paul Richards
 
Preparing and submitting a package to CRAN - June Sanderson, Sheffield R User...
Preparing and submitting a package to CRAN - June Sanderson, Sheffield R User...Preparing and submitting a package to CRAN - June Sanderson, Sheffield R User...
Preparing and submitting a package to CRAN - June Sanderson, Sheffield R User...Paul Richards
 
Querying open data with R - Talk at April SheffieldR Users Gp
Querying open data with R - Talk at April SheffieldR Users GpQuerying open data with R - Talk at April SheffieldR Users Gp
Querying open data with R - Talk at April SheffieldR Users GpPaul Richards
 
OrienteeRing - using R to optimise mini mountain marathon routes - Pete Dodd ...
OrienteeRing - using R to optimise mini mountain marathon routes - Pete Dodd ...OrienteeRing - using R to optimise mini mountain marathon routes - Pete Dodd ...
OrienteeRing - using R to optimise mini mountain marathon routes - Pete Dodd ...Paul Richards
 
Phylogeny in R - Bianca Santini Sheffield R Users March 2015
Phylogeny in R - Bianca Santini Sheffield R Users March 2015Phylogeny in R - Bianca Santini Sheffield R Users March 2015
Phylogeny in R - Bianca Santini Sheffield R Users March 2015Paul Richards
 
Intro to ggplot2 - Sheffield R Users Group, Feb 2015
Intro to ggplot2 - Sheffield R Users Group, Feb 2015Intro to ggplot2 - Sheffield R Users Group, Feb 2015
Intro to ggplot2 - Sheffield R Users Group, Feb 2015Paul Richards
 
Introduction to Shiny for building web apps in R
Introduction to Shiny for building web apps in RIntroduction to Shiny for building web apps in R
Introduction to Shiny for building web apps in RPaul Richards
 

More from Paul Richards (7)

SheffieldR July Meeting - Multiple Imputation with Chained Equations (MICE) p...
SheffieldR July Meeting - Multiple Imputation with Chained Equations (MICE) p...SheffieldR July Meeting - Multiple Imputation with Chained Equations (MICE) p...
SheffieldR July Meeting - Multiple Imputation with Chained Equations (MICE) p...
 
Preparing and submitting a package to CRAN - June Sanderson, Sheffield R User...
Preparing and submitting a package to CRAN - June Sanderson, Sheffield R User...Preparing and submitting a package to CRAN - June Sanderson, Sheffield R User...
Preparing and submitting a package to CRAN - June Sanderson, Sheffield R User...
 
Querying open data with R - Talk at April SheffieldR Users Gp
Querying open data with R - Talk at April SheffieldR Users GpQuerying open data with R - Talk at April SheffieldR Users Gp
Querying open data with R - Talk at April SheffieldR Users Gp
 
OrienteeRing - using R to optimise mini mountain marathon routes - Pete Dodd ...
OrienteeRing - using R to optimise mini mountain marathon routes - Pete Dodd ...OrienteeRing - using R to optimise mini mountain marathon routes - Pete Dodd ...
OrienteeRing - using R to optimise mini mountain marathon routes - Pete Dodd ...
 
Phylogeny in R - Bianca Santini Sheffield R Users March 2015
Phylogeny in R - Bianca Santini Sheffield R Users March 2015Phylogeny in R - Bianca Santini Sheffield R Users March 2015
Phylogeny in R - Bianca Santini Sheffield R Users March 2015
 
Intro to ggplot2 - Sheffield R Users Group, Feb 2015
Intro to ggplot2 - Sheffield R Users Group, Feb 2015Intro to ggplot2 - Sheffield R Users Group, Feb 2015
Intro to ggplot2 - Sheffield R Users Group, Feb 2015
 
Introduction to Shiny for building web apps in R
Introduction to Shiny for building web apps in RIntroduction to Shiny for building web apps in R
Introduction to Shiny for building web apps in R
 

Recently uploaded

CRM Contender Series: HubSpot vs. Salesforce
CRM Contender Series: HubSpot vs. SalesforceCRM Contender Series: HubSpot vs. Salesforce
CRM Contender Series: HubSpot vs. SalesforceBrainSell Technologies
 
Alluxio Monthly Webinar | Cloud-Native Model Training on Distributed Data
Alluxio Monthly Webinar | Cloud-Native Model Training on Distributed DataAlluxio Monthly Webinar | Cloud-Native Model Training on Distributed Data
Alluxio Monthly Webinar | Cloud-Native Model Training on Distributed DataAlluxio, Inc.
 
Balasore Best It Company|| Top 10 IT Company || Balasore Software company Odisha
Balasore Best It Company|| Top 10 IT Company || Balasore Software company OdishaBalasore Best It Company|| Top 10 IT Company || Balasore Software company Odisha
Balasore Best It Company|| Top 10 IT Company || Balasore Software company Odishasmiwainfosol
 
Cloud Data Center Network Construction - IEEE
Cloud Data Center Network Construction - IEEECloud Data Center Network Construction - IEEE
Cloud Data Center Network Construction - IEEEVICTOR MAESTRE RAMIREZ
 
Folding Cheat Sheet #4 - fourth in a series
Folding Cheat Sheet #4 - fourth in a seriesFolding Cheat Sheet #4 - fourth in a series
Folding Cheat Sheet #4 - fourth in a seriesPhilip Schwarz
 
How to submit a standout Adobe Champion Application
How to submit a standout Adobe Champion ApplicationHow to submit a standout Adobe Champion Application
How to submit a standout Adobe Champion ApplicationBradBedford3
 
SpotFlow: Tracking Method Calls and States at Runtime
SpotFlow: Tracking Method Calls and States at RuntimeSpotFlow: Tracking Method Calls and States at Runtime
SpotFlow: Tracking Method Calls and States at Runtimeandrehoraa
 
Automate your Kamailio Test Calls - Kamailio World 2024
Automate your Kamailio Test Calls - Kamailio World 2024Automate your Kamailio Test Calls - Kamailio World 2024
Automate your Kamailio Test Calls - Kamailio World 2024Andreas Granig
 
EY_Graph Database Powered Sustainability
EY_Graph Database Powered SustainabilityEY_Graph Database Powered Sustainability
EY_Graph Database Powered SustainabilityNeo4j
 
Catch the Wave: SAP Event-Driven and Data Streaming for the Intelligence Ente...
Catch the Wave: SAP Event-Driven and Data Streaming for the Intelligence Ente...Catch the Wave: SAP Event-Driven and Data Streaming for the Intelligence Ente...
Catch the Wave: SAP Event-Driven and Data Streaming for the Intelligence Ente...confluent
 
Maximizing Efficiency and Profitability with OnePlan’s Professional Service A...
Maximizing Efficiency and Profitability with OnePlan’s Professional Service A...Maximizing Efficiency and Profitability with OnePlan’s Professional Service A...
Maximizing Efficiency and Profitability with OnePlan’s Professional Service A...OnePlan Solutions
 
英国UN学位证,北安普顿大学毕业证书1:1制作
英国UN学位证,北安普顿大学毕业证书1:1制作英国UN学位证,北安普顿大学毕业证书1:1制作
英国UN学位证,北安普顿大学毕业证书1:1制作qr0udbr0
 
GOING AOT WITH GRAALVM – DEVOXX GREECE.pdf
GOING AOT WITH GRAALVM – DEVOXX GREECE.pdfGOING AOT WITH GRAALVM – DEVOXX GREECE.pdf
GOING AOT WITH GRAALVM – DEVOXX GREECE.pdfAlina Yurenko
 
What are the key points to focus on before starting to learn ETL Development....
What are the key points to focus on before starting to learn ETL Development....What are the key points to focus on before starting to learn ETL Development....
What are the key points to focus on before starting to learn ETL Development....kzayra69
 
PREDICTING RIVER WATER QUALITY ppt presentation
PREDICTING  RIVER  WATER QUALITY  ppt presentationPREDICTING  RIVER  WATER QUALITY  ppt presentation
PREDICTING RIVER WATER QUALITY ppt presentationvaddepallysandeep122
 
Buds n Tech IT Solutions: Top-Notch Web Services in Noida
Buds n Tech IT Solutions: Top-Notch Web Services in NoidaBuds n Tech IT Solutions: Top-Notch Web Services in Noida
Buds n Tech IT Solutions: Top-Notch Web Services in Noidabntitsolutionsrishis
 
Implementing Zero Trust strategy with Azure
Implementing Zero Trust strategy with AzureImplementing Zero Trust strategy with Azure
Implementing Zero Trust strategy with AzureDinusha Kumarasiri
 

Recently uploaded (20)

CRM Contender Series: HubSpot vs. Salesforce
CRM Contender Series: HubSpot vs. SalesforceCRM Contender Series: HubSpot vs. Salesforce
CRM Contender Series: HubSpot vs. Salesforce
 
2.pdf Ejercicios de programación competitiva
2.pdf Ejercicios de programación competitiva2.pdf Ejercicios de programación competitiva
2.pdf Ejercicios de programación competitiva
 
Alluxio Monthly Webinar | Cloud-Native Model Training on Distributed Data
Alluxio Monthly Webinar | Cloud-Native Model Training on Distributed DataAlluxio Monthly Webinar | Cloud-Native Model Training on Distributed Data
Alluxio Monthly Webinar | Cloud-Native Model Training on Distributed Data
 
Advantages of Odoo ERP 17 for Your Business
Advantages of Odoo ERP 17 for Your BusinessAdvantages of Odoo ERP 17 for Your Business
Advantages of Odoo ERP 17 for Your Business
 
Balasore Best It Company|| Top 10 IT Company || Balasore Software company Odisha
Balasore Best It Company|| Top 10 IT Company || Balasore Software company OdishaBalasore Best It Company|| Top 10 IT Company || Balasore Software company Odisha
Balasore Best It Company|| Top 10 IT Company || Balasore Software company Odisha
 
Cloud Data Center Network Construction - IEEE
Cloud Data Center Network Construction - IEEECloud Data Center Network Construction - IEEE
Cloud Data Center Network Construction - IEEE
 
Folding Cheat Sheet #4 - fourth in a series
Folding Cheat Sheet #4 - fourth in a seriesFolding Cheat Sheet #4 - fourth in a series
Folding Cheat Sheet #4 - fourth in a series
 
How to submit a standout Adobe Champion Application
How to submit a standout Adobe Champion ApplicationHow to submit a standout Adobe Champion Application
How to submit a standout Adobe Champion Application
 
SpotFlow: Tracking Method Calls and States at Runtime
SpotFlow: Tracking Method Calls and States at RuntimeSpotFlow: Tracking Method Calls and States at Runtime
SpotFlow: Tracking Method Calls and States at Runtime
 
Automate your Kamailio Test Calls - Kamailio World 2024
Automate your Kamailio Test Calls - Kamailio World 2024Automate your Kamailio Test Calls - Kamailio World 2024
Automate your Kamailio Test Calls - Kamailio World 2024
 
EY_Graph Database Powered Sustainability
EY_Graph Database Powered SustainabilityEY_Graph Database Powered Sustainability
EY_Graph Database Powered Sustainability
 
Hot Sexy call girls in Patel Nagar🔝 9953056974 🔝 escort Service
Hot Sexy call girls in Patel Nagar🔝 9953056974 🔝 escort ServiceHot Sexy call girls in Patel Nagar🔝 9953056974 🔝 escort Service
Hot Sexy call girls in Patel Nagar🔝 9953056974 🔝 escort Service
 
Catch the Wave: SAP Event-Driven and Data Streaming for the Intelligence Ente...
Catch the Wave: SAP Event-Driven and Data Streaming for the Intelligence Ente...Catch the Wave: SAP Event-Driven and Data Streaming for the Intelligence Ente...
Catch the Wave: SAP Event-Driven and Data Streaming for the Intelligence Ente...
 
Maximizing Efficiency and Profitability with OnePlan’s Professional Service A...
Maximizing Efficiency and Profitability with OnePlan’s Professional Service A...Maximizing Efficiency and Profitability with OnePlan’s Professional Service A...
Maximizing Efficiency and Profitability with OnePlan’s Professional Service A...
 
英国UN学位证,北安普顿大学毕业证书1:1制作
英国UN学位证,北安普顿大学毕业证书1:1制作英国UN学位证,北安普顿大学毕业证书1:1制作
英国UN学位证,北安普顿大学毕业证书1:1制作
 
GOING AOT WITH GRAALVM – DEVOXX GREECE.pdf
GOING AOT WITH GRAALVM – DEVOXX GREECE.pdfGOING AOT WITH GRAALVM – DEVOXX GREECE.pdf
GOING AOT WITH GRAALVM – DEVOXX GREECE.pdf
 
What are the key points to focus on before starting to learn ETL Development....
What are the key points to focus on before starting to learn ETL Development....What are the key points to focus on before starting to learn ETL Development....
What are the key points to focus on before starting to learn ETL Development....
 
PREDICTING RIVER WATER QUALITY ppt presentation
PREDICTING  RIVER  WATER QUALITY  ppt presentationPREDICTING  RIVER  WATER QUALITY  ppt presentation
PREDICTING RIVER WATER QUALITY ppt presentation
 
Buds n Tech IT Solutions: Top-Notch Web Services in Noida
Buds n Tech IT Solutions: Top-Notch Web Services in NoidaBuds n Tech IT Solutions: Top-Notch Web Services in Noida
Buds n Tech IT Solutions: Top-Notch Web Services in Noida
 
Implementing Zero Trust strategy with Azure
Implementing Zero Trust strategy with AzureImplementing Zero Trust strategy with Azure
Implementing Zero Trust strategy with Azure
 

The data.table Package: A Faster Way to Work with Dataframes in R

  • 2. The data.table package author: Pete Dodd date: 4 November, 2014
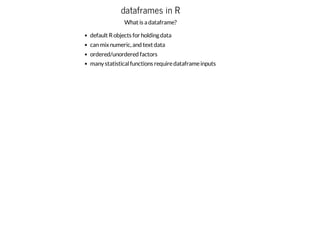
  • 3. dataframes in R What is a dataframe? default R objects for holding data can mix numeric, and text data ordered/unordered factors many statistical functions require dataframe inputs
  • 4. dataframes in R Problems: print! slow searching verbose syntax no built-in methods for aggregation Which is most annoying depends on who you are. . .
  • 5. Constructing data.tables myDT <- data.table( number=1:3, letter=c('a','b','c') ) # like data.frame constructor myDT2 <- as.data.frame(myDF) #conversion The data.table class inherits dataframe, so data.tables (mostly) can be used exactly like dataframes, and should not break existing code.
  • 6. Examples WHO TB data: D <- read.csv('TB_burden_countries_2014-09-10.csv') names(D)[1:10] ## [1] "country" "iso2" "iso3" ## [5] "g_whoregion" "year" "e_pop_num" ## [9] "e_prev_100k_lo" "e_prev_100k_hi"
  • 7. Examples WHO TB data: head(D[,c(1,6,8)]) ## country year e_prev_100k ## 1 Afghanistan 1990 327 ## 2 Afghanistan 1991 359 ## 3 Afghanistan 1992 387 ## 4 Afghanistan 1993 412 ## 5 Afghanistan 1994 431 ## 6 Afghanistan 1995 447
  • 8. Examples Mean TB in Afghanistan mean(D[D$country=='Afghanistan','e_prev_100k']) ## [1] 397.6087 As data.table: library(data.table) E <- as.data.table(D) #convert E[country=='Afghanistan',mean(e_prev_100k)] ## [1] 397.6087
  • 9. Examples dataframe multi-column access: D[D$country=='Afghanistan', c('e_prev_100k','e_prev_100k_lo', 'e_prev_100k_hi')] data.table multi-column means, renamed: E[country=='Afghanistan', list(mid=mean(e_prev_100k), lo=mean(e_prev_100k_lo), hi=mean(e_prev_100k_hi))] ## mid lo hi ## 1: 397.6087 187.913 684.7391
  • 10. Examples Means for each country? data.table solution: E[,list(mid=mean(e_prev_100k)),by=country] ## country mid ## 1: Afghanistan 397.60870 ## 2: Albania 29.52174 ## 3: Algeria 133.95652 ## 4: American Samoa 15.09130 ## 5: Andorra 30.71304 ## --- ## 215: Wallis and Futuna Islands 117.86957 ## 216: West Bank and Gaza Strip 11.14783 ## 217: Yemen 180.30435 ## 218: Zambia 501.39130 ## 219: Zimbabwe 386.30435
  • 11. Examples A more complicated example: E[, list(lo=mean(e_prev_100k_lo), hi=mean(e_prev_100k_hi)), by=list(country, century=factor(year<2000) )]
  • 12. Examples Output: ## country century lo hi ## 1: Afghanistan TRUE 189.20000 749.80000 ## 2: Afghanistan FALSE 186.92308 634.69231 ## 3: Albania TRUE 13.20000 65.40000 ## 4: Albania FALSE 10.59231 47.53846 ## 5: Algeria TRUE 49.40000 212.80000 ## --- ## 427: Yemen FALSE 62.69231 218.38462 ## 428: Zambia TRUE 291.60000 1024.90000 ## 429: Zambia FALSE 197.00000 733.76923 ## 430: Zimbabwe TRUE 14.81000 1074.60000 ## 431: Zimbabwe FALSE 56.07692 1219.61538
  • 13. Examples eo <- E[,plot(sort(e_prev_100k))] 0 1000 2000 3000 4000 5000 050010001500 Index sort(e_prev_100k) (1- line combination with aggregations
  • 14. Fast insertion A new column can be inserted by: E[,country_t := paste0(country,year)] head(E[,country_t]) ## [1] "Afghanistan1990" "Afghanistan1991" "Afghanistan1992 ## [5] "Afghanistan1994" "Afghanistan1995"
  • 15. Keys: fast row retrieval Need to pre-compute (setkey line) setkey(E,country) #must be sorted E['Afghanistan',e_inc_100k] ## country e_inc_100k ## 1: Afghanistan 189 ## 2: Afghanistan 189 ## 3: Afghanistan 189 ## 4: Afghanistan 189 ## 5: Afghanistan 189 ## 6: Afghanistan 189 ## 7: Afghanistan 189 ## 8: Afghanistan 189 ## 9: Afghanistan 189 ## 10: Afghanistan 189 ## 11: Afghanistan 189 ## 12: Afghanistan 189
  • 16. Gotchas: column access E[,1] ## [1] 1 E[,1,with=FALSE] ## country ## 1: Afghanistan ## 2: Afghanistan ## 3: Afghanistan ## 4: Afghanistan ## 5: Afghanistan ## --- ## 4899: Zimbabwe ## 4900: Zimbabwe ## 4901: Zimbabwe ## 4902: Zimbabwe ## 4903: Zimbabwe
  • 17. Gotchas: copying E2 <- E E[,foo:='bar'] head(E2[,foo]) ## [1] "bar" "bar" "bar" "bar" "bar" "bar"
  • 18. Gotchas: copying This is because copying is by reference. Use: E2 <- copy(E) instead.
  • 19. Summary more compact faster (sometimes lots) less memory great for aggregation/exploratory data crunching But: - a few traps for the unwary Good package vignettes & FAQ,
  • 20. Related aggregate in base R plyr: use of ddply sqldf: good if you know SQL RSQLlite: ditto other: - RODBC etc: talk to databases - dplyr: nascent, by Hadley, internal & external