SlideShare a Scribd company logo
1 of 11
Download to read offline
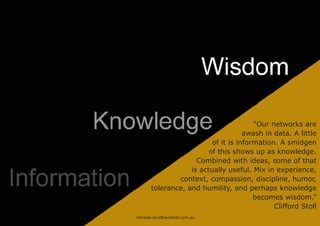
“Our networks are
                                     awash in data. A little
                          of it is information. A smidgen
                         of this shows up as knowledge.
                     Combined with ideas, some of that
                   is actually useful. Mix in experience,
               context, compassion, discipline, humor,
       tolerance, and humility, and perhaps knowledge
                                        becomes wisdom.”
                                              Clifford Stoll
shiralee.saul@westnet.com.au
When Al Gore rode a scissor crane up to the top of the CO2 emissions
graph in the film An Inconvenient Truth, he became a superstar of visual
communications. He compellingly used graphs to tell the story of global
warming, which helped public opinion in America to finally reach the tipping
point.
                           shiralee.saul@westnet.com.au
data vizualisation
The goal of visualization is to aid our understanding
of data by leveraging the human visual system’s
highly-tuned ability to see patterns, spot trends, and
identify outliers.


Well-designed visual representations can replace
cognitive calculations with simple perceptual
inferences and improve comprehension, memory,
and decision making.


By making data more accessible and appealing,
visual representations may also help engage more
diverse audiences in exploration and analysis.


The challenge is to create effective and engaging
visualizations that are appropriate to the data.

                             shiralee.saul@westnet.com.au
Modern data graphics can do much
           more than simply substitute for small
           statistical tables. At their best, graphics
           are instruments for reasoning about
           quantitative information. Often the most
           effective way to describe, explore, and
           summarize a set of numbers -- even a very
           large set -- is to look at pictures of those
           numbers. Furthermore, of all methods for
           analyzing and communicating statistical
           information, well-designed data graphics
           are usually the simplest and at the same
           time the most powerful.
           The Visual Display of Quantitative
           Information, Edward R. Tufte, Graphics
           Press: Cheshire, CT 1983, Introduction


shiralee.saul@westnet.com.au
Edward Tufte:
The Visual Display of
Quantitative Information
Graphical Displays Should :
    • show the data.
    • tell the truth.
    • help the viewer think about
      the information rather than
      the design.
    • encourage the eye to
      compare the data.
    • make large data sets
      coherent.


http://www.edwardtufte.com/tufte/
                               shiralee.saul@westnet.com.au
shiralee.saul@westnet.com.au
Why should we be interested in visualization? Because
the human visual system is a pattern seeker of enormous
power and subtlety. The eye and the visual cortex of the
brain form a massively parallel processor that provides the
highest-bandwidth channel into human cognitive centers.
At higher levels of processing, perception and cognition
are closely interelated, which is the reason why the words
‘understanding’ and ‘seeing’ are synonymous.

However, the visual system has its own rules. We can easily
see patterns presented in certain ways, but if they are
presented in other ways, they become invisible... If we can
understand how perception works, our knowledge can be
translated into rules for displaying information. Following
perception-based rules, we can present our data in such a
way that the important and informative patterns stand out.
If we disobey the rules, our data will be incomprehensible or
misleading.

Information Visualization, Second Edition, Colin Ware, Morgan
Kaufmann Publishers, 2004, page xxi

                       shiralee.saul@westnet.com.au
Good data visualisations bring pattern,
trends and exceptions to light.


                 shiralee.saul@westnet.com.au
shiralee.saul@westnet.com.au
Graph Design IQ Test
http://www.perceptualedge.com/files/GraphDesignIQ.html


               shiralee.saul@westnet.com.au

More Related Content

Viewers also liked

Language is a Virus: technologies of Speech
Language is a Virus: technologies of SpeechLanguage is a Virus: technologies of Speech
Language is a Virus: technologies of SpeechShiralee Saul
 
WTF is a media culture...and why should I give a rats?
WTF is a media culture...and why should I give a rats?WTF is a media culture...and why should I give a rats?
WTF is a media culture...and why should I give a rats?Shiralee Saul
 
Tufte visual display-1
Tufte visual display-1Tufte visual display-1
Tufte visual display-1jgomez27
 
Narrative theory and games
Narrative theory and gamesNarrative theory and games
Narrative theory and gamesShiralee Saul
 
The Body Speaks: nonverbal communication & semiotics
The Body Speaks: nonverbal  communication & semioticsThe Body Speaks: nonverbal  communication & semiotics
The Body Speaks: nonverbal communication & semioticsShiralee Saul
 
Old Media + New Media = reMedia
Old Media + New Media = reMediaOld Media + New Media = reMedia
Old Media + New Media = reMediaShiralee Saul
 
The Importance of Data Visualization
The Importance of Data VisualizationThe Importance of Data Visualization
The Importance of Data VisualizationCenterline Digital
 

Viewers also liked (8)

Language is a Virus: technologies of Speech
Language is a Virus: technologies of SpeechLanguage is a Virus: technologies of Speech
Language is a Virus: technologies of Speech
 
The Protean Machine
The Protean MachineThe Protean Machine
The Protean Machine
 
WTF is a media culture...and why should I give a rats?
WTF is a media culture...and why should I give a rats?WTF is a media culture...and why should I give a rats?
WTF is a media culture...and why should I give a rats?
 
Tufte visual display-1
Tufte visual display-1Tufte visual display-1
Tufte visual display-1
 
Narrative theory and games
Narrative theory and gamesNarrative theory and games
Narrative theory and games
 
The Body Speaks: nonverbal communication & semiotics
The Body Speaks: nonverbal  communication & semioticsThe Body Speaks: nonverbal  communication & semiotics
The Body Speaks: nonverbal communication & semiotics
 
Old Media + New Media = reMedia
Old Media + New Media = reMediaOld Media + New Media = reMedia
Old Media + New Media = reMedia
 
The Importance of Data Visualization
The Importance of Data VisualizationThe Importance of Data Visualization
The Importance of Data Visualization
 

Similar to Introduction to Data Visualisation

TED Wiley Visualizing .docx
TED  Wiley Visualizing .docxTED  Wiley Visualizing .docx
TED Wiley Visualizing .docxssuserf9c51d
 
The Field Guide to Data Science
The Field Guide to Data ScienceThe Field Guide to Data Science
The Field Guide to Data ScienceEMC
 
Intent & Impact: Thoughts on Persuasion in Visualization
Intent & Impact: Thoughts on Persuasion in VisualizationIntent & Impact: Thoughts on Persuasion in Visualization
Intent & Impact: Thoughts on Persuasion in VisualizationBenjamin Wiederkehr
 
Identifying Your Audience
Identifying Your AudienceIdentifying Your Audience
Identifying Your AudienceAmanda Makulec
 
Data fluency for the 21st century
Data fluency for the 21st centuryData fluency for the 21st century
Data fluency for the 21st centuryMartinFrigaard
 
10 Reasons Why We Visualise Data
10 Reasons Why We Visualise Data10 Reasons Why We Visualise Data
10 Reasons Why We Visualise DataPulsar Platform
 
Infographics overview e&e 20120608_final
Infographics overview e&e 20120608_finalInfographics overview e&e 20120608_final
Infographics overview e&e 20120608_finalJason Jercinovic
 
3 razones para contar historias...
3 razones para contar historias...3 razones para contar historias...
3 razones para contar historias...Data IQ Argentina
 
The Role of Data Visualization in Storytelling with Data.pdf
The Role of Data Visualization in Storytelling with Data.pdfThe Role of Data Visualization in Storytelling with Data.pdf
The Role of Data Visualization in Storytelling with Data.pdfSoumodeep Nanee Kundu
 
Introduction to Information Visualization (Part 2)
Introduction to Information Visualization (Part 2)Introduction to Information Visualization (Part 2)
Introduction to Information Visualization (Part 2)Andrew Vande Moere
 
Infographics And The Brain
Infographics And The BrainInfographics And The Brain
Infographics And The Braingonzoin
 
Data visualization introduction
Data visualization introductionData visualization introduction
Data visualization introductionManokamnaKochar1
 
wepik-insightful-perspectives-a-data-visualization-overview-20240401133024gp4...
wepik-insightful-perspectives-a-data-visualization-overview-20240401133024gp4...wepik-insightful-perspectives-a-data-visualization-overview-20240401133024gp4...
wepik-insightful-perspectives-a-data-visualization-overview-20240401133024gp4...KarteekMane1
 
A Business Guide to Visual Communication
A Business Guide to Visual CommunicationA Business Guide to Visual Communication
A Business Guide to Visual CommunicationVisage
 

Similar to Introduction to Data Visualisation (20)

2009 06 few
2009 06 few2009 06 few
2009 06 few
 
TED Wiley Visualizing .docx
TED  Wiley Visualizing .docxTED  Wiley Visualizing .docx
TED Wiley Visualizing .docx
 
Info Viz by Liz
Info Viz by LizInfo Viz by Liz
Info Viz by Liz
 
The Field Guide to Data Science
The Field Guide to Data ScienceThe Field Guide to Data Science
The Field Guide to Data Science
 
The field-guide-to-data-science
The field-guide-to-data-scienceThe field-guide-to-data-science
The field-guide-to-data-science
 
The Field Guide to Data Science
The Field Guide to Data ScienceThe Field Guide to Data Science
The Field Guide to Data Science
 
Intent & Impact: Thoughts on Persuasion in Visualization
Intent & Impact: Thoughts on Persuasion in VisualizationIntent & Impact: Thoughts on Persuasion in Visualization
Intent & Impact: Thoughts on Persuasion in Visualization
 
Identifying Your Audience
Identifying Your AudienceIdentifying Your Audience
Identifying Your Audience
 
Data fluency for the 21st century
Data fluency for the 21st centuryData fluency for the 21st century
Data fluency for the 21st century
 
10 Reasons Why We Visualise Data
10 Reasons Why We Visualise Data10 Reasons Why We Visualise Data
10 Reasons Why We Visualise Data
 
Infographics overview e&e 20120608_final
Infographics overview e&e 20120608_finalInfographics overview e&e 20120608_final
Infographics overview e&e 20120608_final
 
3 razones para contar historias...
3 razones para contar historias...3 razones para contar historias...
3 razones para contar historias...
 
The Role of Data Visualization in Storytelling with Data.pdf
The Role of Data Visualization in Storytelling with Data.pdfThe Role of Data Visualization in Storytelling with Data.pdf
The Role of Data Visualization in Storytelling with Data.pdf
 
Introduction to Information Visualization (Part 2)
Introduction to Information Visualization (Part 2)Introduction to Information Visualization (Part 2)
Introduction to Information Visualization (Part 2)
 
Infographics And The Brain
Infographics And The BrainInfographics And The Brain
Infographics And The Brain
 
Data visualization
Data visualizationData visualization
Data visualization
 
Data visualization introduction
Data visualization introductionData visualization introduction
Data visualization introduction
 
wepik-insightful-perspectives-a-data-visualization-overview-20240401133024gp4...
wepik-insightful-perspectives-a-data-visualization-overview-20240401133024gp4...wepik-insightful-perspectives-a-data-visualization-overview-20240401133024gp4...
wepik-insightful-perspectives-a-data-visualization-overview-20240401133024gp4...
 
wepik-insightful-perspectives-a-data-visualization-overview-20240401133024gp4...
wepik-insightful-perspectives-a-data-visualization-overview-20240401133024gp4...wepik-insightful-perspectives-a-data-visualization-overview-20240401133024gp4...
wepik-insightful-perspectives-a-data-visualization-overview-20240401133024gp4...
 
A Business Guide to Visual Communication
A Business Guide to Visual CommunicationA Business Guide to Visual Communication
A Business Guide to Visual Communication
 

Recently uploaded

Karim apartment ideas 02 ppppppppppppppp
Karim apartment ideas 02 pppppppppppppppKarim apartment ideas 02 ppppppppppppppp
Karim apartment ideas 02 pppppppppppppppNadaMohammed714321
 
DAKSHIN BIHAR GRAMIN BANK: REDEFINING THE DIGITAL BANKING EXPERIENCE WITH A U...
DAKSHIN BIHAR GRAMIN BANK: REDEFINING THE DIGITAL BANKING EXPERIENCE WITH A U...DAKSHIN BIHAR GRAMIN BANK: REDEFINING THE DIGITAL BANKING EXPERIENCE WITH A U...
DAKSHIN BIHAR GRAMIN BANK: REDEFINING THE DIGITAL BANKING EXPERIENCE WITH A U...Rishabh Aryan
 
guest bathroom white and bluesssssssssss
guest bathroom white and bluesssssssssssguest bathroom white and bluesssssssssss
guest bathroom white and bluesssssssssssNadaMohammed714321
 
怎么办理英国Newcastle毕业证纽卡斯尔大学学位证书一手渠道
怎么办理英国Newcastle毕业证纽卡斯尔大学学位证书一手渠道怎么办理英国Newcastle毕业证纽卡斯尔大学学位证书一手渠道
怎么办理英国Newcastle毕业证纽卡斯尔大学学位证书一手渠道yrolcks
 
Unit1_Syllbwbnwnwneneneneneneentation_Sem2.pptx
Unit1_Syllbwbnwnwneneneneneneentation_Sem2.pptxUnit1_Syllbwbnwnwneneneneneneentation_Sem2.pptx
Unit1_Syllbwbnwnwneneneneneneentation_Sem2.pptxNitish292041
 
Piece by Piece Magazine
Piece by Piece Magazine                      Piece by Piece Magazine
Piece by Piece Magazine CharlottePulte
 
The spirit of digital place - game worlds and architectural phenomenology
The spirit of digital place - game worlds and architectural phenomenologyThe spirit of digital place - game worlds and architectural phenomenology
The spirit of digital place - game worlds and architectural phenomenologyChristopher Totten
 
General Simple Guide About AI in Design By: A.L. Samar Hossam ElDin
General Simple Guide About AI in Design By: A.L. Samar Hossam ElDinGeneral Simple Guide About AI in Design By: A.L. Samar Hossam ElDin
General Simple Guide About AI in Design By: A.L. Samar Hossam ElDinSamar Hossam ElDin Ahmed
 
10 Best WordPress Plugins to make the website effective in 2024
10 Best WordPress Plugins to make the website effective in 202410 Best WordPress Plugins to make the website effective in 2024
10 Best WordPress Plugins to make the website effective in 2024digital learning point
 
10 must-have Chrome extensions for designers
10 must-have Chrome extensions for designers10 must-have Chrome extensions for designers
10 must-have Chrome extensions for designersPixeldarts
 
world health day 2024.pptxgbbvggvbhjjjbbbb
world health day 2024.pptxgbbvggvbhjjjbbbbworld health day 2024.pptxgbbvggvbhjjjbbbb
world health day 2024.pptxgbbvggvbhjjjbbbbpreetirao780
 
FW25-26 Knit Cut & Sew Trend Book Peclers Paris
FW25-26 Knit Cut & Sew Trend Book Peclers ParisFW25-26 Knit Cut & Sew Trend Book Peclers Paris
FW25-26 Knit Cut & Sew Trend Book Peclers ParisPeclers Paris
 
Sharif's 9-BOX Monitoring Model for Adaptive Programme Management
Sharif's 9-BOX Monitoring Model for Adaptive Programme ManagementSharif's 9-BOX Monitoring Model for Adaptive Programme Management
Sharif's 9-BOX Monitoring Model for Adaptive Programme ManagementMd. Shariful Hoque
 
guest bathroom white and blue ssssssssss
guest bathroom white and blue ssssssssssguest bathroom white and blue ssssssssss
guest bathroom white and blue ssssssssssNadaMohammed714321
 
simpson-lee_house_dt20ajshsjsjsjsjj15.pdf
simpson-lee_house_dt20ajshsjsjsjsjj15.pdfsimpson-lee_house_dt20ajshsjsjsjsjj15.pdf
simpson-lee_house_dt20ajshsjsjsjsjj15.pdfLucyBonelli
 
Making and Unmaking of Chandigarh - A City of Two Plans2-4-24.ppt
Making and Unmaking of Chandigarh - A City of Two Plans2-4-24.pptMaking and Unmaking of Chandigarh - A City of Two Plans2-4-24.ppt
Making and Unmaking of Chandigarh - A City of Two Plans2-4-24.pptJIT KUMAR GUPTA
 
Map of St. Louis Parks
Map of St. Louis Parks                              Map of St. Louis Parks
Map of St. Louis Parks CharlottePulte
 
CAPITAL GATE CASE STUDY -regional case study.pdf
CAPITAL GATE CASE STUDY -regional case study.pdfCAPITAL GATE CASE STUDY -regional case study.pdf
CAPITAL GATE CASE STUDY -regional case study.pdfAlasAlthaher
 
Interior Design for Office a cura di RMG Project Studio
Interior Design for Office a cura di RMG Project StudioInterior Design for Office a cura di RMG Project Studio
Interior Design for Office a cura di RMG Project StudioRMG Project Studio
 
Top 10 Modern Web Design Trends for 2025
Top 10 Modern Web Design Trends for 2025Top 10 Modern Web Design Trends for 2025
Top 10 Modern Web Design Trends for 2025Rndexperts
 

Recently uploaded (20)

Karim apartment ideas 02 ppppppppppppppp
Karim apartment ideas 02 pppppppppppppppKarim apartment ideas 02 ppppppppppppppp
Karim apartment ideas 02 ppppppppppppppp
 
DAKSHIN BIHAR GRAMIN BANK: REDEFINING THE DIGITAL BANKING EXPERIENCE WITH A U...
DAKSHIN BIHAR GRAMIN BANK: REDEFINING THE DIGITAL BANKING EXPERIENCE WITH A U...DAKSHIN BIHAR GRAMIN BANK: REDEFINING THE DIGITAL BANKING EXPERIENCE WITH A U...
DAKSHIN BIHAR GRAMIN BANK: REDEFINING THE DIGITAL BANKING EXPERIENCE WITH A U...
 
guest bathroom white and bluesssssssssss
guest bathroom white and bluesssssssssssguest bathroom white and bluesssssssssss
guest bathroom white and bluesssssssssss
 
怎么办理英国Newcastle毕业证纽卡斯尔大学学位证书一手渠道
怎么办理英国Newcastle毕业证纽卡斯尔大学学位证书一手渠道怎么办理英国Newcastle毕业证纽卡斯尔大学学位证书一手渠道
怎么办理英国Newcastle毕业证纽卡斯尔大学学位证书一手渠道
 
Unit1_Syllbwbnwnwneneneneneneentation_Sem2.pptx
Unit1_Syllbwbnwnwneneneneneneentation_Sem2.pptxUnit1_Syllbwbnwnwneneneneneneentation_Sem2.pptx
Unit1_Syllbwbnwnwneneneneneneentation_Sem2.pptx
 
Piece by Piece Magazine
Piece by Piece Magazine                      Piece by Piece Magazine
Piece by Piece Magazine
 
The spirit of digital place - game worlds and architectural phenomenology
The spirit of digital place - game worlds and architectural phenomenologyThe spirit of digital place - game worlds and architectural phenomenology
The spirit of digital place - game worlds and architectural phenomenology
 
General Simple Guide About AI in Design By: A.L. Samar Hossam ElDin
General Simple Guide About AI in Design By: A.L. Samar Hossam ElDinGeneral Simple Guide About AI in Design By: A.L. Samar Hossam ElDin
General Simple Guide About AI in Design By: A.L. Samar Hossam ElDin
 
10 Best WordPress Plugins to make the website effective in 2024
10 Best WordPress Plugins to make the website effective in 202410 Best WordPress Plugins to make the website effective in 2024
10 Best WordPress Plugins to make the website effective in 2024
 
10 must-have Chrome extensions for designers
10 must-have Chrome extensions for designers10 must-have Chrome extensions for designers
10 must-have Chrome extensions for designers
 
world health day 2024.pptxgbbvggvbhjjjbbbb
world health day 2024.pptxgbbvggvbhjjjbbbbworld health day 2024.pptxgbbvggvbhjjjbbbb
world health day 2024.pptxgbbvggvbhjjjbbbb
 
FW25-26 Knit Cut & Sew Trend Book Peclers Paris
FW25-26 Knit Cut & Sew Trend Book Peclers ParisFW25-26 Knit Cut & Sew Trend Book Peclers Paris
FW25-26 Knit Cut & Sew Trend Book Peclers Paris
 
Sharif's 9-BOX Monitoring Model for Adaptive Programme Management
Sharif's 9-BOX Monitoring Model for Adaptive Programme ManagementSharif's 9-BOX Monitoring Model for Adaptive Programme Management
Sharif's 9-BOX Monitoring Model for Adaptive Programme Management
 
guest bathroom white and blue ssssssssss
guest bathroom white and blue ssssssssssguest bathroom white and blue ssssssssss
guest bathroom white and blue ssssssssss
 
simpson-lee_house_dt20ajshsjsjsjsjj15.pdf
simpson-lee_house_dt20ajshsjsjsjsjj15.pdfsimpson-lee_house_dt20ajshsjsjsjsjj15.pdf
simpson-lee_house_dt20ajshsjsjsjsjj15.pdf
 
Making and Unmaking of Chandigarh - A City of Two Plans2-4-24.ppt
Making and Unmaking of Chandigarh - A City of Two Plans2-4-24.pptMaking and Unmaking of Chandigarh - A City of Two Plans2-4-24.ppt
Making and Unmaking of Chandigarh - A City of Two Plans2-4-24.ppt
 
Map of St. Louis Parks
Map of St. Louis Parks                              Map of St. Louis Parks
Map of St. Louis Parks
 
CAPITAL GATE CASE STUDY -regional case study.pdf
CAPITAL GATE CASE STUDY -regional case study.pdfCAPITAL GATE CASE STUDY -regional case study.pdf
CAPITAL GATE CASE STUDY -regional case study.pdf
 
Interior Design for Office a cura di RMG Project Studio
Interior Design for Office a cura di RMG Project StudioInterior Design for Office a cura di RMG Project Studio
Interior Design for Office a cura di RMG Project Studio
 
Top 10 Modern Web Design Trends for 2025
Top 10 Modern Web Design Trends for 2025Top 10 Modern Web Design Trends for 2025
Top 10 Modern Web Design Trends for 2025
 

Introduction to Data Visualisation

  • 1. “Our networks are awash in data. A little of it is information. A smidgen of this shows up as knowledge. Combined with ideas, some of that is actually useful. Mix in experience, context, compassion, discipline, humor, tolerance, and humility, and perhaps knowledge becomes wisdom.” Clifford Stoll shiralee.saul@westnet.com.au
  • 2. When Al Gore rode a scissor crane up to the top of the CO2 emissions graph in the film An Inconvenient Truth, he became a superstar of visual communications. He compellingly used graphs to tell the story of global warming, which helped public opinion in America to finally reach the tipping point. shiralee.saul@westnet.com.au
  • 3. data vizualisation The goal of visualization is to aid our understanding of data by leveraging the human visual system’s highly-tuned ability to see patterns, spot trends, and identify outliers. Well-designed visual representations can replace cognitive calculations with simple perceptual inferences and improve comprehension, memory, and decision making. By making data more accessible and appealing, visual representations may also help engage more diverse audiences in exploration and analysis. The challenge is to create effective and engaging visualizations that are appropriate to the data. shiralee.saul@westnet.com.au
  • 4. Modern data graphics can do much more than simply substitute for small statistical tables. At their best, graphics are instruments for reasoning about quantitative information. Often the most effective way to describe, explore, and summarize a set of numbers -- even a very large set -- is to look at pictures of those numbers. Furthermore, of all methods for analyzing and communicating statistical information, well-designed data graphics are usually the simplest and at the same time the most powerful. The Visual Display of Quantitative Information, Edward R. Tufte, Graphics Press: Cheshire, CT 1983, Introduction shiralee.saul@westnet.com.au
  • 5. Edward Tufte: The Visual Display of Quantitative Information Graphical Displays Should : • show the data. • tell the truth. • help the viewer think about the information rather than the design. • encourage the eye to compare the data. • make large data sets coherent. http://www.edwardtufte.com/tufte/ shiralee.saul@westnet.com.au
  • 7. Why should we be interested in visualization? Because the human visual system is a pattern seeker of enormous power and subtlety. The eye and the visual cortex of the brain form a massively parallel processor that provides the highest-bandwidth channel into human cognitive centers. At higher levels of processing, perception and cognition are closely interelated, which is the reason why the words ‘understanding’ and ‘seeing’ are synonymous. However, the visual system has its own rules. We can easily see patterns presented in certain ways, but if they are presented in other ways, they become invisible... If we can understand how perception works, our knowledge can be translated into rules for displaying information. Following perception-based rules, we can present our data in such a way that the important and informative patterns stand out. If we disobey the rules, our data will be incomprehensible or misleading. Information Visualization, Second Edition, Colin Ware, Morgan Kaufmann Publishers, 2004, page xxi shiralee.saul@westnet.com.au
  • 8. Good data visualisations bring pattern, trends and exceptions to light. shiralee.saul@westnet.com.au
  • 11. Graph Design IQ Test http://www.perceptualedge.com/files/GraphDesignIQ.html shiralee.saul@westnet.com.au