SlideShare a Scribd company logo
1 of 83
Download to read offline
Roadway Design Manual 2-7 TxDOT 10/2013
Chapter 2 — Basic Design Criteria Section 3 — Sight Distance
terrain. AASHTO’s A Policy on Geometric Design for Highways and Streets, provides additional
information and suggested values for grade corrections in these rare circumstances.
NOTE: Online users can view the metric version of this table in PDF format.
Decision Sight Distance
Decision sight distance is the distance required for a driver to detect an unexpected or otherwise
difficult-to-perceive information source, recognize the source, select an appropriate speed and path,
and initiate and complete the required maneuver safely and efficiently. Because decision sight dis-
tance gives drivers additional margin for error and affords them sufficient length to maneuver their
vehicles at the same or reduced speed rather than to just stop, its values are substantially greater
than stopping sight distance. Table 2-2 shows recommended decision sight distance values for var-
ious avoidance maneuvers.
Table 2-1: Stopping Sight Distance
Stopping sight distance
DesignSpeed
(mph)
Brake reaction
distance
(ft)
Braking distance
on level
(ft)
Calculated
(ft)
Design
(ft)
15 55.1 21.6 76.7 80
20 73.5 38.4 111.9 115
25 91.9 60.0 151.9 155
30 110.3 86.4 196.7 200
35 128.6 117.6 246.2 250
40 147.0 153.6 300.6 305
45 165.4 194.4 359.8 360
50 183.8 240.0 423.8 425
55 202.1 290.3 492.4 495
60 220.5 345.5 566.0 570
65 238.9 405.5 644.4 645
70 257.3 470.3 727.6 730
75 275.6 539.9 815.5 820
80 294.0 614.3 908.3 910
Note: brake reaction distance predicated on a time of 2.5s; deceleration rate 11.2 ft/sec²
Roadway Design Manual 2-8 TxDOT 10/2013
Chapter 2 — Basic Design Criteria Section 3 — Sight Distance
NOTE: Online users can view the metric version of this table in PDF format.
Examples of situations in which decision sight distance is preferred include the following:
 Interchange and intersection locations where unusual or unexpected maneuvers are required
(such as exit ramp gore areas and left-hand exits)
 Changes in cross section such as toll plazas and lane drops
 Areas of concentrated demand where there is apt to be “visual noise” whenever sources of
information compete, as those from roadway elements, traffic, traffic control devices, and
advertising signs
Locations along the roadway where a driver has stopping sight distance but not the extra response
time provided by decision sight distance is identified as a reduce decision zone. During the design
process, the roadway engineer can avoid the location of intersections within a reduced decision
zone either by relocating the intersection or by changing the grades to reduce the size of the
reduced design zone.
Table 2-2: Recommended Decision Sight Distance Values
Decision sight distance (ft) Avoidance maneuver
Design speed
(mph)
A B C D E
30 220 490 450 535 620
35 275 590 525 625 720
40 330 690 600 715 825
45 395 800 675 800 930
50 465 910 750 890 1030
55 535 1030 865 980 1135
60 610 1150 990 1125 1280
65 695 1275 1050 1220 1365
70 780 1410 1105 1275 1445
75 875 1545 1180 1365 1545
80 970 1685 1260 1455 1650
Avoidance Maneuver A: Stop on rural road – t = 3.0s
Avoidance Maneuver B: Stop on urban road – t = 9.1s
Avoidance Maneuver C: Speed/path/direction change on rural road – t varies between 10.2 and 11.2s
Avoidance Maneuver D: Speed/path/direction change on suburban road – t varies between 12.1 and 12.9s
Avoidance Maneuver E: Speed/path/direction change on urban road – t varies between 14.0 and 14.5s
Roadway Design Manual 2-11 TxDOT 10/2013
Chapter 2 — Basic Design Criteria Section 4 — Horizontal Alignment
Curve Radius
The minimum radii of curves are important control values in designing for safe operation. Design
guidance for curvature is shown in Table 2-3 and “Table 2-4: Horizontal Curvature of Highways
without Superelevation1.”
NOTE: Online users can view the metric version of this table in PDF format.
Table 2-3: Horizontal Curvature of High-Speed Highways and Connecting Roadways with Superelevation
Design Speed (mph) Usual Min.1,2 Radius of Curve (ft) Absolute Min.1,3 Radius of Curve (ft)
[based on emax = 6%]
45 810 643
50 1050 833
55 1635 1060
60 2195 1330
65 2740 1660
70 3390 2040
75 3750 2500
80 4575 3050
[based on emax = 8%]
45 740 587
50 955 758
55 1480 960
60 1980 1200
65 2445 1480
70 3005 1810
75 3315 2210
80 4005 2670
1
For other maximum superelevation rates refer to AASHTO’s A Policy on Geometric Design of Highways and
Streets.
2 Applies to new location construction. For 3R or reconstruction, existing curvature equal to or flatter than
absolute minimum values may be retained unless accident history indicates flattening curvature.
3
Absolute minimum values should be used only where unusual design circumstances dictate.
Roadway Design Manual 2-12 TxDOT 10/2013
Chapter 2 — Basic Design Criteria Section 4 — Horizontal Alignment
NOTE: Online users can view the metric version of this table in PDF format.
For high speed design conditions, the maximum deflection angle allowable without a horizontal
curve is fifteen (15) minutes. For low speed design conditions, the maximum deflection angle
allowable without a horizontal curve is thirty (30) minutes.
Superelevation Rate
As a vehicle traverses a horizontal curve, centrifugal force is counter-balanced by the vehicle
weight component due to roadway superelevation and by the side friction between tires and surfac-
ing as shown in the following equation:
e + f = V2/15R (US Customary)
Where:
e = superelevation rate, in decimal format
f = side friction factor
V = vehicle speed, mph
R = curve radius, feet
NOTE: Online users can view the metric version of this equation in PDF format.
There are practical limits to the rate of superelevation. High rates create steering problems for driv-
ers traveling at lower speeds, particularly during ice or snow conditions. On urban facilities, lower
Table 2-4: Horizontal Curvature of Highways without Superelevation
Design Speed (mph)
6%
Min. Radius (ft)1
8%
Min. Radius (ft)1
15 868 932
20 1580 1640
25 2290 2370
30 3130 3240
35 4100 4260
40 5230 5410
45 6480 6710
50 7870 8150
55 9410 9720
60 11100 11500
65 12600 12900
70 14100 14500
75 15700 16100
80 17400 17800
1
Normal crown (2%) maintained
Roadway Design Manual 2-14 TxDOT 10/2013
Chapter 2 — Basic Design Criteria Section 4 — Horizontal Alignment
NOTE: Online users can view the metric version of this table in PDF format.
Superelevation Rate on High-Speed Facilities. Tables 2-6 and 2-7 show superelevation rates
(maximum 6 and 8 percent, respectively) for various design speeds and radii. These tables should
be used for high-speed facilities such as rural highways and urban freeways.
Table 2-5: Minimum Radii and Superelevation for Low-Speed Urban Streets
e(%)
V = 15 mph
R (ft)
V = 20 mph
R (ft)
V = 25 mph
R (ft)
V = 30 mph
R (ft)
V = 35 mph
R (ft)
V = 40 mph
R (ft)
V = 45 mph
R (ft)
-4.0 54 116 219 375 583 889 1227
-3.0 52 111 208 353 544 821 1125
-2.8 51 110 206 349 537 808 1107
-2.6 51 109 204 345 530 796 1089
-2.4 51 108 202 341 524 784 1071
-2.2 50 108 200 337 517 773 1055
-2.0 50 107 198 333 510 762 1039
-1.5 49 105 194 324 495 736 1000
0 47 99 181 300 454 667 900
1.5 45 94 170 279 419 610 818
2.0 44 92 167 273 408 593 794
2.2 44 91 165 270 404 586 785
2.4 44 91 164 268 400 580 776
2.6 43 90 163 265 396 573 767
2.8 43 89 161 263 393 567 758
3.0 43 89 160 261 389 561 750
3.2 43 88 159 259 385 556 742
3.4 42 88 158 256 382 550 734
3.6 42 87 157 254 378 544 726
3.8 42 87 155 252 375 539 718
4.0 42 86 154 250 371 533 711
Notes:
1. Computed using Superelevation Distribution Method 2.
2. Superelevation may be optional on low-speed urban streets.
3. Negative superelevation values beyond -2.0% should be used for low type surfaces such as gravel,
crushed stone, and earth. However, areas with intense rainfall may use normal cross slopes on high type
surfaces of -2.5%.
Roadway Design Manual 2-15 TxDOT 10/2013
Chapter 2 — Basic Design Criteria Section 4 — Horizontal Alignment
NOTE: Online users can view the metric version of this table in PDF format.
Table 2-6: Minimum Radii for Design Superelevation Rates, Design Speeds,
and emax = 6%
e
(%)
15 mph
R (ft)
20 mph
R (ft)
25 mph
R (ft)
30 mph
R(ft)
35mph
R (ft)
40 mph
R (ft)
45 mph
R (ft)
50 mph
R (ft)
55 mph
R (ft)
60 mph
R (ft)
65mph
R (ft)
70 mph
R (ft)
75 mph
R (ft)
80 mph
R (ft)
2.0 614 1120 1630 2240 2950 3770 4680 5700 6820 8060 9130 10300 11500 12900
2.2 543 991 1450 2000 2630 3370 4190 5100 6110 7230 8200 9240 10400 11600
2.4 482 884 1300 1790 2360 3030 3770 4600 5520 6540 7430 8380 9420 10600
2.6 430 791 1170 1610 2130 2740 3420 4170 5020 5950 6770 7660 8620 9670
2.8 384 709 1050 1460 1930 2490 3110 3800 4580 5440 6200 7030 7930 8910
3.0 341 635 944 1320 1760 2270 2840 3480 4200 4990 5710 6490 7330 8260
3.2 300 566 850 1200 1600 2080 2600 3200 3860 4600 5280 6010 6810 7680
3.4 256 498 761 1080 1460 1900 2390 2940 3560 4250 4890 5580 6340 7180
3.6 209 422 673 972 1320 1740 2190 2710 3290 3940 4540 5210 5930 6720
3.8 176 358 583 864 1190 1590 2010 2490 3040 3650 4230 4860 5560 6320
4.0 151 309 511 766 1070 1440 1840 2300 2810 3390 3950 4550 5220 5950
4.2 131 270 452 684 960 1310 1680 2110 2590 3140 3680 4270 4910 5620
4.4 116 238 402 615 868 1190 1540 1940 2400 2920 3440 4010 4630 5320
4.6 102 212 360 555 788 1090 1410 1780 2210 2710 3220 3770 4380 5040
4.8 91 189 324 502 718 995 1300 1640 2050 2510 3000 3550 4140 4790
5.0 82 169 292 456 654 911 1190 1510 1890 2330 2800 3330 3910 4550
5.2 73 152 264 413 595 833 1090 1390 1750 2160 2610 3120 3690 4320
5.4 65 136 237 373 540 759 995 1280 1610 1990 2420 2910 3460 4090
5.6 58 121 212 335 487 687 903 1160 1470 1830 2230 2700 3230 3840
5.8 51 106 186 296 431 611 806 1040 1320 1650 2020 2460 2970 3560
6.0 39 81 144 231 340 485 643 833 1060 1330 1660 2040 2500 3050
Roadway Design Manual 2-16 TxDOT 10/2013
Chapter 2 — Basic Design Criteria Section 4 — Horizontal Alignment
NOTE: Online users can view the metric version of this table in PDF format
Superelevation Transition Length
Superelevation transition is the general term denoting the change in cross slope from a normal
crown section to the full superelevated section or vice versa. To meet the requirements of comfort
and safety, the superelevation transition should be effected over a length adequate for the usual
travel speeds.
Table 2-7: Minimum Radii for Design Superelevation Rates, Design Speeds, and emax = 8%
e
(%)
Vd=
15mph
R(ft)
Vd=
20mph
R(ft)
Vd=
25mph
R(ft)
Vd=
30mph
R(ft)
Vd=
35mph
R(ft)
Vd=
40mph
R(ft)
Vd=
45mph
R(ft)
Vd=
50mph
R(ft)
Vd=
55mph
R(ft)
Vd=
60mph
R(ft)
Vd=
65mph
R(ft)
Vd=
70mph
R(ft)
Vd=
75mph
R(ft)
Vd=
80mph
R(ft)
2.0 676 1190 1720 2370 3120 3970 4930 5990 7150 8440 9510 10700 12000 13300
2.2 605 1070 1550 2130 2800 3570 4440 5400 6450 7620 8600 9660 10800 12000
2.4 546 959 1400 1930 2540 3240 4030 4910 5870 6930 7830 8810 9850 11000
2.6 496 872 1280 1760 2320 2960 3690 4490 5370 6350 7180 8090 9050 10100
2.8 453 796 1170 1610 2130 2720 3390 4130 4950 5850 6630 7470 8370 9340
3.0 415 730 1070 1480 1960 2510 3130 3820 4580 5420 6140 6930 7780 8700
3.2 382 672 985 1370 1820 2330 2900 3550 4250 5040 5720 6460 7260 8130
3.4 352 620 911 1270 1690 2170 2700 3300 3970 4700 5350 6050 6800 7620
3.6 324 572 845 1180 1570 2020 2520 3090 3710 4400 5010 5680 6400 7180
3.8 300 530 784 1100 1470 1890 2360 2890 3480 4140 4710 5350 6030 6780
4.0 277 490 729 1030 1370 1770 2220 2720 3270 3890 4450 5050 5710 6420
4.2 255 453 678 955 1280 1660 2080 2560 3080 3670 4200 4780 5410 6090
4.4 235 418 630 893 1200 1560 1960 2410 2910 3470 3980 4540 5140 5800
4.6 215 384 585 834 1130 1470 1850 2280 2750 3290 3770 4310 4890 5530
4.8 193 349 542 779 1060 1390 1750 2160 2610 3120 3590 4100 4670 5280
5.0 172 314 499 727 991 1310 1650 2040 2470 2960 3410 3910 4460 5050
5.2 154 284 457 676 929 1230 1560 1930 2350 2820 3250 3740 4260 4840
5.4 139 258 420 627 870 1160 1480 1830 2230 2680 3110 3570 4090 4640
5.6 126 236 387 582 813 1090 1390 1740 2120 2550 2970 3420 3920 4460
5.8 115 216 358 542 761 1030 1320 1650 2010 2430 2840 3280 3760 4290
6.0 105 199 332 506 713 965 1250 1560 1920 2320 2710 3150 3620 4140
6.2 97 184 308 472 669 909 1180 1480 1820 2210 2600 3020 3480 3990
6.4 89 170 287 442 628 857 1110 1400 1730 2110 2490 2910 3360 3850
6.6 82 157 267 413 590 808 1050 1330 1650 2010 2380 2790 3240 3720
6.8 76 146 248 386 553 761 990 1260 1560 1910 2280 2690 3120 3600
7.0 70 135 231 360 518 716 933 1190 1480 1820 2180 2580 3010 3480
7.2 64 125 214 336 485 672 878 1120 1400 1720 2070 2470 2900 3370
7.4 59 115 198 312 451 628 822 1060 1320 1630 1970 2350 2780 3250
7.6 54 105 182 287 417 583 765 980 1230 1530 1850 2230 2650 3120
7.8 48 94 164 261 380 533 701 901 1140 1410 1720 2090 2500 2970
8.0 38 76 134 214 314 444 587 758 960 1200 1480 1810 2210 2670
Roadway Design Manual 2-17 TxDOT 10/2013
Chapter 2 — Basic Design Criteria Section 4 — Horizontal Alignment
Desirable design values for length of superelevation transition are based on using a given maxi-
mum relative gradient between profiles of the edge of traveled way and the axis of rotation. Table
2-8 shows recommended maximum relative gradient values. Transition length on this basis is
directly proportional to the total superelevation, which is the product of the lane width and the
change in cross slope.
NOTE: Online users can view the metric version of this table in PDF format.
Transition length, L, for a multilane highway can be calculated using the following equation:
LCT = [(CS)(W)]/G (US Customary)
Where:
LCT = calculated transition length (ft)
CS = percent change in cross slope of superelevated pavement,
W = distance between the axis of rotation and the edge of traveled way (ft),
G = maximum relative gradient (“Table 2-8: Maximum Relative Gradient for Superelevation
Transition”).
NOTE: Online users can view the metric version of this equation in PDF format.
Example determinations of superelevation transition shown in Figure 2-1.
Table 2-8: Maximum Relative Gradient for Superelevation Transition
Design Speed (mph) Maximum
Relative Gradient%1
Equivalent Maximum
Relative Slope
15 0.78 1:128
20 0.74 1:135
25 0.70 1:143
30 0.66 1:152
35 0.62 1:161
40 0.58 1:172
45 0.54 1:185
50 0.50 1:200
55 0.47 1:213
60 0.45 1:222
65 0.43 1:233
70 0.40 1:250
75 0.38 1:263
80 0.35 1:286
1 Maximum relative gradient for profile between edge of traveled way and axis of
rotation.
Roadway Design Manual 2-19 TxDOT 10/2013
Chapter 2 — Basic Design Criteria Section 4 — Horizontal Alignment
where “b” is defined in Table 2-9
Superelevation Transition Placement
The location of the transition in respect to the termini of a simple (circular) curve should be placed
to minimize lateral acceleration and the vehicle's lateral motion. The appropriate allocation of
superelevation transition on the tangent, either preceding or following a curve, is provided on Table
2-10. When spiral curves are used, the transition usually is distributed over the length of the spiral
curve.
Care must be exercised in designing the length and location of the transition. Profiles of both gut-
ters or pavement edges should be plotted relative to the profile grade line to insure proper drainage,
especially where these sections occur within vertical curvature of the profile grade line. Special
care should be given to ensure that the zero cross slope in the superelevation transition does not
occur near the flat portion of the crest or sag vertical curve. A plot of roadway contours can identify
drainage problems in areas of superelevation transition. See "Minimum Transition Grades" section
of AASHTO's A Policy on Geometric Design of Highways and Streets for further discussion on
potential drainage problems and effective means to mitigate them.
Whenever reverse curves are closely spaced and superelevation transition lengths overlap, L values
should be adjusted to prorate change in cross slope and to ensure that roadway cross slopes are in
the proper direction for each horizontal curve.
Table 2-9: Multilane Adjustment Factor1
Number of Lanes Rotated Adjustment Factor (b)
1.5 0.83
2 0.75
2.5 0.70
3 0.67
3.5 0.64
1 These adjustment factors are directly applicable to undivided streets and highways. For divided highways where the
axis of rotation is not the edge of travel, see AASHTO’s A Policy on Geometric Design of Highways and Streets dis-
cussion under “Axis of Rotation with a Median”.
Table 2-10: Portion of Superelevation Transition Located on the Tangent1
Design Speed
(mph)
No. of Lanes Rotated
1.0 1.5 2.0 - 2.5 3.0 - 3.5
15 - 45 0.80 0.85 0.90 0.90
50 - 80 0.70 0.75 0.80 0.85
1
These values are desirable and should be followed as closely as possible when conditions allow. A
value between 0.6 and 0.9 for all speeds and rotated widths is considered acceptable. (AASHTO’s A
Policy on Geometric Design of Highways and Streets, 2011, pg. 3-67).
Roadway Design Manual 2-25 TxDOT 10/2013
Chapter 2 — Basic Design Criteria Section 5 — Vertical Alignment
Table 2-11 summarizes the maximum grade controls in terms of design speed. Generally, maxi-
mum design grade should be used infrequently rather than as a value to be used in most cases.
However, for certain cases such as urban freeways, a maximum value may be applied in blanket
fashion on interchange and grade separated approaches.
Flat or level grades on uncurbed pavements are satisfactory when the pavement is adequately
crowned to drain the surface water laterally. When side ditches are required, the grade should sel-
dom be less than 0.5 percent for unpaved ditches and 0.25 percent for lined channels. With curbed
pavements, desirable minimum grades of 0.35 percent should be provided to facilitate surface
drainage. Joint analyses of rainfall frequency and duration, the longitudinal grade, cross slope,
curb inlet type and spacing of inlets or discharge points usually is required so that the width of
water on the pavement surface during likely storms does not unduly interfere with traffic. Criteria
Table 2-11: Maximum Grades
Functional
Classification
Type of
Terrain
15 20 25 30 35 40 45 50 55 60 65 70 75 80
Urban and
Suburban:
- - - - - - - - - - - - - - -
- - - - - - - - - - - - - - - -
Local1 All <15 <15 <15 <15 <15 <15 <15 -- -- -- -- -- -- --
- - - - - - - - - - - - - - - -
Collector Level 9 9 9 9 9 9 8 7 7 6 -- -- -- --
- Rolling 12 12 12 11 10 10 9 8 8 7 -- -- -- --
- - - - - - - - - - - - - - - -
Arterial Level -- -- -- 8 7 7 6 6 5 5 -- -- -- --
- Rolling -- -- -- 9 8 8 7 7 6 6 -- -- -- --
- - - - - - - - - - - - - - - -
Freeway Level -- -- -- -- -- -- -- 4 4 3 3 3 3 3
- Rolling -- -- -- -- -- -- -- 5 5 4 4 4 4 4
Rural: - - - - - - - - - - - - - - -
Local Level 9 8 7 7 7 7 7 6 6 5 -- -- -- --
- Rolling 12 11 11 10 10 10 9 8 7 6 -- -- -- --
- - - - - - - - - - - - - - - -
Collector Level - 7 7 7 7 7 7 6 6 5 -- -- -- --
- Rolling - 10 10 9 9 8 8 7 7 6 -- -- -- --
- - - - - - - - - - - - - - - -
Arterial Level -- -- -- -- -- 5 5 4 4 3 3 3 3 3
- Rolling -- -- -- -- -- 6 6 5 5 4 4 4 4 4
- - - - - - - - - - - - - - - -
Freeway Level -- -- -- -- -- -- -- 4 4 3 3 3 3 3
- Rolling -- -- -- -- -- -- -- 5 5 4 4 4 4 4
1
8% maximum in commercial areas on local streets, desirably less than 5%. Flatter gradients should be used where practical.
Roadway Design Manual 2-44 TxDOT 10/2013
Chapter 2 — Basic Design Criteria Section 6 — Cross Sectional Elements
NOTE: Online users can view the metric version of this table in PDF format.
The clear zone values shown in Table 2-12 are measured from the edge of travel lane. These are
appropriate design values for all cut sections (see “Drainage Facility Placement”), for cross sec-
tional design of ditches within the clear zone area) and for all fill sections with side slopes 1V:4H or
flatter. It should be noted that, while a 1V:4H slope is acceptable, that a 1V:6H or flatter slope is
preferred for both errant vehicle performance and slope maintainability. For fill slopes steeper than
1V:4H, errant vehicles have a reduced chance of recovery and the lateral extent of each roadside
encroachment increases. It is therefore preferable to provide an obstacle-free area of 10 ft[3.0m]
beyond the toe of steep side slopes even when this area is outside the clear zone.
Table 2-12: Clear Zones
Location Functional
Classification
Design Speed
(mph)
Avg. Daily
Traffic
Clear Zone Width (ft)3,4,5
- - - - Minimum Desirable
Rural Freeways All All 30 (16 for ramps)
Rural Arterial All 0 - 750
750 - 1500
>1500
10
16
30
16
30
--
Rural Collector  All Use above rural arterial criteria.
Rural Collector 45 All 10 --
Rural Local All All 10 --
Suburban All All <8,000 106 106
Suburban All All 8,000 - 12,000 106 206
Suburban All All 12,000 - 16,000 106 256
Suburban All All >16,000 206 306
Urban Freeways All All 30 (16 for ramps)
Urban All (Curbed)  All Use above suburban criteria insofar
as available border width permits.
Urban All (Curbed)  All 4 from curb face 6
Urban All (Uncurbed)  All Use above suburban criteria.
Urban All (Uncurbed)  All 10 --
1 Because of the need for specific placement to assist traffic operations, devices such as traffic signal supports,
railroad signal/warning device supports, and controller cabinets are excluded from clear zone requirements.
However, these devices should be located as far from the travel lanes as practical. Other non-breakaway
devices should be located outside the prescribed clear zone or these devices should be protected with barrier.
2
Average ADT over project life, i.e., 0.5 (present ADT plus future ADT). Use total ADT on two-way roadways
and directional ADT on one-way roadways.
3
Without barrier or other safety treatment of appurtenances.
4
Measured from edge of travel lane for all cut sections and for all fill sections where side slopes are 1V:4H or
flatter. Where fill slopes are steeper than 1V:4H it is desirable to provide a 10 ft area free of obstacles beyond
the toe of slope.
5
Desirable, rather than minimum, values should be used where feasible.
6 Purchase of 5 ft or less of additional right-of-way strictly for satisfying clear zone provisions is not required.
Roadway Design Manual 2-46 TxDOT 10/2013
Chapter 2 — Basic Design Criteria Section 7 — Drainage Facility Placement
appropriate entities prior to in-depth development of Plans, Specifications, and Estimates
(P.S.&E.).
Design Treatment of Cross Drainage Culvert Ends
Cross drainage culverts are defined as those handling drainage across and beneath the highway.
Selection of an appropriate end treatment is primarily related to culvert size, culvert end location,
side slope rate, terrain characteristics, drift conditions, right-of-way availability, and other consid-
erations that may influence treatment selection at individual sites.
Roadside safety performance is related to clear zone width and side slope rate. (For a discussion of
safety performance and design guidelines related to side slopes, see “Slopes and Ditches”) Where
right-of-way availability and economic conditions permit, flatter slopes may be used.
Design values for clear zones are shown in “Table 2-12: Clear Zones” for new location and major
reconstruction projects. Within the clear zone, sideslopes should preferably be 1V:6H or flatter
with 1V:4H as a maximum steepness in most cases.
Small Pipe Culverts. A small pipe culvert is defined as a single round pipe with 36 inches [900
mm] or less diameter, or multiple round pipes each with 30 inches [750 mm] or less diameter, each
oriented on normal skew. (Note: For arch pipes, use span dimension instead of diameter.)
When skews are involved, the definition of a small pipe culvert is modified as shown in Table 2-13:
NOTE: Click here to see the metric version of the table.
Small pipe culverts with sloping, open ends have been crash tested and proven to be safely travers-
able by vehicles for a range of speeds. Small pipe ends should be sloped at a rate of 1V:3H or
flatter and should match side slope rate thereby providing a flush, traversable safety treatment. Sin-
gle box culverts on normal skew with spans of 36 inches [900 mm] or less may be effectively safety
treated just as small pipes (open, match 1V:3H or flatter slope).
When vulnerable to run-off-the-road vehicles (i.e., unshielded by barrier), sloped ends should be
provided on small pipe culverts regardless of culvert end location with respect to clear zone dimen-
sions. For existing culverts, this often entails removing existing headwalls and may include
removing the barrier treatment if it is no longer needed to protect an obstacle other than a culvert
end. The resultant culvert with sloped end is both safe and inexpensive.
Table 2-13: Maximum Diameter of Small Pipe Culvert
Skew (degree) Single Pipe (in.) Multiple Pipe (in.)
15 30 30
30 24 24
45 24 21
Roadway Design Manual 2-53 TxDOT 10/2013
Chapter 2 — Basic Design Criteria Section 7 — Drainage Facility Placement
Side Ditches
For side ditches, attention to cross section design can reduce the likelihood of serious injuries
during vehicular encroachments. Ditches with the cross sectional characteristics defined in Table
2-15 are preferred and should especially be sought when ditch location is within the clear zone
requirements. Where conditions dictate, such as insufficient existing right-of-way to accommodate
the preferred ditch cross section or where ditches are located outside the horizontal clearance
requirements, other ditch configurations may be used. Typically, guardrail is not necessary where
the preferred ditch cross sections are provided.
Ditches that include retards to control erosion should be avoided inside the clear zone requirements
and should be located as far from the travel lanes as practical unless the retardant is a rock filter
dam with side slopes of 1V:6H or flatter. Non-traversable catch or stilling basins should also be
located outside the clear zone requirements.
Table 2-15: Preferred Ditch Cross Sections
- Preferred Maximum Back Slope (Vertical:Horizontal)
Given Front Slope
(Vertical:Horizontal)
V-Shaped Trapezoidal-Shaped
1V:8H 1V:3.5H 1V:2.5H
1V:6H 1V:4H 1V:3H
1V:4H 1V:6H 1V:4H
1V:3H Level 1V:8H
Roadway Design Manual 3-4 TxDOT 10/2014
Chapter 3 — New Location and Reconstruction (4R)
Design Criteria
Section 2 — Urban Streets
ble to new location, reconstruction or major improvement projects (such as widening to provide
additional lanes).
Table 3-1: Geometric Design Criteria for Urban Streets
(US Customary)
Item Functional Class Desirable Minimum
Design Speed (mph) All Up to 60 30
Minimum Horiz. Radius All See Tables 2-3 and 2-4, Figure 2-2
Maximum Gradient (%) All See Table 2-9
Stopping Sight Distance All See Table 2-1
Width of Travel Lanes (ft) Arterial
Collector
Local
12
12
11-12
111
102
102,3
Curb Parking Lane Width (ft) Arterial
Collector
Local
12
10
9
104
75
75
Shoulder Width6
(ft), Uncurbed Urban
Streets
Arterial
Collector
Local
10
8
--
4
3
2
Width of Speed Change Lanes (ft) Arterial and Collector
Local
11-12
10-12
10
9
Offset to Face of Curb (ft) All 2 1
Median Width All See Medians
Border Width (ft) Arterial
Collector
20
20
15
15
Right-of-Way Width All Variable 7
Clear Sidewalk Width (ft)10 All 6-88 5
On-Street Bicycle Lane Width All See Chapter 6, Bicycle Facilities
Superelevation All See Chapter 2, Superelevation
Horizontal Clearance Width All See Table 2-11
Vertical Clearance for New Structures (ft) All 16.5 16.59
Turning Radii - See Chapter 7, Minimum Designs for Truck and
Bus Turns
Roadway Design Manual 3-5 TxDOT 10/2014
Chapter 3 — New Location and Reconstruction (4R)
Design Criteria
Section 2 — Urban Streets
1
In highly restricted locations or locations with few trucks and speeds less than or equal to 40 mph, 10 ft permissible.
2
In industrial areas 12 ft usual, and 11 ft minimum for restricted R.O.W. conditions. In non-industrial areas, 10 ft
minimum.
3 In residential areas, 9 ft minimum.
4
Where there is no demand for use as a future through lane, 8 ft minimum.
5
In commercial and industrial areas, 8 ft minimum.
6 Where only minimum width is provided, it should be fully surfaced. Where desirable width is provided, partial (not less
than minimum width) surfacing or full width surfacing may be provided at the option of the designer.
7
Right-of-way width is a function of roadway elements as well as local conditions.
8
Applicable for commercial areas, school routes, or other areas with concentrated pedestrian traffic.
9 Exceptional cases near as practical to 16.5 ft but never less than 14.5 ft. Existing structures that provide at least 14 ft
may be retained.
10
Cross slopes, ramps, and sidewalks shall be in compliance with the Americans with Disabilities Act Accessibility
Guidelines and the Texas Accessibility Standards. See Chapter 2, Curb and Curb and Gutters and Sidewalks and Pedes-
trian Elements.
Table 3-1: Geometric Design Criteria for Urban Streets
(US Customary)
Table 3-1: Geometric Design Criteria for Urban Streets
(Metric)
Item Functional Class Desirable Minimum
Design Speed (km/h) All Up to 100 50
Minimum Horiz. Radius All See Tables 2-3 and 2-4, Figure 2-2
Maximum Gradient (%) All See Table 2-9
Stopping Sight Distance All See Table 2-1
Width of Travel Lanes (m) Arterial
Collector
Local
3.6
3.6
3.3-3.6
3.31
3.02
3.02,3
Curb Parking Lane Width (m) Arterial
Collector
Local
3.6
3.0
2.7
3.04
2.15
2.15
Shoulder Width 6 (m), Uncurbed Urban
Streets
Arterial
Collector
Local
3.0
2.4
--
1.2
0.9
0.6
Width of Speed Change Lanes (m) Arterial and Collector
Local
3.3-3.6
3.0-3.6
3.0
2.7
Offset to Face of Curb (m) All 0.6 0.3
Median Width All See Medians
Border Width (m) Arterial
Collector
6.0
6.0
4.5
4.5
Right-of-Way Width All Variable 7
Clear Sidewalk Width (m)10 All 1.8-2.48 1.5
Roadway Design Manual 3-6 TxDOT 10/2014
Chapter 3 — New Location and Reconstruction (4R)
Design Criteria
Section 2 — Urban Streets
For minor rehabilitation projects where no additional lanes are proposed, existing curbed cross sec-
tions should be compared with the design criteria in Table 3-1 to determine the practicality and
economic feasibility of minor widening to meet the prescribed standards. Where only minimal wid-
ening is required to conform with a standard design, it is often cost effective to retain the existing
street section, thereby sparing the cost of removing and replacing concrete curb and gutter and curb
inlets. For these type projects, Resurfacing, Restoration, and Rehabilitation (3R) guidelines are
usually applicable, see Chapter 4.
Medians
Medians are desirable for urban streets with four or more traffic lanes. The primary functions of
medians are to provide the following:
 storage space for left-turning vehicles
 separation of opposing traffic streams
 access control to/from minor access drives and intersection.
Medians used on urban streets include the following types:
 raised
On-Street Bicycle Lane Width All See Chapter 6, Bicycle Facilities
Superelevation All See Chapter 2 Superelevation
Horizontal Clearance Width All See Table 2-11
Vertical Clearance for New Structures (m) All 5.0 5.09
Turning Radii - See Chapter 7, Minimum Designs for Truck and
Bus Turns
1
In highly restricted locations or locations with few trucks and speeds less than or equal to 60 km/h 3.0 m permissible.
2
In industrial areas 3.6 m usual, and 3.3 m minimum for restricted R.O.W. conditions. In non-industrial areas, 3.0 m
minimum.
3 In residential areas, 2.7 m minimum.
4
Where there is no demand for use as a future through lane, 2.4 m minimum.
5
In commercial and industrial areas, 2.4 m minimum.
6 Where only minimum width is provided, it should be fully surfaced. Where desirable width is provided, partial (not less
than minimum width) surfacing or full width surfacing may be provided at the option of the designer.
7
Right-of-way width is a function of roadway elements as well as local conditions.
8
Applicable for commercial areas, school routes, or other areas with concentrated pedestrian traffic.
9 Exceptional cases near as practical to 5.0 m but never less than 4.4 m. Existing structures that provide at least 4.3 m may
be retained.
10
Cross slopes, ramps, and sidewalks shall be in compliance with the Americans with Disabilities Act Accessibility
Guidelines and the Texas Accessibility Standards. See Chapter 2, Curb and Curb and Gutters and Sidewalks and Pedes-
trian Elements.
Table 3-1: Geometric Design Criteria for Urban Streets
(Metric)
Roadway Design Manual 3-8 TxDOT 10/2014
Chapter 3 — New Location and Reconstruction (4R)
Design Criteria
Section 2 — Urban Streets
Recommended median lane widths for the TWLTL design are as shown in Table 3-2. In applying
these criteria on new location projects or on reconstruction projects where widening necessitates
the removal of exterior curbs, the median lane width should not be less than 12 ft [3.6 m], and pref-
erably the desirable value shown in Table 3-2. Minimum values shown in Table 3-2 are appropriate
for restrictive right-of-way projects and improvement projects where attaining the desirable width
would necessitate removing and replacing exterior curbing to gain only a small amount of roadway
width.
Criteria for the potential use of a TWLTL for urban streets are as follows:
 future ADT volume of 3,000 vehicles per day for an existing two-lane urban street, 6,000 vehi-
cles per day for an existing four-lane urban street, or 10,000 vehicles per day for an existing
six-lane urban street
 side road plus driveway density of 20 or more entrances per mile [12 or more entrances per
kilometer].
When the above two conditions are met, the site should be considered suitable for the use of a
TWLTL. For ADT volumes greater than 20,000 vehicle per day or where development is occurring,
and volumes are increasing and are anticipated to reach this level, a raised median design should be
considered. Seven-lane cross sections should be evaluated for pedestrian crossing capabilities.
Median Openings
Openings should only be provided for street intersections or at intervals for major developed areas.
Spacing between median openings must be adequate to allow for introduction of left-turn lanes and
signal detection loops to operate without false calls. A directional opening can be used to limit the
number and type of conflict. Figures 3-1 illustrates the different options for the design of a direc-
tional median opening.
Table 3-2: Median Lane Widths for Two-Way Left-Turn Lanes
(US Customary) (Metric)
Design Speed
Mph
Width of TWLTL - ft Design Speed
Km/h
Width of TWLTL – m
Desirable Minimum Desirable Minimum
Less than or
equal to 40
12 - 14 11 Less than or
equal to 60
3.6 - 4.2 3.3
45 - 50 14 12 70 - 80 4.2 3.6
Greater than 50 16 14 Greater than 80 4.8 4.2
Roadway Design Manual 3-13 TxDOT 10/2014
Chapter 3 — New Location and Reconstruction (4R)
Design Criteria
Section 2 — Urban Streets
Figure 3-3. Left-Turn Lanes on Urban Streets. Click here to see a PDF of the image.
Table 3-3 provides recommended taper lengths, deceleration lengths, and storage lengths for left-
turn lanes. These guidelines may also be applied to the design of right-turn lanes.
Table 3-3: Lengths of Single Left-Turn Lanes on Urban Streets1
(US Customary)
Speed
(mph)
Deceleration
Length2(
ft)
Taper
Length (ft)
Storage Length (ft)
- Signalized Non-Signalized
- Calculated Minimum4 Calculated5 Minimum4
30 160 50 See footnote 3 100 See footnote 5 100
Roadway Design Manual 3-14 TxDOT 10/2014
Chapter 3 — New Location and Reconstruction (4R)
Design Criteria
Section 2 — Urban Streets
Deceleration Length. Deceleration length assumes that moderate deceleration will occur in the
through traffic lane and the vehicle entering the left-turn lane will clear the through traffic lane at a
speed of 10 mph (15 km/h) slower than through traffic. Where providing this deceleration length is
35 215 50 See footnote 3 100 See footnote 5 100
40 275 50 See footnote 3 100 See footnote 5 100
45 345 100 See footnote 3 100 See footnote 5 100
50 425 100 See footnote 3 100 See footnote 5 100
55 510 100 See footnote 3 100 See footnote 5 100
(Metric)
Speed
(km/h)
Deceleration
Length2 (m)
Taper
Length (m)
Storage Length (m)
Signalized Non-Signalized
Calculated Minimum4 Calculated Minimum4
50 50 15 See footnote 3 30 See footnote 5 30
60 65 15 See footnote 3 30 See footnote 5 30
70 85 30 See footnote 3 30 See footnote 5 30
80 105 30 See footnote 3 30 See footnote 5 30
90 130 30 See footnote 3 30 See footnote 5 30
1
The minimum length of a left-turn lane is the sum of the deceleration length plus queue storage. In order to
determine the design length, the deceleration plus storage length must be calculated for peak and off-peak
periods, the longest total length will be the minimum design length.
2
See Deceleration Length discussion immediately following Table 3-3.
3 See Storage Length Calculations discussion immediately following Table 3-3A.
4
The minimum storage length shall apply when: 1) the required queue storage length calculated is less than
the minimum length, or 2) there is no rational method for estimating the left-turn volume.
5
The calculated queue storage at unsignalized location using a traffic model or simulation model or by the
following:
L = (V/30)(2)(S)
where: (V/30) is the left-turn volume in a two-minute interval and other terms are as defined in the
Storage Length Calculations discussion immediately following Table 3-3A.
Table 3-3: Lengths of Single Left-Turn Lanes on Urban Streets1
(US Customary)
Roadway Design Manual 3-15 TxDOT 10/2014
Chapter 3 — New Location and Reconstruction (4R)
Design Criteria
Section 2 — Urban Streets
impractical, it may be acceptable to allow turning vehicles to decelerate more than 10 mph (15km/
h) before clearing the through traffic lane. See Table 3-3A.
Storage Length Calculations. The required storage may be obtained using an acceptable traffic
model such as the latest version of the HCM software (HCS), SYNCHRO, or VISSIM or other
acceptable simulation models. Where such model results have not been applied, the following may
be used:
L = (V/N)(2)(S)
where:
 L = storage length in feet (or meters)
 V = left-turn volume per hour, vph
 N = number of cycles
 2 = a factor that provides for storage of all left-turning vehicles on most cycles; a value of 1.8
may be acceptable on collector streets
 S = queue storage length, in feet (or meters), per vehicle
Table 3-3A Deceleration Lengths for Speed Differentials Greater than 10 mph (15km/h)
US Customary (ft) Metric (m)
Speed Speed Differential* Speed Speed Differential*
(mph) 15 mph 20 mph (km/h) 20 km/h 25km/h
30 110 75 50 40 35
35 160 110 60 60 50
40 215 160 70 75 65
45 275 215 80 95 85
50 345 275 90 115 105
55 425 345
* Speed differential = the difference between a turning vehicle when it clears the through traffic lane and
speed of following through traffic. Clearance is considered to have occurred when the turning vehicle has
moved laterally a sufficient distance (10 ft. [3m]) so that a following through vehicle can pass without
encroaching upon the adjacent through lane.
% of
trucks
S (ft) S (m)
<5 25 7.6
5-9 30 9.1
Roadway Design Manual 3-16 TxDOT 10/2014
Chapter 3 — New Location and Reconstruction (4R)
Design Criteria
Section 2 — Urban Streets
Dual Left-Turn Deceleration Lanes. For major signalized intersections where high peak hour
left-turn volumes are expected, dual left-turn lanes should be considered. As with single left-turn
lanes, dual left-turn lanes should desirably include length for deceleration, storage, and taper. Table
3-4 provides recommended lengths for dual left-turn lanes.
Right-Turn Acceleration Lanes. Acceleration lanes typically are not used on urban streets. See
Section 5, Figure 3-10, for acceleration distances and taper lengths if an acceleration lane may be
necessary.
Right-Turn Deceleration Lanes. Figure 3-4 illustrates a right-turn deceleration lane. The length of
a single right-turn deceleration lane is the same as that for a single left-turn lane (see Table 3-3).
10-14 35 10.7
15-19 40 12.2
Table 3-4: Lengths of Dual Left-Turn Lanes on Urban Streets 1
(US Customary)
Speed Deceleration Taper Storage Length (ft)
(mph) Length2
(ft) Length (ft) Calculated 3
Minimum4
30 160 100 See footnote 3 100
35 215 100 See footnote 3 100
40 275 100 See footnote 3 100
45 345 150 See footnote 3 100
50 425 150 See footnote 3 100
55 510 150 See footnote 3 100
Table 3-4: Lengths of Dual Left-Turn Lanes on Urban Streets
(Metric)
Speed Deceleration Taper Storage Length (m)
(km/h) Length2
(m) Length (m) Calculated3
Minimum4
50 50 30 See footnote 3 30
60 65 30 See footnote 3 30
70 85 45 See footnote 3 30
80 105 45 See footnote 3 30
90 130 45 See footnote 3 30
See Table 3-3 for footnotes.
Roadway Design Manual 3-20 TxDOT 10/2014
Chapter 3 — New Location and Reconstruction (4R)
Design Criteria
Section 3 — Suburban Roadways
Design Speed (mph) All 60 50
Minimum Horizontal Radius All See Tables 2-3 and 2-4
Maximum Gradient (%) All See Table 2-9
Stopping Sight Distance All See Table 2-1
Width of Travel Lanes (ft) Arterial
Collector
12
12
111
102
Curb Parking Lane Width (ft) All None
Shoulder Width (ft) All 10 4
Width of Speed Change Lanes3
(ft) All 11-12 10
Offset to Face of Curb (ft) All 2 1
Median Width All See Medians, Urban Streets
Border Width (ft) Arterial
Collector
20
20
15
15
Right-of-Way Width (ft) All Variable4
Sidewalk Width (ft) All 6-85
5
Superelevation All See Chapter 2, Superelevation
Horizontal Clearance All See Table 2-11
Vertical Clearance for New Strs. (ft) All 16.5 16.56
Turning Radii All See Chapter 7, Minimum Designs for
Truck and Bus Turns
1
In highly restricted locations, 10 ft permissible.
2
In industrial areas 12 ft usual, and 11 ft minimum for restricted R.O.W. conditions. In non-industrial
areas, 10 ft minimum.
3
Applicable when right or left-turn lanes are provided.
4
Right-of-way width is a function of roadway elements as well as local conditions.
5 Applicable for commercial areas, school routes, or other areas with concentrated pedestrian traffic.
6
Exceptional cases near as practical to 16.5 ft but never less than 14.5 ft. Existing structures that provide
at least 14 ft may be retained.
Table 3-5: Geometric Design Criteria for Suburban Roadways
(Metric)
Item Functional Class Desirable Minimum
Design Speed (km/h) All 100 80
Table 3-5: Geometric Design Criteria for Suburban Roadways
(US Customary)
Roadway Design Manual 3-21 TxDOT 10/2014
Chapter 3 — New Location and Reconstruction (4R)
Design Criteria
Section 3 — Suburban Roadways
Access Control
A major concern for suburban roadways is the large number of access points introduced due to
commercial development. These access points create conflicts between exiting/entering traffic and
through traffic. In addition, the potential for severe accidents is increased due to the high-speed dif-
ferentials. Driver expectancy is also violated because through traffic traveling at high speeds does
Minimum Horizontal Radius All See Tables 2-3 and 2-4
Maximum Gradient (%) All See Table 2-9
Stopping Sight Distance All See Table 2-1
Width of Travel Lanes (m) Arterial
Collector
3.6
3.6
3.31
3.02
Curb Parking Lane Width (m) All None
Shoulder Width (m) All 3.0 1.2
Width of Speed Change Lanes3 (m) All 3.3-3.6 3.0
Offset to Face of Curb (m) All 0.6 0.3
Median Width All See Medians, Urban Streets
Border Width (m) Arterial
Collector
6.0
6.0
4.5
4.5
Right-of-Way Width (m) All Variable4
Sidewalk Width (m) All 1.8-2.45 1.5
Superelevation All See Chapter 2, Superelevation
Horizontal Clearance All See Table 2-11
Vertical Clearance for New Strs. (m) All 5.0 5.06
Turning Radii All See Chapter 7, Minimum Designs for
Truck and Bus Turns
1 In highly restricted locations, 3.0 m permissible.
2
In industrial areas 3.6 m usual, and 3.3 m minimum for restricted R.O.W. conditions. In non-industrial
areas, 3.0 m minimum.
3 Applicable when right or left-turn lanes are provided.
4
Right-of-way width is a function of roadway elements as well as local conditions.
5
Applicable for commercial areas, school routes, or other areas with concentrated pedestrian traffic.
6 Exceptional cases near as practical to 5.0 m but never less than 4.4 m. Existing structures that provide at
least 4.3 m may be retained.
Table 3-5: Geometric Design Criteria for Suburban Roadways
(Metric)
Roadway Design Manual 3-25 TxDOT 10/2014
Chapter 3 — New Location and Reconstruction (4R)
Design Criteria
Section 4 — Two-Lane Rural Highways
Overview
The general geometric features for two-lane rural highways are provided in this section and are
summarized in the following tables and figures:
 Figure 3-5: Typical cross section
 Table 3-6: Minimum Design Speed for Rural Two-lane Highways: Minimum design speed
 Table 3-7. Geometric Design Criteria for Rural Two-Lane Highways: Basic design criteria and
cross sectional elements
 Table 3-8: Width of Travel Lanes and Shoulders on Rural Two-lane Highways: Lane and
shoulder widths
 Table 3-9: Minimum Structure Widths For Bridges to Remain in Place on Rural Two-lane
Highways: Minimum structure widths that may remain in place.
Additional information on structure widths may be obtained in the Bridge Design - LRFD and
the Bridge Project Development Manual.
Table 3-6: Minimum Design Speed for Rural Two-lane Highways
(US Customary)
Functional - Minimum Design Speed (mph) for future ADT of:
Class Terrain < 400 400-1500 1500-2000 > 2000
Arterial Level
Rolling
70
60
Collector Level
Rolling
501
402
50
40
50
40
60
50
Local3
Level
Rolling
402
30
50
40
50
40
50
40
(Metric)
Functional - Minimum Design Speed (km/h) for future ADT of:
Class Terrain < 400 400-1500 1500-2000 > 2000
Arterial Level
Rolling
110
100
Collector Level
Rolling
801
602
80
60
80
60
100
80
Roadway Design Manual 3-26 TxDOT 10/2014
Chapter 3 — New Location and Reconstruction (4R)
Design Criteria
Section 4 — Two-Lane Rural Highways
Local3
Level
Rolling
602
50
80
60
80
60
80
60
1
A 40 mph [60 km/h] minimum design speed may be used where roadside environment or unusual design
considerations dictate.
2
A 30 mph [50 km/h] minimum design speed may be used where roadside environment or unusual design
considerations dictate.
3 Applicable only to off-system routes that are not functionally classified at a higher classification.
Table 3-7. Geometric Design Criteria for Rural Two-Lane Highways
(US Customary)
Geometric Design Element Functional Class Reference or Design Value
Design Speed All Table 3-6
Minimum Horizontal Radius All Table 2-3and Table 2-4
Max. Gradient All Table 2-9
Stopping Sight Distance All Table 2-1
Width of Travel Lanes All Table 3-8
Width of Shoulders All Table 3-8
Vertical Clearance, New Structures All 16.5 ft1
Horizontal Clearance All Table 2-11
Pavement Cross Slope All Chapter 2, Pavement Cross Slope
(Metric)
Geometric Design Element Functional Class Reference or Design Value
Design Speed All Table 3-6
Minimum Horizontal Radius All Table 2-3and Table 2-4
Max. Gradient All Table 2-9
Stopping Sight Distance All Table 2-1
Width of Travel Lanes All Table 3-8
Width of Shoulders All Table 3-8
Vertical Clearance, New Structures All 5.0 m1
Horizontal Clearance All Table 2-11
Table 3-6: Minimum Design Speed for Rural Two-lane Highways
(US Customary)
Roadway Design Manual 3-27 TxDOT 10/2014
Chapter 3 — New Location and Reconstruction (4R)
Design Criteria
Section 4 — Two-Lane Rural Highways
Pavement Cross Slope All Chapter 2, Pavement Cross Slope
1 Exceptional cases near as practical to 16.5 ft [5.0 m] but never less than 14.5 ft [4.4 m].
Table 3-8: Width of Travel Lanes and Shoulders on Rural Two-lane Highways
(US Customary)
Functional Class Design Speed
(mph)
Minimum Width 1,2(ft) for future ADT of:
- - < 400 400-1500 1500-2000 > 2000
Arterial LANES (ft)
- All 12
- SHOULDERS (ft)
- All 43 43 or 83 83 8 - 103
Collector LANES (ft)
- 30 10 10 11 12
- 35 10 10 11 12
- 40 10 10 11 12
- 45 10 10 11 12
- 50 10 10 12 12
- 55 10 10 12 12
- 60 11 11 12 12
- 65 11 11 12 12
- 70 11 11 12 12
- 75 11 12 12 12
- 80 11 12 12 12
- SHOULDERS (ft)
- All 24,5
45
85
8 - 105
Local6 LANES (ft)
- 30 10 10 11 12
- 35 10 10 11 12
- 40 10 10 11 12
- 45 10 10 11 12
- 50 10 10 11 12
- SHOULDERS (ft)
- All 2 4 4 8
Table 3-7. Geometric Design Criteria for Rural Two-Lane Highways
(US Customary)
Roadway Design Manual 3-28 TxDOT 10/2014
Chapter 3 — New Location and Reconstruction (4R)
Design Criteria
Section 4 — Two-Lane Rural Highways
1
Minimum surfacing width is 24 ft for all on-system state highway routes.
2
On high riprapped fills through reservoirs, a minimum of two 12 ft lanes with 8 ft shoulders should be pro-
vided for roadway sections. For arterials with 2,000 or more ADT in reservoir areas, two 12 ft lanes with 10 ft
shoulders should be used.
3On arterials, shoulders fully surfaced.
4
On collectors, use minimum 4 ft shoulder width at locations where roadside barrier is utilized.
5
For collectors, shoulders fully surfaced for 1,500 or more ADT. Shoulder surfacing not required but desirable
even if partial width for collectors with lower volumes and all local roads.
6 Applicable only to off-system routes that are not functionally classified at a higher classification.
Table 3-8: Width of Travel Lanes and Shoulders on Rural Two-lane Highways
(Metric)
Functional Class Design Speed
(km/h)
Minimum Width 1,2
(m) for future ADT of:
- - < 400 400-1500 1500-2000 > 2000
Arterial LANES (m)
- All 3.6
- SHOULDERS (m)
- All 1.23
1.23
or 2.43
2.43
2.4 - 3.03
Collector LANES (m)
- 50 3.0 3.0 3.3 3.6
- 60 3.0 3.0 3.3 3.6
- 70 3.0 3.0 3.3 3.6
- 80 3.0 3.0 3.6 3.6
- 90 3.0 3.0 3.6 3.6
- 100 3.3 3.3 3.6 3.6
- 110 3.3 3.3 3.6 3.6
- 120 3.3 3.6 3.6 3.6
- 130 3.3 3.6 3.6 3.6
- SHOULDERS (m)
- All 0.64,5 1.25 2.45 2.4-3.05
Local6 LANES (m)
- 50 3.0 3.0 3.3 3.6
- 60 3.0 3.0 3.3 3.6
- 70 3.0 3.0 3.3 3.6
- 80 3.0 3.0 3.3 3.6
- SHOULDERS (m)
- All 0.6 1.2 1.2 2.4
Table 3-8: Width of Travel Lanes and Shoulders on Rural Two-lane Highways
(US Customary)
Roadway Design Manual 3-29 TxDOT 10/2014
Chapter 3 — New Location and Reconstruction (4R)
Design Criteria
Section 4 — Two-Lane Rural Highways
The following notes apply to Table 3-8:
 Minimum width of new or widened structures should accommodate the approach roadway
including shoulders.
 See Table 3-9 for minimum structure widths that may remain in place.
Basic Design Features
This subsection includes information on the following basic design features for two-lane rural
highways:
 Access Control
1
Minimum surfacing width is 7.2 m for all on-system state highway routes.

On high riprapped fills through reservoirs, a minimum of two 3.6 m lanes with 2.4 m shoulders should be
provided for roadway sections. For arterials with 2,000 or more ADT in reservoir areas, two 3.6 m lanes with
3.0 m shoulders should be used.
 On arterials, shoulders fully surfaced.
4
On collectors, use minimum 1.2 m shoulder width at locations where roadside barrier is utilized.
5
For collectors, shoulders fully surfaced for 1,500 or more ADT. Shoulder surfacing not required but desirable
even if partial width for collectors with lower volumes and all local roads.
6 Applicable only to off-system routes that are not functionally classified at a higher classification.
Table 3-9: Minimum Structure Widths For Bridges to Remain in Place on Rural Two-lane Highways
(US Customary)
Functional Class Roadway Clear Width 1 (ft) for ADT of:
- < 400 400-1500 1500-2000 > 2000
Local 20 22 24 28
Collector 22 22 24 28
Arterial Traveled Way + 6 ft
(Metric)
Functional Class Roadway Clear Width 1
(m) for ADT of:
- < 400 400-1500 1500-2000 > 2000
Local 6.0 6.6 7.2 8.4
Collector 6.6 6.6 7.2 8.4
Arterial Traveled Way + 1.8 m
1 Clear width between curbs or rails, whichever is lesser, is considered to be at least the same as approach
roadway clear width. Approach roadway width includes shoulders.
Table 3-8: Width of Travel Lanes and Shoulders on Rural Two-lane Highways
(Metric)
Roadway Design Manual 3-31 TxDOT 10/2014
Chapter 3 — New Location and Reconstruction (4R)
Design Criteria
Section 4 — Two-Lane Rural Highways
Minimum passing sight distance values for design of two-lane highways are shown in 
Table 3-10. These distances are for design purposes only and should not be confused with other dis-
tances used as warrants for striping no-passing zones as shown in the Texas Manual on Uniform
Traffic Control Devices. For the design of typical two-lane rural highways, except for level terrain,
provision of near continuous passing sight distance (2,680 ft at 80 mph [815 m at 130 km/h]) is
impractical. However, the designer should attempt to increase the length and frequency of passing
sections where economically feasible.
Table 3-10: Passing Sight Distance
(US Customary)
K-Values for Determining Length of Crest Vertical Curve for Various Passing Sight Distances
Design Speed (mph) Minimum Passing Sight Distance
for Design (ft)
K-Value1
20 710 180
25 900 289
30 1090 424
35 1280 585
40 1470 772
45 1625 943
50 1835 1203
55 1985 1407
60 2135 1628
65 2285 1865
70 2480 2197
75 2580 2377
80 2680 2565
(Metric)
K-Values for Determining Length of Crest Vertical Curve for Various Passing Sight Distances
Design Speed (km/h) Minimum Passing Sight Distance
for Design (m)
K-Value1
30 200 46
40 270 84
50 345 138
60 410 195
70 485 272
80 540 338
90 615 438
100 670 520
110 730 617
120 775 695
130 815 769
Roadway Design Manual 3-35 TxDOT 10/2014
Chapter 3 — New Location and Reconstruction (4R)
Design Criteria
Section 4 — Two-Lane Rural Highways
Right-Turn Deceleration Lanes. Shoulders 10 ft [3.0 m] wide alongside the traffic lanes generally
provide sufficient area for acceleration or deceleration of right-turning vehicles. Where the right
turn lane is being constructed in addition to the through lanes and shoulders, the minimum right
turn lane width is 10 ft [3.0 m] with a 2 ft [0.6 m] surfaced shoulder. Where speed change lanes are
used, they should be provided symmetrically along both sides of the highway for both directions of
traffic, thus presenting drivers with a balanced section.
A deceleration-acceleration lane on one side of a two-lane highway, such as at a “tee” intersection,
results in the appearance of a three-lane highway and may result in driver confusion. In this regard,
right-turn speed change lanes are generally inappropriate for “tee” intersection design except where
a four lane (2 through, 1 median left turn, 1 right acceleration/deceleration) section is provided.
Table 3-11: Guide for Left-Turn Lanes on Two-Lane Highways
Opposing Volume
(vph) Advancing Volume (vph)
- 5 % Left Turns 10 % Left Turns 20 % Left Turns 30 % Left Turns
40 mph [60 km/h] Design Speed
800 330 240 180 160
600 410 305 225 200
400 510 380 275 245
200 640 470 350 305
100 720 515 390 340
50 mph [80 km/h] Design Speed
800 280 210 165 135
600 350 260 195 170
400 430 320 240 210
200 550 400 300 270
100 615 445 335 295
60 mph [100 km/h] Design Speed
800 230 170 125 115
600 290 210 160 140
400 365 270 200 175
200 450 330 250 215
100 505 370 275 240
Roadway Design Manual 3-37 TxDOT 10/2014
Chapter 3 — New Location and Reconstruction (4R)
Design Criteria
Section 5 — Multi-Lane Rural Highways
Overview
This section includes guidelines on geometric features for multilane rural highways. The guidelines
are outlined in Table 3-12, and Figure 3-6 and Figure 3-7. The guidelines apply for all functional
classes of roadways.
Table 3-12: Design Criteria For Multilane Rural Highways
(Non-controlled Access) (All Functional Classes)
(US Customary)
Type of Facility Six-Lane Divided Four-Lane Divided Four-Lane
Undivided1
Design Speed (Arterials)2
(mph) Min. Min. Min.
Flat 703
703
703
Rolling 604 604 604
Lane Width (ft) 12
- Des. Min. Des. Min. Des. Min
Median Width (ft) Surfaced 16 4 16 4 Not Applicable
- Depressed 76 48 76 48 -
Shoulder Outside (ft) 10 85
10 85
10 85
Shoulder Inside (ft) for Depressed
Medians
10 4 4 4 Not applicable
Min. Structure Widths for
Bridges to Remain in
place (ft)
Depressed
Median
-- 42 -- 30 -- 56
1 Undivided section may be used on two-lane highways to improve passing opportunities. Most appropriate
for use in rolling terrain and/or restricted right of way conditions.
2
For multilane collectors, minimum design speed values are 10 mph less than tabulated.
3
60 mph acceptable for heavy betterment under unusual circumstances. Otherwise, 70 mph should be
minimum.
4 50 mph acceptable for heavy betterment under unusual circumstances. Otherwise, 60 mph should be mini-
mum for rural design.
5
Applies to collector roads only. On four-lane undivided highways, outside surfaced shoulder width may be
decreased to 4 ft where flat (1V:10H), sodded front slopes are provided for a minimum distance of 4 ft from
the shoulder edge.
Roadway Design Manual 3-38 TxDOT 10/2014
Chapter 3 — New Location and Reconstruction (4R)
Design Criteria
Section 5 — Multi-Lane Rural Highways
Table 3-12: Design Criteria For Multilane Rural Highways
(Non-controlled Access) (All Functional Classes)
(Metric)
Type of Facility
-
Six-Lane Divided Four-Lane Divided Four-Lane
Undivided1
Design Speed (Arterials)2
(km/h) Min. Min. Min.
Flat 1103
1103
1103
Rolling 1004 1004 1004
Lane Width (m) 3.6
- Des. Min. Des. Min. Des. Min.
-
Median Width (m)
Surfaced 4.8 1.2 4.8 1.2 Not applicable
- Depressed
-
22.8 14.4 22.8 14.4 -
Shoulder Outside (m) 3.0 2.45
3.0 2.45
3.0 2.45
Shoulder Inside (m) for Depressed
Medians
3.0 1.2 1.2 1.2 Not applicable
Min. Structure Widths for
Bridges to Remain in
place (m)
Depressed
Median
-- 12.6 -- 9.0 -- 16.8
1
Undivided section may be used on two-lane highways to improve passing opportunities. Most appropriate
for use in rolling terrain and/or restricted right of way conditions.
2
For multilane collectors, minimum design speed values are 20 km/h less than tabulated.
3 100 km/h acceptable for heavy betterment under unusual circumstances. Otherwise, 110 km/h should be
minimum.
4
80 km/h acceptable for heavy betterment under unusual circumstances. Otherwise, 100 km/h should be min-
imum for rural design.
5 Applies to collector roads only. On four-lane undivided highways, outside surfaced shoulder width may be
decreased to 1.2 m where flat (1V:10H), sodded front slopes are provided for a minimum distance of 1.2 m
from the shoulder edge.
Roadway Design Manual 3-44 TxDOT 10/2014
Chapter 3 — New Location and Reconstruction (4R)
Design Criteria
Section 5 — Multi-Lane Rural Highways
may be acceptable on some low volume rural highways. Also adjustments for grade are given in
Table 3-14.
Right Turn Deceleration Lane. Right (12 ft [3.6 m] lane with 4 ft [1.2 m] adjacent shoulders) turn
lanes provide deceleration or acceleration area for right-turning vehicles. The deceleration length
and taper lengths for right turn lanes are the same as for left-turn lanes (See Table 3-13). Adjust-
ment factors for grade effects are shown in Table 3-14.
Table 3-13: Lengths of Median Turn Lanes Multilane Rural Highways
(US Customary)
Mainlane Design
Speed (mph)
Taper Length
(ft)1
Deceleration
Length (ft)2
- Design Turning
ADT (vpd)
Minimum Storage
Length (ft)
30 50 160 - 150 50
35 50 215 - 300 100
40 50 275 - 500 175
45 100 345 - 750 250
50 100 425 - -- --
55 100 510 - -- --
60 150 615 - -- --
65 150 715 - -- --
70 150 830 - -- --
75 150 950 - -- --
80 150 1075 - -- --
(Metric)
Mainlane Design
Speed (km/h)
Taper Length
(m)1
Deceleration
Length (m)2
- Design Turning
ADT (vpd)
Minimum Storage
Length (m)
50 15 50 - 150 15
60 15 65 - 300 30
70 30 85 - 500 50
80 30 105 - 750 75
90 30 130 - - -
100 45 200 - - -
110 45 240 - - -
120 45 290 - - -
130 45 330 - - -
1
For low volume median openings, such as those serving private drives or U-turns, a taper length of 100 ft [30
m] may be used regardless of mainlane design speed.
2
Deceleration length assumes that moderate deceleration will occur in the through traffic lane and the vehicle
entering the left-turn lane will clear the through traffic lane at a speed of 10 mph (15 km/h) slower than
through traffic. Where providing this deceleration length is impractical, it may be acceptable to allow turning
vehicles to decelerate more than 10 mph (15km/h) before clearing the through traffic lane.
Roadway Design Manual 3-45 TxDOT 10/2014
Chapter 3 — New Location and Reconstruction (4R)
Design Criteria
Section 5 — Multi-Lane Rural Highways
Acceleration Lanes. Acceleration lanes for right-turning and/or left-turning vehicles may be desir-
able on multi-lane rural highways. Acceleration distances and taper lengths are provided in Figure
3-10. Adjustments for grade are given in Table 3-14.
Figure 3-10. (US). Lengths of Right-Turn Acceleration Lanes. Click US Customary or Metric to
see a PDF of the image.
Table 3-14: Speed Change Lane Adjustment Factors as a Function of a Grade
(US Customary)
Deceleration Lanes
- Ratio of Length on Grade to Length on Level*
Design
Speed of
Roadway
(mph)
3 to 4 % Upgrade 3 to 4 % Downgrade 5 to 6% Upgrade 5 to 6% Downgrade
All 0.9 1.2 0.8 1.35
- Acceleration Lanes
- Ratio of Length on Grade to Length for Design Speed (mph) of Turning Roadway Curve*
Roadway Design Manual 3-46 TxDOT 10/2014
Chapter 3 — New Location and Reconstruction (4R)
Design Criteria
Section 5 — Multi-Lane Rural Highways
Design
Speed of
Roadway
(mph)
20 25 30 35 40 45 50 All Speeds
- 3 to 4 % Upgrade 3 to 4%
Downgrade
30 ---- ---- ---- ---- ---- ---- ---- ----
35 ---- ---- ---- ---- ---- ---- ---- 0.7
40 1.3 1.3 1.3 1.3 ---- ---- ---- 0.7
45 1.3 1.3 1.35 1.35 ---- ---- ---- 0.675
50 1.3 1.35 1.4 1.4 1.4 ---- ---- 0.65
55 1.35 1.4 1.45 1.45 1.45 1.45 ---- 0.625
60 1.4 1.45 1.5 1.5 1.5 1.51.55 1.6 0.6
65 1.45 1.5 1.55 1.55 1.6 1..65 1.7 0.6
70 1.5 1.55 1.6 1.65 1.7 1.75 1.8 0.6
75 1.55 1.6 1.65 1.7 1.75 1.8 1.9 0.6
80 1.6 1.65 1.7 1.75 1.8 1.9 2.0 0.6
- 5 to 6% Upgrade 5 to 6%
Downgrade
30 ---- ---- ---- ---- ---- ---- ---- ----
35 ---- ---- ---- ---- ---- ---- ---- 0.6
40 1.5 1.5 1.5 1.6 ---- ---- ---- 0.6
45 1.5 1.55 1.6 1.6 ---- ---- ---- 0.575
50 1.5 1.6 1.7 1.8 1.9 2.0 ---- 0.55
55 1.6 1.7 1.8 1.9 2.05 2.1 ---- 0.525
60 1.7 1.8 1.9 2.05 2.2 2.4 2.5 0.5
65 1.85 1.95 2.05 2.2 2.4 2.6 2.75 0.5
70 2.0 2.1 2.2 2.4 2.6 2.8 3.0 0.5
75 2.2 2.3 2.4 2.65 2.9 3.2 3.5 0.5
80 2.4 2.5 2.6 2.9 2.9 3.6 4.0 0.5
*Ratio in this table multiplied by length of deceleration or acceleration distances in Table 3-13 and Figure 3-
10, gives length of deceleration/acceleration distance on grade.
Table 3-14: Speed Change Lane Adjustment Factors as a Function of a Grade
(Metric)
Deceleration Lanes
- Ration of Length on Grade to Length on Level*
Design
Speed of
Roadway
(mph)
3 to 4 % Upgrade 3 to 4 % Downgrade 5 to 6% Upgrade 5 to 6% Downgrade
Table 3-14: Speed Change Lane Adjustment Factors as a Function of a Grade
(US Customary)
Roadway Design Manual 3-47 TxDOT 10/2014
Chapter 3 — New Location and Reconstruction (4R)
Design Criteria
Section 5 — Multi-Lane Rural Highways
Travel Lanes and Shoulders
Travel Lanes. Travel lanes should be 12 ft [3.6 m] minimum width on rural multilane highways.
The Highway Capacity Manual should be consulted to determine the number of lanes to be used in
the design.
Shoulders. Shoulders should be provided with widths as shown in Table 3-12: Design Criteria For
Multilane Rural Highways (Non-controlled Access) (All Functional Classes).
All 0.9 1.2 0.8 1.35
- Acceleration Lanes
- Ratio of Length on Grade to Length for Design Speed (km/h of Turning Roadway Curve)*
Design
Speed of
Roadway
(km/h)
40 50 60 70 80 All Speeds
- 3 to 4 % Upgrade 3 to 4%
Downgrade
50 ---- ---- ---- ---- ---- ----
60 1.3 1.4 1.4 ---- ---- 0.7
70 1.3 1.4 1.4 1.5 ---- 0.65
80 1.4 1.5 1.5 1.5 1.6 0.65
90 1.4 1.5 1.5 1.5 1.6 0.6
100 1.5 1.6 1.7 1.7 1.8 0.6
110 1.5 1.6 1.7 1.7 1.8 0.6
120 1.5 1.6 1.7 1.7 1.8 0.6
130 1.5 1.6 1.7 1.7 1.8 0.6
- 5 to 6% Upgrade 5 to 6%
Downgrade
50 ---- ---- ---- ---- ---- ----
60 1.5 1.5 ---- ---- ---- 0.6
70 1.5 1.6 1.7 ---- ---- 0.6
80 1.5 1.7 1.9 1.8 ---- 0.55
90 1.6 1.8 2.0 2.1 2.2 0.55
100 1.7 1.9 2.2 2.4 2.5 0.5
110 2.0 2.2 2.6 2.8 3.0 0.5
120 2.3 2.5 3.0 3.2 3.5 0.5
130 2.6 2.8 3.4 3.6 4.0 0.5
*Ratio in this table multiplied by length of deceleration or acceleration distances in Table 3-13 and Figure 3-
10, gives length of deceleration/acceleration distance on grade.
Table 3-14: Speed Change Lane Adjustment Factors as a Function of a Grade
(Metric)
Roadway Design Manual 3-57 TxDOT 10/2014
Chapter 3 — New Location and Reconstruction (4R)
Design Criteria
Section 6 — Freeways
Table 3-16 shows the spacing to be used between exit ramps and driveways, side streets, or cross
streets if practical. The number of weaving lanes is defined as the total number of lanes on the
frontage road downstream from the ramp.
Driveway or side street access on the frontage road in close downstream proximity to exit ramp ter-
minals increases the weaving that occurs on the frontage road and may lead to operational
problems. For this reason, it is important to maintain appropriate separation between the intersec-
tion of the exit ramp and frontage road travel lanes, and downstream driveways or side streets
where practical.
It is recognized that there are occasions when meeting these exit ramp separation distance values
may not be possible due to the nature of the existing development, such as a high number of closely
spaced driveways and/or side streets especially when in combination with closely spaced inter-
changes. In these cases, at least 250 ft [75 m] of separation should be provided between the
intersection of the exit ramp and frontage road travel lanes and the downstream driveway or side
street. Since the use of only 250 ft [75 m] of separation distance may negatively impact the opera-
tion of the frontage road, exit ramp, driveway and/or side street traffic, careful consideration should
be given to its use. When the 250 ft [75 m] separation distance cannot be obtained, consideration
should be given to channelization methods that would restrict access to driveways within this 250 ft
[75 m] distance. Refer to the Texas MUTCD for specific types of channelization.
There will be similar occasions when meeting the entrance ramp separation distance values may
not be possible due to the same existing development conditions associated with exit ramps. In
these cases, at least 100 ft [30 m] of separation distance should be provided between the intersec-
tion of the entrance ramp and frontage road travel lanes and the upstream driveway or side street.
Table 3-16: Desirable Spacing between Exit Ramps and Driveways, Side Streets, or Cross Streets
Total Volume
(Frtg rd +Ramp)
(vph)
Driveway or Side
Street Volume
(vph)
Spacing
(ft [m])
-- -- Number of Weaving Lanes
-- -- 2 3 4
< 2500 < 250 460 [140] 460 [140] 560 [170]
-- > 250 520 [160] 460 [140] 560 [170]
-- > 750 790 [240] 460 [140] 560 [170]
-- > 1000 1000 [300] 460 [140] 560 [170]
> 2500 < 250 920 [280] 460 [140] 560 [170]
-- > 250 950 [290] 460 [140] 560 [170]
-- > 750 1000 [300] 600 [180] 690 [210]
-- > 1000 1000 [300] 1000 [300] 1000 [300]
Roadway Design Manual 3-64 TxDOT 10/2014
Chapter 3 — New Location and Reconstruction (4R)
Design Criteria
Section 6 — Freeways
Figure 3-16. Typical Highway Railway Railroad Overpass. Click here to see a PDF of the image.
Horizontal. The minimum horizontal clearance to bridge parapets and piers should be as shown in
Table 2-11: Horizontal Clearances and Figure 3-12.
Table 3-18: Roadway Widths for Controlled Access Facilities
(US Customary)
Type of Roadway Inside Shoulder Width
(ft)
Outside Shoulder Width2
(ft)
Traffic Lanes
(ft)
Mainlanes: - - -
4-Lane Divided 4 10 24
6-Lane or more Divided 10 10 361
1-Lane Direct Conn.2 2 Rdwy.; 4 Str. 8 14
2-Lane Direct Conn. 2 Rdwy.; 4 Str. 8 24
Ramps2
(uncurbed) 2 Rdwy.; 4 Str. Min. Des. 14
- - 6 8 -
Ramps3
(curbed) — — 22
(Metric)
Roadway Design Manual 3-65 TxDOT 10/2014
Chapter 3 — New Location and Reconstruction (4R)
Design Criteria
Section 6 — Freeways
Frontage Roads
This subsection discusses frontage roads and includes information on the following topics:
 Function and Uses
 Planning
 Design Speed on Frontage Roads
 Capacity and Level of Service
Function and Uses
Frontage roads serve a multitude of purposes in addition to controlling or providing access. Urban
frontage roads are multi-functional. They reduce the “barrier” effect of urban freeways since they
provide for some of the circulation of the local street system. They provide invaluable operational
flexibility, serving as detour routes when mainlane accidents occur, during mainlane maintenance
activity, for over-height loads, as bus routes, or during inclement weather. For freeways that include
freeway surveillance and control, continuous frontage roads provide the operational flexibility
required to manage saturation.
Type of Roadway Inside Shoulder Width
(m)
Outside Shoulder Width2
(m)
Traffic Lanes
(m)
Mainlanes: - - -
4-Lane Divided 1.2 3.0 7.2
6-Lane or more Divided 3.0 3.0 10.81
1-Lane Direct Conn.2 0.6 Rdwy.; 1.2 Str. 2.4 4.2
2-Lane Direct Conn. 0.6 Rdwy.; 1.2 Str. 2.4 7.2
Ramps2 (uncurbed) 0.6 Rdwy.; 1.2 Str. Min. Des. 4.2
- - 1.8 2.4 -
Ramps3
(curbed) — — 6.6
1 For more than six lanes, add 12 ft [3.6 m] width per lane.
2
If sight distance restrictions are present due to horizontal curvature, the shoulder width on the inside of the
curve may be increased to 8 ft [2.4 m] and the shoulder width on the outside of the curve decreased to 2 ft [0.6
m] (Rdwy) or 4 ft [1.2 m] (Str).
3
The curb for a ramp lane will be mountable and limited to 4 inches [100 mm] or less in height. The width of
the curbed ramp lane is measured face to face of curb. Existing curb ramp lane widths of 19 ft [5.7 m] may be
retained.
Table 3-18: Roadway Widths for Controlled Access Facilities
(US Customary)
Roadway Design Manual 3-67 TxDOT 10/2014
Chapter 3 — New Location and Reconstruction (4R)
Design Criteria
Section 6 — Freeways
Capacity and Level of Service
Although techniques to estimate capacity and level of service on freeways and urban arterials are
detailed in the Highway Capacity Manual, these procedures should not be applied directly to front-
age roads, as frontage roads have features characteristic of both freeways (i.e., exit and entrance
ramps) and urban arterials (i.e., driveways, cross streets and signalized intersections). The follow-
ing report was developed to suggest techniques for estimating capacity and level of service on
frontage roads.
Kay Fitzpatrick, R. Lewis Nowlin, and Angelia H. Parham. Procedures to Determine Frontage
Road Level of Service and Ramp Spacing. Research Report 1393-4F, Texas Department of Trans-
portation, Texas Transportation Institute, 1996.
Research Report 1393-4F contains procedures for the following:
 determining level of service on a continuous frontage road section
 analyzing frontage road weaving sections
 determining spacing requirements for ramp junctions.
Frontage Road Design Criteria
Design criteria for urban frontage roads are shown in Table 3-1: Geometric Design Criteria for
Urban Streets using the collector criteria. Design criteria for suburban frontage roads are shown in
Table 3-5: Geometric Design Criteria for Suburban Roadways using the collector criteria. Design
criteria for rural frontage roads are shown in Table 3-19: Design Criteria for Rural Frontage Roads.
Horizontal clearances are given in Table 2-11: Horizontal Clearances.
Any frontage road constructed will be designed to provide one-way operation initially. There may
be exceptions in certain isolated instances; however, such exceptions will be considered only
where, due to extraordinary circumstances, a one-way pattern would impose severe restrictions on
circulation within an area. In those cases where such exceptions are considered, they must be
approved by the Design Division at the schematic stage.
Table 3-19: Design Criteria for Rural Frontage Roads
(US Customary)
Design Speed2 (mph) Min. Width1 for Future Traffic Volume of
- 0-400 ADT 400-1,500 ADT 1,500-2,000 ADT 2,000 or more ADT
LANES (ft)
20 10 10 11 12
25 10 10 11 12
30 10 10 11 12
35 10 10 11 12
40 10 11 11 12
Roadway Design Manual 3-68 TxDOT 10/2014
Chapter 3 — New Location and Reconstruction (4R)
Design Criteria
Section 6 — Freeways
45 10 11 11 12
50 10 11 12 12
55 10 11 12 12
60 11 11 12 12
65 11 11 12 12
70 11 11 12 12
75 11 12 12 12
80 11 12 12 12
SHOULDERS (ft)4
Each Shoulder
Two-Way Operation
23
4 8 8 – 10
Inside Shoulder
One-Way Operation
23
23
4 44
Outside Shoulder
One-Way Operation
23 4 8 8 – 10
1
May retain existing paved width on a reconstruction project if total paved width is 24 ft and operating
satisfactorily.
2
Use rural collector criteria (Table 3-6) for determining minimum design speed.
3At locations where roadside barriers are provided, use minimum 4 ft offset from travel lane edge to barrier
face.
4
If the one-way frontage road section contains three or more travel lanes, then minimum inside shoulder width
is 8 – 10 ft.
Table 3-19: Design Criteria for Rural Frontage Roads
(Metric)
Design Speed2
(km/h) Min. Width1
for Future Traffic Volume of
- 0-400 ADT 400-1,500 ADT 1,500-2,000 ADT 2,000 or more ADT
LANES (m)
30 3.0 3.0 3.3 3.6
40 3.0 3.0 3.3 3.6
50 3.0 3.0 3.3 3.6
60 3.0 3.3 3.3 3.6
70 3.0 3.3 3.3 3.6
80 3.0 3.3 3.6 3.6
90 3.0 3.3 3.6 3.6
Table 3-19: Design Criteria for Rural Frontage Roads
(US Customary)
Roadway Design Manual 3-69 TxDOT 10/2014
Chapter 3 — New Location and Reconstruction (4R)
Design Criteria
Section 6 — Freeways
Conversion of Frontage Roads from Two-Way to One-Way Operation
Existing frontage roads in some areas are currently operating as two-way facilities. Such two-way
operation has the following disadvantages:
 Higher crash rates are normally experienced when the frontage roads are two-way. In large
part, this is because of the risk of essentially head-on collisions at the ramp terminals.
 Increased potential for wrong-way entry to the mainlanes.
 The intersections of the frontage roads with the arterials are much more complicated. Left
turns from the arterial onto the frontage road must be accommodated from both directions.
Accordingly, the signal phasing and sequencing options normally available at signalized dia-
mond interchanges cannot be used.
 The overall traffic-carrying capacity of the frontage roads is substantially less than if the same
facility were re-striped for one-way operation.
Existing two-way frontage roads should be converted to one-way operation when one or more
of the following conditions occur.
100 3.3 3.3 3.6 3.6
110 3.3 3.3 3.6 3.6
120 3.3 3.6 3.6 3.6
130 3.3 3.6 3.6 3.6
SHOULDERS (m)4
Each Shoulder
Two-Way Operation
0.63
1.2 2.4 2.4 – 3.0
Inside Shoulder
One-Way Operation
0.63 0.63 1.2 1.24
Outside Shoulder
One-Way Operation
0.63
1.2 2.4 2.4 – 3.0
1
May retain existing paved width on a reconstruction project if total paved width is 7.2 m and operating
satisfactorily.
2
Use rural collector criteria (Table 3-6) for determining minimum design speed.
3At locations where roadside barriers are provided, use minimum 1.2 m offset from travel lane edge to barrier
face.
4
If the one-way frontage road section contains three or more travel lanes, then minimum inside shoulder width
is 2.4 – 3.0 m.
Table 3-19: Design Criteria for Rural Frontage Roads
(Metric)
Roadway Design Manual 3-90 TxDOT 10/2014
Chapter 3 — New Location and Reconstruction (4R)
Design Criteria
Section 6 — Freeways
Design Speed
There should be a definite relationship between the design speed on a ramp or direct connection
and the design speed on the intersecting highway or frontage road. All ramps and connections
should be designed to enable vehicles to leave and enter the traveled way of the freeway at no less
than 50 percent (70 percent usual, 85 percent desirable) of the freeway’s design speed. Table 3-20
shows guide values for ramp/connection design speed. The design speed for a ramp should not be
less than the design speed on the intersecting frontage roads. AASHTO’s A Policy on Geometric
Design of Highways and Streets provides additional guidance on the application of the ranges of
ramp design speed shown in Table 3-20:
Horizontal Geometrics
Lane and shoulder widths for ramps and direct connections are shown in Table 3-18.
Figure 3-36 provides design criteria for entrance and exit ramp acceleration, deceleration, and taper
lengths; adjustment factors for grade effects are shown in Table 3-14: Speed Change Lane Adjust-
ment Factors as a Function of a Grade
Table 3-20: Guide Values for Ramp/Connection Design Speed as Related to Highway Design Speed*
(US Customary)
Highway Design Speed (mph) 30 35 40 45 50 55 60 65 70 75 80
Ramp** Design Speed (mph): -
Upper Range (85%) 25 30 35 40 45 48 50 55 60 65 70
Mid Range (70%) 20 25 30 33 35 40 45 45 50 55 60
Lower Range (50%) 15 18 20 23 25 28 30 30 35 40 45
(Metric)
Highway Design Speed (km/h) 50 60 70 80 90 100 110 120 130
Ramp** Design Speed (km/h): -
Upper Range (85%) 40 50 60 70 80 90 100 110 120
Mid Range (70%) 30 40 50 60 60 70 80 90 100
Lower Range (50%) 20 30 40 40 50 50 60 70 80
* For corresponding minimum radius, see Table 2-6.
**Loops: Upper and middle range values of design speed generally do not apply. The design speed on a loop
should be no less than 25 mph [40 km/h] (185 ft [55 m] minimum radius) based on an emax of 6%. Particular
attention should be given to controlling superelevation on loops due to the tight turning radii and speed
limitations.
Roadway Design Manual 3-91 TxDOT 10/2014
Chapter 3 — New Location and Reconstruction (4R)
Design Criteria
Section 6 — Freeways
Exit and entrance ramp typical details are shown in Figure 3-23, Figure 3-24, Figure 3-25, Figure
3-26, Figure 3-27, Figure 3-28, and Figure 3-29.
Channelized (braided) entrance and exit ramps, as typified in Figure 3-28, should be used only
where ramp volumes are considerably greater than frontage road traffic such as where stub frontage
roads occur. Where used, the exit ramp desirably should cross the frontage road at approximately
90 degrees to minimize wrong-way entry. Passing should be restricted between the crossroad and
the channelized area.
Figure 3-36. (US). Lengths of Exit and Entrance Ramp Speed Change Lanes. Click US Customary
or Metric to see a PDF of the image.
Distance Between Successive Ramps
The minimum acceptable distance between ramps is dependent upon the merge, diverge and weav-
ing operations that take place between ramps as well as distances required for signing. For analysis
Roadway Design Manual 3-92 TxDOT 10/2014
Chapter 3 — New Location and Reconstruction (4R)
Design Criteria
Section 6 — Freeways
of these requirements, see the Highway Capacity Manual. Figure 3-37 shows minimum distances
between ramps for various ramp configurations.
Figure 3-37. Arrangements For Successive Ramps. Click here to see a PDF of the image.
Cross Section and Cross Slopes
Superelevation rates, as related to curvature and design speed of the ramp or direct connector, are
given in Table 3-21. While connecting roadways represent highly variable conditions, as high a
superelevation rate as practicable should be used, preferably in the upper half or third of the indi-
cated range, particularly in descending grades. Superelevation rates above 8% are shown in Table
3-21 only to indicate the limits of the range. Superelevation rates above 8% are not recommended
and a larger radius is preferable.
Table 3-21: Superelevation Range for Curves on Connecting Roadways
(US Customary)
Radius (ft) Range in Superelevation Rate (percent) For Connecting Roadways With Design Speed,
mph, of:
- 20 25 30 35 40 45
90 2-10 - - - - -
150 2-8 4-10 - - - -
230 2-6 3-8 6-10 - - -
Roadway Design Manual 3-93 TxDOT 10/2014
Chapter 3 — New Location and Reconstruction (4R)
Design Criteria
Section 6 — Freeways
The cross slope on portions of connecting roadways or ramps on tangent normally is sloped one
way at a practical rate of 1.5% to 2%.
The change in pavement edge elevation per given length of connecting roadway or ramp should be
that as shown in Table 2-8: Maximum Relative Gradient for Superelevation Transition. The maxi-
310 2-5 3-6 5-9 8-10 - -
430 2-4 3-5 4-7 6-9 9-10 -
540 2-3 3-5 4-6 6-8 8-10 10-10
600 2-3 2-4 3-5 5-7 7-9 8-10
1000 2 2-3 3-4 4-5 5-6 7-9
1500 2 2 2-3 3-4 4-5 5-6
2000 2 2 2 2-3 3-4 4-5
3000 2 2 2 2 2-3 3-4
* See Tables 2-6 and 2-7 for design speeds greater than 45 mph.
(Metric)
Radius (m) Range in Superelevation Rate (percent) For Connecting Roadways With Design Speed, km/
h, of:
- 20 30 40 50 60 70
15 2-10 - - - - -
25 2-9 2-10 - - - -
50 2-8 2-8 4-10 - - -
80 2-6 2-6 3-8 6-10 - -
100 2-5 2-4 3-6 5-8 - -
115 2-3 2-4 3-6 5-8 8-10 -
150 2-3 2-3 3-5 4-7 6-8 -
160 2-3 2-3 3-5 4-7 6-8 10-10
200 2 2-3 2-4 3-5 5-7 6-8
300 2 2-3 2-3 3-4 4-5 5-7
500 2 2 2 2-3 3-4 4-5
700 2 2 2 2 2-3 3-4
1000 2 2 2 2 2 2-3
* See Tables 2-6 and 2-7 for design speeds greater than 70 km/h.
Table 3-21: Superelevation Range for Curves on Connecting Roadways
(US Customary)
Roadway Design Manual 3-94 TxDOT 10/2014
Chapter 3 — New Location and Reconstruction (4R)
Design Criteria
Section 6 — Freeways
mum algebraic difference in pavement cross slope at connecting roadways or ramps should not
exceed that set forth in Table 3-22:
The cross section of a ramp or direct connector is a function of the following variables:
 number of lanes determined by traffic volume
 minimum lane and shoulder width
 lane balance
 where two lanes are required by volume, the provision of parallel merging two lanes onto the
mainlanes must be provided at the terminal
Sight Distance
On all ramps and direct connections, the combination of grade, vertical curves, alignments and
clearance of lateral and corner obstructions to vision shall be such as to provide sight distance along
such ramps and connections from terminal junctions along the freeway, consistent with the proba-
ble speeds of vehicle operation. Sight distance and sight lines are especially important at merge
points for ramps and mainlanes or between individual ramps. Table 2-1: Stopping Sight Distance
shows recommended stopping sight distances for ramps and direct connections.
The sight distance on a freeway preceding the approach nose of an exit ramp should exceed the
minimum stopping sight distance for the freeway design speed, preferably by 25 percent or more.
Decision sight distance, as discussed in Decision Sight Distance in Chapter 2, is a desirable goal.
Table 3-22: Maximum Algebraic Differences in Pavement Cross Slope
at Connecting Roadway Terminals
(US Customary) (Metric)
Design Speed of Exit or
Entrance Curve
(mph)
Maximum Algebraic Dif-
ference in Cross Slope at
Crossover Line
(%)
Design Speed of Exit or
Entrance Curve
(km/h)
Maximum Algebraic Dif-
ference in Cross Slope at
Crossover Line
(%)
Less than or equal to 20 5.0 to 8.0 Less than or equal to 30 5.0 to 8.0
25 to 30 5.0 to 6.0 40 to 50 5.0 to 6.0
Greater than or equal to
35
4.0 to 5.0 Greater than or equal to
60
4.0 to 5.0
Roadway Design Manual 4-4 TxDOT 10/2014
Chapter 4 — Non-Freeway Rehabilitation (3R)
Design Criteria
Section 2 — Design Characteristics
NOTE: Online users can view the metric version of this table in PDF format.









Table 4-1: 3R Design Guidelines for Rural Multilane Highways (Nonfreeway)a
(US Customary)
Design Element Highway Class
- 6-Lane Divided 4-Lane Divided 4-Lane Undivided
Design Speedb
50 mph 50 mph 50 mph
Lane Width 11 ft 11 ft 11 ft
Outside Shoulder 4 ft 4 ft 4 ft
Inside Shoulder 4 ft 2 ft N/A
Turn Lane Widthc 10 ft 10 ft N/A
Horizontal Clearance 16 ft 16 ft 16 ft
Bridgesd
: Width to be retained 42 ft 28 ft 52 ft
a
These values are intended for use on rehabilitation projects. However, the designer may select higher values
to provide consistency with adjoining roadway sections, to provide consistency with prevailing conditions on
similar roadways in the area or to provide operational improvements at specific locations.
b
Considerations in selecting design speeds for the project should include the roadway alignment characteris-
tics as discussed in this chapter.
c For two-way left turn lanes, 11 ft – 14 ft usual.
d
Where structures are to be modified, bridges should meet approach roadway width as a minimum.
(Approach roadway width is the total width of the lanes and shoulders.) Greater bridge widths may be appro-
priate if the rehabilitation project increases roadway life significantly or if higher design values are selected
for the remainder of the project. Existing structure widths less than those shown may be retained if the total
lane width is not reduced across or in the vicinity of the structure.
Roadway Design Manual 4-5 TxDOT 10/2014
Chapter 4 — Non-Freeway Rehabilitation (3R)
Design Criteria
Section 2 — Design Characteristics

NOTE: Online users can view the metric version of this table in PDF format.






Table 4-2: 3R Design Guidelines for Rural Two-Lane Highwaysa
(US Customary)
Design Element Current Average Daily Traffic
- 0 – 400 400 -1500 1500 or more
Design Speedb
30 mph 30 mph 40 mph
Shoulder Width 0 ft 1 ft 3 ft
Lane Width 10 ft 11 ft 11 ft
Surfaced Roadway 20 ft 24 ft 28 ft
Turn Lane Widthc 10 ft 10 ft 10 ft
Horizontal Clearance 7 ft 7 ft 16 ft
Bridgesd: Width to be retained 20 ft 24 ft 24 fte
a
These values are intended for use on rehabilitation projects. However, the designer may select higher values
to provide consistency with adjoining roadway sections, to provide consistency with prevailing conditions on
similar roadways in the area or to provide operational improvements at specific locations.
b
Considerations in selecting design speeds for the project should include the roadway alignment characteris-
tics as discussed in this chapter.
c For two-way left turn lanes, 11 ft – 14 ft usual.
d
Where structures are to be modified, bridges should meet approach roadway width as a minimum.
(Approach roadway width is the total width of the lanes and shoulders.) Greater bridge widths may be appro-
priate if the rehabilitation project increases roadway life significantly or if higher design values are selected
for the remainder of the project. Existing structure widths less than those shown may be retained if the total
lane width is not reduced across or in the vicinity of the structure.
e
For current ADT exceeding 2000, minimum width of bridge to be retained is 28 ft.
Roadway Design Manual 4-6 TxDOT 10/2014
Chapter 4 — Non-Freeway Rehabilitation (3R)
Design Criteria
Section 2 — Design Characteristics
NOTE: Online users can view the metric version of this table in PDF format.
Design Values
Where the existing highway features comply with the design values given in this chapter, the
designer may choose not to modify these features. However, where the existing features do not
meet these values, upgrading should be to the values shown in this chapter. These values are
intended for use on typical rehabilitation projects. The designer may select higher values to provide
consistency with adjoining roadway sections, to provide consistency with prevailing conditions on
similar roadways in the area or to provide operational improvements at specific locations.
Alignment
Typically, 3R projects will involve minor or no change in either vertical or horizontal alignment.
However, flattening of curves or other improvements may be considered where suggested by acci-
dent history, or where existing curvature is inconsistent with prevailing conditions within the
Table 4-3: 3R Design Guidelines for Urban Streetsa All Functional Classes
(US Customary)
Design Element Guideline
Design Speedb
30 mph
Lane Width 10 ft
Turn Lane Widthc 10 ft
Parallel Parking Lane Width 7 ft
Curb Offset 0 ft
Shouldersd,e 2 ft
Horizontal Clearance To back of curb or outside edge of shoulder
Bridges: Width to be retained Approach roadway, not including shoulders
a
These values are intended for use on rehabilitation projects. However, the designer may select higher values
to provide consistency with adjoining roadway sections, to provide consistency with prevailing conditions on
similar roadways in the area or to provide operational improvements at specific locations.
b
Considerations in selecting design speeds for the project should include the roadway alignment characteris-
tics as discussed in this chapter.
c For two-way left turn lanes, 11 ft – 14 ft usual.
d
Minimally 1 ft of shoulder surfaced where lane width is 10 ft thereby providing a 22 ft
surfacing width.
e Applicable to uncurbed streets.
Roadway Design Manual 4-12 TxDOT 10/2014
Chapter 4 — Non-Freeway Rehabilitation (3R)
Design Criteria
Section 4 — Frontage Roads
Overview
Table 4-4: 3R Design Guidelines for Rural Frontage Roads and Table 4-5: 3R Design Guidelines
for Urban Frontage Roads show geometric design guidelines for 3R projects on rural and urban
freeway frontage roads. These guidelines are acceptable for those projects involving either rehabil-
itation of only the frontage road or rehabilitation of the frontage road in conjunction with
rehabilitation of the freeway mainlanes. It is not the intent of these 3R frontage road design guide-
lines to be used when a freeway section is reconstructed from right of way line to right of way line
even though no additional frontage road lanes are added. Complete frontage road reconstruction
projects should reference the applicable reconstruction guidelines for the appropriate criteria.
Frontage roads are built in some locations initially in a phased construction sequence with the
mainlanes to be built when traffic conditions warrant. If the frontage road is serving as the principal
roadway pending future mainlane construction, the 3R design guidelines for rural multilane high-
ways would be applicable for rehabilitation work on these facilities.
Table 4-4: 3R Design Guidelines for Rural Frontage Roadsa
(US Customary)
Design Element Current Average Daily Traffic
- 0 - 1500 1500 or more
Design Speed 30 mph 40 mph
Lane Width 10 ft 11 ft
Shoulder Width
Two-Way Operation
1 ft 3 ft
Inside Shoulder Width
One-Way Operation
1 ft 2 ft
Outside Shoulder Width
One-Way Operation
1 ft 4 ft
Horizontal Clearance 7 ft 16 ft
Bridgesb
: Width to be retained 22 ft 24 ftc
Roadway Design Manual 4-13 TxDOT 10/2014
Chapter 4 — Non-Freeway Rehabilitation (3R)
Design Criteria
Section 4 — Frontage Roads
NOTE: Online users can view the metric version of this table in PDF format.
a These values are intended for use on rehabilitation projects. However, the designer may select higher values
to provide consistency with adjoining roadway sections, to provide consistency with prevailing conditions on
similar roadways in the area, or to provide operational improvements at specific locations.
b
Where structures are to be modified, bridges should meet approach roadway width as a minimum.
(Approach roadway width is the total width of the lanes and shoulders.) Greater bridge widths may be appro-
priate if the rehabilitation project increases roadway life significantly or if higher design values are selected
for the remainder of the project. Existing structure widths less than those shown may be retained if the total
lane width is not reduced across or in the vicinity of the structure.
c
For current ADT exceeding 2000, minimum width of bridge to be retained is 28 ft.
Table 4-5: 3R Design Guidelines for Urban Frontage Roadsa
(US Customary)
Design Element All Traffic Volumes
Design Speed 30 mph
Lane Width 10 ft
Shoulder Width 0 ft inside
2 ft outside
Horizontal Clearance Back of curb or edge of shoulder
Curb Offset 1 ft either side
Bridges: Width to be retained Approach roadway not including shoulders
a These values are intended for use on rehabilitation projects. However, the designer may select higher values
to provide consistency with adjoining roadway sections, to provide consistency with prevailing conditions on
similar roadways in the area, or to provide operational improvements at specific locations.
Table 4-4: 3R Design Guidelines for Rural Frontage Roadsa
(US Customary)
Roadway Design Manual 4-16 TxDOT 10/2014
Chapter 4 — Non-Freeway Rehabilitation (3R)
Design Criteria
Section 6 — Super 2 Highways
Basic Design Criteria
Recommended design values are shown in Table 4-6.
The length for opening a passing lane (Figure 4-1) should be based on the following:
L = WS/2,
Where
L = Length of taper,
W = Lane width, and
S = Posted speed.
The taper length for closing a passing lane (Figure 4-1) should be based on:
L = WS,
Where
L = Length of taper,
W = Lane width, and
S = Posted speed.
Table 4-6: Design Criteria
Minimum Desirable
Design Speed See Table 4-2
Horizontal Clearance See Table 4-2
Lane Width 11 ft 12 ft
Shoulder Width 3 fta 8 - 10 ft
Passing Lane Length 1 mi 1.5 - 2 mib
a.
Where ROW is limited
b. Longer passing lanes are acceptable, but not recommended more than 4 miles. Consider switching the direction if
more than 4 miles.
Roadway Design Manual 7-5 TxDOT 10/2014
Chapter 7 — Miscellaneous Design Elements Section 2 — Fencing
Section 2 — Fencing
Right-of-way
The procedures for fencing highway right-of-way are in Right of Way Manual Vol. 2 - Right of
Way Acquisition. Where additional right-of-way is not required for construction of improvements
of existing highways, right-of-way (property) fencing is the responsibility of the land owner.
Control of Access Fencing on Freeways
Control of access fence should be erected whenever it is necessary to prohibit unrestricted access to
the through lanes by pedestrians, animals and/or vehicles. The prohibition of access to the through
lanes should be from private property, intercepted local roads and unauthorized crossings from
frontage roads to the through lanes. Table 7-1 describes the types of fences that should be used for
various conditions.
Department standard designs should be used where applicable. Specially designed fences may be
necessary in certain areas where sandstorms and snowstorms occur and for other special conditions.
Table 7-1: Use of Control of Access Fencing on Freeways
Condition Type of Fence Usual Location
Urban and suburban areas Chain link fence of 4 ft [1.2 m] usual height or
6 ft [1.8 m] height where necessary for control
of pedestrians
Variable1
Rural conditions where both large
and small animals exist
Wire mesh fence with one or more strands of
barbed wire
ROW line
Rural conditions where only large
animals exist
Barbed wire fence with height of 4 ft or 5 ft [1.2
or 1.5 m]
ROW line
Control of Vehicles Post and cable fence with closely spaced posts Variable1
1Where frontage roads are provided, control of access fence, when used, should be placed in the outer separa-
tion approximately equidistant between the mainlanes and frontage roads and at least 30 ft [9.0 m] from the
edge of mainlane pavement. Where the control of access line is at the right-of-way line, the control of access
fence may be located at the right-of-way line and will serve a dual function as a right-of-way fence.
Roadway Design Manual 7-23 TxDOT 10/2014
Chapter 7 — Miscellaneous Design Elements Section 7 — Minimum Designs for Truck and Bus
Turns
Alternatives to Simple Curvature
To accommodate the longest vehicles, off-tracking characteristics in combination with the large
(simple curve) radius that must be used results in a wide pavement area. In this regard, three-cen-
tered compound curves, or offset simple curves in combination with tapers, are preferred since they
more closely fit the paths of vehicles. Table 7-2 shows minimum edge of pavement designs for
right turns to accommodate various design vehicles for turn angles varying from 60 to 120 degrees.
(US Customary)
Angle of
Turn1
(degrees)
Design
Vehicle
Simple
Curve
Radius Simple Curve Radius with Taper
3-Centered
Compound Curve,
Symmetric
3-Centered Compound
Curve, Asymmetric
- - (ft) Radius (ft) Offset (ft) Taper Radii (ft) Offset (ft) Radii (ft) Offset (ft)
60 P 40 - - - - - - -
- SU 60 - - - - - - -
- WB-40 90 - - - - - - -
- WB-50 150 120 3.0 15:1 200-75-200 5.5 200-75-275 2.0-7.0
75 P 35 25 2.0 10:1 100-75-100 2.0 - -
- SU 55 45 2.0 10:1 120-45-120 2.0 - -
- WB-40 - 60 2.0 15:1 120-45-120 5.0 120-45-195 2.0-6.5
- WB-50 - 65 3.0 15:1 150-50-150 6.5 150-50-225 2.0-10.0
90 P 30 20 2.5 10:1 100-20-100 2.5 - -
- SU 50 40 2.0 10:1 120-40-120 2.0 - -
- WB-40 - 45 4.0 10:1 120-40-120 5.0 120-40-200 2.0-6.5
- WB-50 - 60 4.0 15:1 180-60-180 6.5 120-40-200 2.0-10.0
105 P - 20 2.5 - 100-20-100 2.5 - -
- SU - 35 3.0 - 100-35-100 3.0 - -
- WB-40 - 40 4.0 - 100-35-100 5.0 100-55-200 2.0-8.0
- WB-50 - 55 4.0 15:1 180-45-180 8.0 150-40-210 2.0-10.0
120 P - 20 2.0 - 100-20-100 2.0 - -
- SU - 30 3.0 - 100-30-100 3.0 - -
- WB-40 - 35 5.0 - 120-30-120 6.0 100-30-180 2.0-9.0
- WB-50 - 45 4.0 15:1 180-40-180 8.5 150-35-220 2.0-12.0
Roadway Design Manual 7-24 TxDOT 10/2014
Chapter 7 — Miscellaneous Design Elements Section 7 — Minimum Designs for Truck and Bus
Turns
1
“Angle of Turn” is the angle through which a vehicle travels in making a turn. It is measured from the extension of the tan-
gent on which a vehicle approaches to the corresponding tangent on the intersecting road to which a vehicle turns. It is the
same angle that is commonly called the delta angle in surveying terminology.
(US Customary)
Angle of
Turn1
(degrees)
Design
Vehicle
Simple
Curve
Radius Simple Curve Radius with Taper
3-Centered
Compound Curve,
Symmetric
3-Centered Compound
Curve, Asymmetric
(Metric)
Angle of
Turn1
(degrees)
Design
Vehicle
Simple
Curve
Radius Simple Curve Radius with Taper
3-Centered
Compound Curve,
Symmetric
3-Centered Compound
Curve, Asymmetric
- - (m) Radius (m) Offset (m) Taper Radii (m) Offset (m) Radii (m) Offset (m)
60 P 12 - - - - - - -
- SU 18 - - - - - - --
- WB-12 28 - - - - - - -
- WB-15 45 29 1.0 15:1 60-23-60 1.7 60-23-84 0.6-2.0
75 P 11 8 0.6 10:1 30-8-30 0.6 - -
- SU 17 14 0.6 10:1 36-14-36 0.6 - -
- WB-12 - 18 0.6 15:1 36-14-36 1.5 36-14-60 0.6-2.0
- WB-15 - 20 1.0 15:1 45-15-45 2.0 45-15-69 0.6-3.0
90 P 9 6 0.8 10:1 30-6-30 0.8 - -
- SU 15 12 0.6 10:1 36-12-36 0.6 - -
- WB-12 - 14 1.2 10:1 36-12-36 1.5 36-12-60 0.6-2.0
- WB-15 - 18 1.2 15:1 55-18-55 2.0 36-12-60 0.6-3.0
105 P - 6 0.8 8:1 30-6-30 0.8 - -
- SU - 11 1.0 10:1 30-11-30 1.0 - -
- WB-12 - 12 1.2 10:1 30-11-30 1.5 30-17-60 0.6-2.5
- WB-15 - 17 1.2 15:1 55-14-55 2.5 45-12-64 0.6-3.0
120 P - 6 0.6 10:1 30-6-30 0.6 - -
- SU - 9 1.0 10:1 30-9-30 1.0 - -
- WB-12 - 11 1.5 8:1 36-9-36 2.0 30-9-55 0.6-2.7
- WB-15 - 14 1.2 15:1 55-12-55 2.6 45-11-67 0.6-3.6
Tablas roadway design manual

More Related Content

What's hot

Traffic engineering and traffic control devices final
Traffic engineering and traffic control devices finalTraffic engineering and traffic control devices final
Traffic engineering and traffic control devices finalLatif Hyder Wadho
 
1 geometric design elements of road by malyar talash
1 geometric design elements of road by malyar talash1 geometric design elements of road by malyar talash
1 geometric design elements of road by malyar talashMalyar Talash
 
Improvement the level of service for signalized arterial 2
Improvement the level of service for signalized arterial 2Improvement the level of service for signalized arterial 2
Improvement the level of service for signalized arterial 2IAEME Publication
 
Chapter 3 geometric design
Chapter 3 geometric  designChapter 3 geometric  design
Chapter 3 geometric designBashaFayissa1
 
Highway design presentation (Malyar Talash)
Highway design presentation (Malyar Talash)Highway design presentation (Malyar Talash)
Highway design presentation (Malyar Talash)Malyar Talash
 
Design of vertical alignment
Design of vertical alignmentDesign of vertical alignment
Design of vertical alignmentWyman Words
 
Capacity & level of service (transportation engineering)
Capacity & level of service (transportation engineering)Capacity & level of service (transportation engineering)
Capacity & level of service (transportation engineering)Civil Zone
 
Alighnment & horizontal alignment of highway (transportation engineering)
Alighnment & horizontal alignment of highway (transportation engineering)Alighnment & horizontal alignment of highway (transportation engineering)
Alighnment & horizontal alignment of highway (transportation engineering)Civil Zone
 
Design of curves
Design of curvesDesign of curves
Design of curvesDolat Ram
 
Vertical alignment of highway (transportation engineering)
Vertical alignment of highway (transportation engineering)Vertical alignment of highway (transportation engineering)
Vertical alignment of highway (transportation engineering)Civil Zone
 
Traffic signals by Aman Rdr
Traffic signals by Aman RdrTraffic signals by Aman Rdr
Traffic signals by Aman RdrAman Sharma
 
L10 Traffic Control Devices
L10 Traffic Control DevicesL10 Traffic Control Devices
L10 Traffic Control DevicesHossam Shafiq I
 
Improving the Hydraulic Efficiency of Centrifugal Pumps through Computational...
Improving the Hydraulic Efficiency of Centrifugal Pumps through Computational...Improving the Hydraulic Efficiency of Centrifugal Pumps through Computational...
Improving the Hydraulic Efficiency of Centrifugal Pumps through Computational...IJERA Editor
 

What's hot (20)

Traffic engineering and traffic control devices final
Traffic engineering and traffic control devices finalTraffic engineering and traffic control devices final
Traffic engineering and traffic control devices final
 
1 geometric design elements of road by malyar talash
1 geometric design elements of road by malyar talash1 geometric design elements of road by malyar talash
1 geometric design elements of road by malyar talash
 
Improvement the level of service for signalized arterial 2
Improvement the level of service for signalized arterial 2Improvement the level of service for signalized arterial 2
Improvement the level of service for signalized arterial 2
 
Chapter 3 geometric design
Chapter 3 geometric  designChapter 3 geometric  design
Chapter 3 geometric design
 
Highway Projects
Highway Projects Highway Projects
Highway Projects
 
7 south dakota rdmch13
7 south dakota rdmch137 south dakota rdmch13
7 south dakota rdmch13
 
Design of National Highway-13
Design of National Highway-13Design of National Highway-13
Design of National Highway-13
 
Highway design presentation (Malyar Talash)
Highway design presentation (Malyar Talash)Highway design presentation (Malyar Talash)
Highway design presentation (Malyar Talash)
 
Design of vertical alignment
Design of vertical alignmentDesign of vertical alignment
Design of vertical alignment
 
Capacity & level of service (transportation engineering)
Capacity & level of service (transportation engineering)Capacity & level of service (transportation engineering)
Capacity & level of service (transportation engineering)
 
Civil 150 project
Civil 150 projectCivil 150 project
Civil 150 project
 
Topic 4 - Curve
Topic 4 - CurveTopic 4 - Curve
Topic 4 - Curve
 
Highway Engineering
Highway EngineeringHighway Engineering
Highway Engineering
 
Alighnment & horizontal alignment of highway (transportation engineering)
Alighnment & horizontal alignment of highway (transportation engineering)Alighnment & horizontal alignment of highway (transportation engineering)
Alighnment & horizontal alignment of highway (transportation engineering)
 
Design of curves
Design of curvesDesign of curves
Design of curves
 
Geometric design
Geometric designGeometric design
Geometric design
 
Vertical alignment of highway (transportation engineering)
Vertical alignment of highway (transportation engineering)Vertical alignment of highway (transportation engineering)
Vertical alignment of highway (transportation engineering)
 
Traffic signals by Aman Rdr
Traffic signals by Aman RdrTraffic signals by Aman Rdr
Traffic signals by Aman Rdr
 
L10 Traffic Control Devices
L10 Traffic Control DevicesL10 Traffic Control Devices
L10 Traffic Control Devices
 
Improving the Hydraulic Efficiency of Centrifugal Pumps through Computational...
Improving the Hydraulic Efficiency of Centrifugal Pumps through Computational...Improving the Hydraulic Efficiency of Centrifugal Pumps through Computational...
Improving the Hydraulic Efficiency of Centrifugal Pumps through Computational...
 

Similar to Tablas roadway design manual

Dg05 ch 03 elements of design
Dg05 ch 03 elements of designDg05 ch 03 elements of design
Dg05 ch 03 elements of designGizachew Kefelew
 
hz alignment lec4.pdf
hz alignment lec4.pdfhz alignment lec4.pdf
hz alignment lec4.pdfamira525139
 
HIGHWAY ENGINEERING 1 (ii).doc
HIGHWAY ENGINEERING 1 (ii).docHIGHWAY ENGINEERING 1 (ii).doc
HIGHWAY ENGINEERING 1 (ii).docsydneyaugust1
 
Geometric Features of Road and Causes of Accident
Geometric Features of Road and Causes of AccidentGeometric Features of Road and Causes of Accident
Geometric Features of Road and Causes of AccidentIRJET Journal
 
Case Study on Geometry of Four Lane Highway
Case Study on Geometry of Four Lane HighwayCase Study on Geometry of Four Lane Highway
Case Study on Geometry of Four Lane HighwayIRJET Journal
 
IRJET- Traffic Congestion Overcome by Rotary Design
IRJET- Traffic Congestion Overcome by Rotary DesignIRJET- Traffic Congestion Overcome by Rotary Design
IRJET- Traffic Congestion Overcome by Rotary DesignIRJET Journal
 
Case Study on Highway Geometry for Two Lane Highway
Case Study on Highway Geometry for Two Lane HighwayCase Study on Highway Geometry for Two Lane Highway
Case Study on Highway Geometry for Two Lane HighwayIRJET Journal
 
Financial analysis of sahara darwaja case study
Financial analysis of sahara darwaja case studyFinancial analysis of sahara darwaja case study
Financial analysis of sahara darwaja case studyshubham sharma
 
Highway and railway geometric design-Revised.pptx
Highway and railway geometric design-Revised.pptxHighway and railway geometric design-Revised.pptx
Highway and railway geometric design-Revised.pptxkiranmaqsood5
 
Sight distance and road allignment
Sight distance and road allignmentSight distance and road allignment
Sight distance and road allignmentPiter Biswas
 
IRJET-Estimating the Vehicle Operating Cost through Railway Over Bridge
IRJET-Estimating the Vehicle Operating Cost through Railway Over BridgeIRJET-Estimating the Vehicle Operating Cost through Railway Over Bridge
IRJET-Estimating the Vehicle Operating Cost through Railway Over BridgeIRJET Journal
 
THREE DIMENSIONAL STUDIES ON FLOW DISTRIBUTIONS IN SAVONIOUS ROTORS
THREE DIMENSIONAL STUDIES ON FLOW DISTRIBUTIONS IN SAVONIOUS ROTORSTHREE DIMENSIONAL STUDIES ON FLOW DISTRIBUTIONS IN SAVONIOUS ROTORS
THREE DIMENSIONAL STUDIES ON FLOW DISTRIBUTIONS IN SAVONIOUS ROTORSIRJET Journal
 
L20 Weaving Merging and Diverging Movements
L20 Weaving Merging and Diverging MovementsL20 Weaving Merging and Diverging Movements
L20 Weaving Merging and Diverging MovementsHossam Shafiq I
 
IRJET- ABS Functionality along with the Pressure Control
IRJET-  	  ABS Functionality along with the Pressure ControlIRJET-  	  ABS Functionality along with the Pressure Control
IRJET- ABS Functionality along with the Pressure ControlIRJET Journal
 
Design Optimization and CFD Analysis of Car using Active Mounting to Reduce D...
Design Optimization and CFD Analysis of Car using Active Mounting to Reduce D...Design Optimization and CFD Analysis of Car using Active Mounting to Reduce D...
Design Optimization and CFD Analysis of Car using Active Mounting to Reduce D...IRJET Journal
 
Geometric pavement model for computer-aided design of pavement maintenance ac...
Geometric pavement model for computer-aided design of pavement maintenance ac...Geometric pavement model for computer-aided design of pavement maintenance ac...
Geometric pavement model for computer-aided design of pavement maintenance ac...Johan Granlund
 
5. renewing of indonesia highway capacity manual urban road segment with traf...
5. renewing of indonesia highway capacity manual urban road segment with traf...5. renewing of indonesia highway capacity manual urban road segment with traf...
5. renewing of indonesia highway capacity manual urban road segment with traf...wandi rusfiandi
 

Similar to Tablas roadway design manual (20)

Dg05 ch 03 elements of design
Dg05 ch 03 elements of designDg05 ch 03 elements of design
Dg05 ch 03 elements of design
 
hz alignment lec4.pdf
hz alignment lec4.pdfhz alignment lec4.pdf
hz alignment lec4.pdf
 
HIGHWAY ENGINEERING 1 (ii).doc
HIGHWAY ENGINEERING 1 (ii).docHIGHWAY ENGINEERING 1 (ii).doc
HIGHWAY ENGINEERING 1 (ii).doc
 
Geometric Features of Road and Causes of Accident
Geometric Features of Road and Causes of AccidentGeometric Features of Road and Causes of Accident
Geometric Features of Road and Causes of Accident
 
Case Study on Geometry of Four Lane Highway
Case Study on Geometry of Four Lane HighwayCase Study on Geometry of Four Lane Highway
Case Study on Geometry of Four Lane Highway
 
5 (1)
5 (1)5 (1)
5 (1)
 
IRJET- Traffic Congestion Overcome by Rotary Design
IRJET- Traffic Congestion Overcome by Rotary DesignIRJET- Traffic Congestion Overcome by Rotary Design
IRJET- Traffic Congestion Overcome by Rotary Design
 
Case Study on Highway Geometry for Two Lane Highway
Case Study on Highway Geometry for Two Lane HighwayCase Study on Highway Geometry for Two Lane Highway
Case Study on Highway Geometry for Two Lane Highway
 
Financial analysis of sahara darwaja case study
Financial analysis of sahara darwaja case studyFinancial analysis of sahara darwaja case study
Financial analysis of sahara darwaja case study
 
Highway and railway geometric design-Revised.pptx
Highway and railway geometric design-Revised.pptxHighway and railway geometric design-Revised.pptx
Highway and railway geometric design-Revised.pptx
 
Sight distance and road allignment
Sight distance and road allignmentSight distance and road allignment
Sight distance and road allignment
 
IRJET-Estimating the Vehicle Operating Cost through Railway Over Bridge
IRJET-Estimating the Vehicle Operating Cost through Railway Over BridgeIRJET-Estimating the Vehicle Operating Cost through Railway Over Bridge
IRJET-Estimating the Vehicle Operating Cost through Railway Over Bridge
 
ROAD SAFETY AUDIT
ROAD SAFETY AUDITROAD SAFETY AUDIT
ROAD SAFETY AUDIT
 
CH-2 highway.docx
CH-2 highway.docxCH-2 highway.docx
CH-2 highway.docx
 
THREE DIMENSIONAL STUDIES ON FLOW DISTRIBUTIONS IN SAVONIOUS ROTORS
THREE DIMENSIONAL STUDIES ON FLOW DISTRIBUTIONS IN SAVONIOUS ROTORSTHREE DIMENSIONAL STUDIES ON FLOW DISTRIBUTIONS IN SAVONIOUS ROTORS
THREE DIMENSIONAL STUDIES ON FLOW DISTRIBUTIONS IN SAVONIOUS ROTORS
 
L20 Weaving Merging and Diverging Movements
L20 Weaving Merging and Diverging MovementsL20 Weaving Merging and Diverging Movements
L20 Weaving Merging and Diverging Movements
 
IRJET- ABS Functionality along with the Pressure Control
IRJET-  	  ABS Functionality along with the Pressure ControlIRJET-  	  ABS Functionality along with the Pressure Control
IRJET- ABS Functionality along with the Pressure Control
 
Design Optimization and CFD Analysis of Car using Active Mounting to Reduce D...
Design Optimization and CFD Analysis of Car using Active Mounting to Reduce D...Design Optimization and CFD Analysis of Car using Active Mounting to Reduce D...
Design Optimization and CFD Analysis of Car using Active Mounting to Reduce D...
 
Geometric pavement model for computer-aided design of pavement maintenance ac...
Geometric pavement model for computer-aided design of pavement maintenance ac...Geometric pavement model for computer-aided design of pavement maintenance ac...
Geometric pavement model for computer-aided design of pavement maintenance ac...
 
5. renewing of indonesia highway capacity manual urban road segment with traf...
5. renewing of indonesia highway capacity manual urban road segment with traf...5. renewing of indonesia highway capacity manual urban road segment with traf...
5. renewing of indonesia highway capacity manual urban road segment with traf...
 

More from Sierra Francisco Justo

10. PrediccionComportamientoCR2C Resumen.pdf
10. PrediccionComportamientoCR2C Resumen.pdf10. PrediccionComportamientoCR2C Resumen.pdf
10. PrediccionComportamientoCR2C Resumen.pdfSierra Francisco Justo
 
10. PrediccionComportamientoCR2C Resumen.pdf
10. PrediccionComportamientoCR2C Resumen.pdf10. PrediccionComportamientoCR2C Resumen.pdf
10. PrediccionComportamientoCR2C Resumen.pdfSierra Francisco Justo
 
14 AdministracionSV SegunConocimiento EH&otros.pdf
14 AdministracionSV SegunConocimiento EH&otros.pdf14 AdministracionSV SegunConocimiento EH&otros.pdf
14 AdministracionSV SegunConocimiento EH&otros.pdfSierra Francisco Justo
 
10. PrediccionComportamientoCR2C Resumen.pdf
10. PrediccionComportamientoCR2C Resumen.pdf10. PrediccionComportamientoCR2C Resumen.pdf
10. PrediccionComportamientoCR2C Resumen.pdfSierra Francisco Justo
 
9 Ancho Carril y Seguridad Borrador.pdf
9 Ancho Carril y Seguridad Borrador.pdf9 Ancho Carril y Seguridad Borrador.pdf
9 Ancho Carril y Seguridad Borrador.pdfSierra Francisco Justo
 
12. SeguridadNormasDisenoGeometrico 21p.pdf
12. SeguridadNormasDisenoGeometrico 21p.pdf12. SeguridadNormasDisenoGeometrico 21p.pdf
12. SeguridadNormasDisenoGeometrico 21p.pdfSierra Francisco Justo
 
8 Causa&EfectoSeccionTransversal&SeguridadVial DRAFT.pdf
8 Causa&EfectoSeccionTransversal&SeguridadVial DRAFT.pdf8 Causa&EfectoSeccionTransversal&SeguridadVial DRAFT.pdf
8 Causa&EfectoSeccionTransversal&SeguridadVial DRAFT.pdfSierra Francisco Justo
 
13. CAMJ 2012 Defensa Conductores Ancianos.pdf
13. CAMJ 2012 Defensa Conductores Ancianos.pdf13. CAMJ 2012 Defensa Conductores Ancianos.pdf
13. CAMJ 2012 Defensa Conductores Ancianos.pdfSierra Francisco Justo
 
6. IngenieriaSeguridad&SeguridadIngenieria.pdf
6. IngenieriaSeguridad&SeguridadIngenieria.pdf6. IngenieriaSeguridad&SeguridadIngenieria.pdf
6. IngenieriaSeguridad&SeguridadIngenieria.pdfSierra Francisco Justo
 
3. Revision Seguridad Autopista 407 Toronto.pdf
3. Revision Seguridad Autopista 407 Toronto.pdf3. Revision Seguridad Autopista 407 Toronto.pdf
3. Revision Seguridad Autopista 407 Toronto.pdfSierra Francisco Justo
 
1516Resumenes Ingenieria Seguridad Vial x16 3p.pdf
1516Resumenes Ingenieria Seguridad Vial x16 3p.pdf1516Resumenes Ingenieria Seguridad Vial x16 3p.pdf
1516Resumenes Ingenieria Seguridad Vial x16 3p.pdfSierra Francisco Justo
 
1516Resumenes Ingenieria Seguridad Vial x16 3p.pdf
1516Resumenes Ingenieria Seguridad Vial x16 3p.pdf1516Resumenes Ingenieria Seguridad Vial x16 3p.pdf
1516Resumenes Ingenieria Seguridad Vial x16 3p.pdfSierra Francisco Justo
 
1516Resumenes Ingenieria Seguridad Vial x16 3p.pdf
1516Resumenes Ingenieria Seguridad Vial x16 3p.pdf1516Resumenes Ingenieria Seguridad Vial x16 3p.pdf
1516Resumenes Ingenieria Seguridad Vial x16 3p.pdfSierra Francisco Justo
 
11121314Resumenes Ingenieria Seguridad Vial x16 4p.pdf
11121314Resumenes Ingenieria Seguridad Vial x16 4p.pdf11121314Resumenes Ingenieria Seguridad Vial x16 4p.pdf
11121314Resumenes Ingenieria Seguridad Vial x16 4p.pdfSierra Francisco Justo
 
78Resumenes Ingenieria Seguridad Vial x16 3p.pdf
78Resumenes Ingenieria Seguridad Vial x16 3p.pdf78Resumenes Ingenieria Seguridad Vial x16 3p.pdf
78Resumenes Ingenieria Seguridad Vial x16 3p.pdfSierra Francisco Justo
 

More from Sierra Francisco Justo (20)

15 Causa y prevencion de choques.pdf
15 Causa y prevencion de choques.pdf15 Causa y prevencion de choques.pdf
15 Causa y prevencion de choques.pdf
 
10. PrediccionComportamientoCR2C Resumen.pdf
10. PrediccionComportamientoCR2C Resumen.pdf10. PrediccionComportamientoCR2C Resumen.pdf
10. PrediccionComportamientoCR2C Resumen.pdf
 
10. PrediccionComportamientoCR2C Resumen.pdf
10. PrediccionComportamientoCR2C Resumen.pdf10. PrediccionComportamientoCR2C Resumen.pdf
10. PrediccionComportamientoCR2C Resumen.pdf
 
9. Ancho Carril y Seguridad.pdf
9. Ancho Carril y Seguridad.pdf9. Ancho Carril y Seguridad.pdf
9. Ancho Carril y Seguridad.pdf
 
14 AdministracionSV SegunConocimiento EH&otros.pdf
14 AdministracionSV SegunConocimiento EH&otros.pdf14 AdministracionSV SegunConocimiento EH&otros.pdf
14 AdministracionSV SegunConocimiento EH&otros.pdf
 
10. PrediccionComportamientoCR2C Resumen.pdf
10. PrediccionComportamientoCR2C Resumen.pdf10. PrediccionComportamientoCR2C Resumen.pdf
10. PrediccionComportamientoCR2C Resumen.pdf
 
9 Ancho Carril y Seguridad Borrador.pdf
9 Ancho Carril y Seguridad Borrador.pdf9 Ancho Carril y Seguridad Borrador.pdf
9 Ancho Carril y Seguridad Borrador.pdf
 
12. SeguridadNormasDisenoGeometrico 21p.pdf
12. SeguridadNormasDisenoGeometrico 21p.pdf12. SeguridadNormasDisenoGeometrico 21p.pdf
12. SeguridadNormasDisenoGeometrico 21p.pdf
 
8 Causa&EfectoSeccionTransversal&SeguridadVial DRAFT.pdf
8 Causa&EfectoSeccionTransversal&SeguridadVial DRAFT.pdf8 Causa&EfectoSeccionTransversal&SeguridadVial DRAFT.pdf
8 Causa&EfectoSeccionTransversal&SeguridadVial DRAFT.pdf
 
13. CAMJ 2012 Defensa Conductores Ancianos.pdf
13. CAMJ 2012 Defensa Conductores Ancianos.pdf13. CAMJ 2012 Defensa Conductores Ancianos.pdf
13. CAMJ 2012 Defensa Conductores Ancianos.pdf
 
7. Seguridad&Evidencia.pdf
7. Seguridad&Evidencia.pdf7. Seguridad&Evidencia.pdf
7. Seguridad&Evidencia.pdf
 
6. IngenieriaSeguridad&SeguridadIngenieria.pdf
6. IngenieriaSeguridad&SeguridadIngenieria.pdf6. IngenieriaSeguridad&SeguridadIngenieria.pdf
6. IngenieriaSeguridad&SeguridadIngenieria.pdf
 
5 . Camino Por Recorrer.pdf
5 . Camino Por Recorrer.pdf5 . Camino Por Recorrer.pdf
5 . Camino Por Recorrer.pdf
 
4. HAUER Hwy 407 PEO Canada'97.pdf
4. HAUER Hwy 407 PEO Canada'97.pdf4. HAUER Hwy 407 PEO Canada'97.pdf
4. HAUER Hwy 407 PEO Canada'97.pdf
 
3. Revision Seguridad Autopista 407 Toronto.pdf
3. Revision Seguridad Autopista 407 Toronto.pdf3. Revision Seguridad Autopista 407 Toronto.pdf
3. Revision Seguridad Autopista 407 Toronto.pdf
 
1516Resumenes Ingenieria Seguridad Vial x16 3p.pdf
1516Resumenes Ingenieria Seguridad Vial x16 3p.pdf1516Resumenes Ingenieria Seguridad Vial x16 3p.pdf
1516Resumenes Ingenieria Seguridad Vial x16 3p.pdf
 
1516Resumenes Ingenieria Seguridad Vial x16 3p.pdf
1516Resumenes Ingenieria Seguridad Vial x16 3p.pdf1516Resumenes Ingenieria Seguridad Vial x16 3p.pdf
1516Resumenes Ingenieria Seguridad Vial x16 3p.pdf
 
1516Resumenes Ingenieria Seguridad Vial x16 3p.pdf
1516Resumenes Ingenieria Seguridad Vial x16 3p.pdf1516Resumenes Ingenieria Seguridad Vial x16 3p.pdf
1516Resumenes Ingenieria Seguridad Vial x16 3p.pdf
 
11121314Resumenes Ingenieria Seguridad Vial x16 4p.pdf
11121314Resumenes Ingenieria Seguridad Vial x16 4p.pdf11121314Resumenes Ingenieria Seguridad Vial x16 4p.pdf
11121314Resumenes Ingenieria Seguridad Vial x16 4p.pdf
 
78Resumenes Ingenieria Seguridad Vial x16 3p.pdf
78Resumenes Ingenieria Seguridad Vial x16 3p.pdf78Resumenes Ingenieria Seguridad Vial x16 3p.pdf
78Resumenes Ingenieria Seguridad Vial x16 3p.pdf
 

Recently uploaded

Booking open Available Pune Call Girls Pargaon 6297143586 Call Hot Indian Gi...
Booking open Available Pune Call Girls Pargaon  6297143586 Call Hot Indian Gi...Booking open Available Pune Call Girls Pargaon  6297143586 Call Hot Indian Gi...
Booking open Available Pune Call Girls Pargaon 6297143586 Call Hot Indian Gi...Call Girls in Nagpur High Profile
 
CCS335 _ Neural Networks and Deep Learning Laboratory_Lab Complete Record
CCS335 _ Neural Networks and Deep Learning Laboratory_Lab Complete RecordCCS335 _ Neural Networks and Deep Learning Laboratory_Lab Complete Record
CCS335 _ Neural Networks and Deep Learning Laboratory_Lab Complete RecordAsst.prof M.Gokilavani
 
Call for Papers - Educational Administration: Theory and Practice, E-ISSN: 21...
Call for Papers - Educational Administration: Theory and Practice, E-ISSN: 21...Call for Papers - Educational Administration: Theory and Practice, E-ISSN: 21...
Call for Papers - Educational Administration: Theory and Practice, E-ISSN: 21...Christo Ananth
 
Booking open Available Pune Call Girls Koregaon Park 6297143586 Call Hot Ind...
Booking open Available Pune Call Girls Koregaon Park  6297143586 Call Hot Ind...Booking open Available Pune Call Girls Koregaon Park  6297143586 Call Hot Ind...
Booking open Available Pune Call Girls Koregaon Park 6297143586 Call Hot Ind...Call Girls in Nagpur High Profile
 
Structural Analysis and Design of Foundations: A Comprehensive Handbook for S...
Structural Analysis and Design of Foundations: A Comprehensive Handbook for S...Structural Analysis and Design of Foundations: A Comprehensive Handbook for S...
Structural Analysis and Design of Foundations: A Comprehensive Handbook for S...Dr.Costas Sachpazis
 
Call Girls in Nagpur Suman Call 7001035870 Meet With Nagpur Escorts
Call Girls in Nagpur Suman Call 7001035870 Meet With Nagpur EscortsCall Girls in Nagpur Suman Call 7001035870 Meet With Nagpur Escorts
Call Girls in Nagpur Suman Call 7001035870 Meet With Nagpur EscortsCall Girls in Nagpur High Profile
 
Glass Ceramics: Processing and Properties
Glass Ceramics: Processing and PropertiesGlass Ceramics: Processing and Properties
Glass Ceramics: Processing and PropertiesPrabhanshu Chaturvedi
 
Call for Papers - African Journal of Biological Sciences, E-ISSN: 2663-2187, ...
Call for Papers - African Journal of Biological Sciences, E-ISSN: 2663-2187, ...Call for Papers - African Journal of Biological Sciences, E-ISSN: 2663-2187, ...
Call for Papers - African Journal of Biological Sciences, E-ISSN: 2663-2187, ...Christo Ananth
 
UNIT-V FMM.HYDRAULIC TURBINE - Construction and working
UNIT-V FMM.HYDRAULIC TURBINE - Construction and workingUNIT-V FMM.HYDRAULIC TURBINE - Construction and working
UNIT-V FMM.HYDRAULIC TURBINE - Construction and workingrknatarajan
 
Call Girls Service Nagpur Tanvi Call 7001035870 Meet With Nagpur Escorts
Call Girls Service Nagpur Tanvi Call 7001035870 Meet With Nagpur EscortsCall Girls Service Nagpur Tanvi Call 7001035870 Meet With Nagpur Escorts
Call Girls Service Nagpur Tanvi Call 7001035870 Meet With Nagpur EscortsCall Girls in Nagpur High Profile
 
Online banking management system project.pdf
Online banking management system project.pdfOnline banking management system project.pdf
Online banking management system project.pdfKamal Acharya
 
Porous Ceramics seminar and technical writing
Porous Ceramics seminar and technical writingPorous Ceramics seminar and technical writing
Porous Ceramics seminar and technical writingrakeshbaidya232001
 
BSides Seattle 2024 - Stopping Ethan Hunt From Taking Your Data.pptx
BSides Seattle 2024 - Stopping Ethan Hunt From Taking Your Data.pptxBSides Seattle 2024 - Stopping Ethan Hunt From Taking Your Data.pptx
BSides Seattle 2024 - Stopping Ethan Hunt From Taking Your Data.pptxfenichawla
 
UNIT-III FMM. DIMENSIONAL ANALYSIS
UNIT-III FMM.        DIMENSIONAL ANALYSISUNIT-III FMM.        DIMENSIONAL ANALYSIS
UNIT-III FMM. DIMENSIONAL ANALYSISrknatarajan
 
Coefficient of Thermal Expansion and their Importance.pptx
Coefficient of Thermal Expansion and their Importance.pptxCoefficient of Thermal Expansion and their Importance.pptx
Coefficient of Thermal Expansion and their Importance.pptxAsutosh Ranjan
 
(PRIYA) Rajgurunagar Call Girls Just Call 7001035870 [ Cash on Delivery ] Pun...
(PRIYA) Rajgurunagar Call Girls Just Call 7001035870 [ Cash on Delivery ] Pun...(PRIYA) Rajgurunagar Call Girls Just Call 7001035870 [ Cash on Delivery ] Pun...
(PRIYA) Rajgurunagar Call Girls Just Call 7001035870 [ Cash on Delivery ] Pun...ranjana rawat
 
Top Rated Pune Call Girls Budhwar Peth ⟟ 6297143586 ⟟ Call Me For Genuine Se...
Top Rated  Pune Call Girls Budhwar Peth ⟟ 6297143586 ⟟ Call Me For Genuine Se...Top Rated  Pune Call Girls Budhwar Peth ⟟ 6297143586 ⟟ Call Me For Genuine Se...
Top Rated Pune Call Girls Budhwar Peth ⟟ 6297143586 ⟟ Call Me For Genuine Se...Call Girls in Nagpur High Profile
 
result management system report for college project
result management system report for college projectresult management system report for college project
result management system report for college projectTonystark477637
 

Recently uploaded (20)

Booking open Available Pune Call Girls Pargaon 6297143586 Call Hot Indian Gi...
Booking open Available Pune Call Girls Pargaon  6297143586 Call Hot Indian Gi...Booking open Available Pune Call Girls Pargaon  6297143586 Call Hot Indian Gi...
Booking open Available Pune Call Girls Pargaon 6297143586 Call Hot Indian Gi...
 
CCS335 _ Neural Networks and Deep Learning Laboratory_Lab Complete Record
CCS335 _ Neural Networks and Deep Learning Laboratory_Lab Complete RecordCCS335 _ Neural Networks and Deep Learning Laboratory_Lab Complete Record
CCS335 _ Neural Networks and Deep Learning Laboratory_Lab Complete Record
 
Call for Papers - Educational Administration: Theory and Practice, E-ISSN: 21...
Call for Papers - Educational Administration: Theory and Practice, E-ISSN: 21...Call for Papers - Educational Administration: Theory and Practice, E-ISSN: 21...
Call for Papers - Educational Administration: Theory and Practice, E-ISSN: 21...
 
Booking open Available Pune Call Girls Koregaon Park 6297143586 Call Hot Ind...
Booking open Available Pune Call Girls Koregaon Park  6297143586 Call Hot Ind...Booking open Available Pune Call Girls Koregaon Park  6297143586 Call Hot Ind...
Booking open Available Pune Call Girls Koregaon Park 6297143586 Call Hot Ind...
 
(INDIRA) Call Girl Aurangabad Call Now 8617697112 Aurangabad Escorts 24x7
(INDIRA) Call Girl Aurangabad Call Now 8617697112 Aurangabad Escorts 24x7(INDIRA) Call Girl Aurangabad Call Now 8617697112 Aurangabad Escorts 24x7
(INDIRA) Call Girl Aurangabad Call Now 8617697112 Aurangabad Escorts 24x7
 
Structural Analysis and Design of Foundations: A Comprehensive Handbook for S...
Structural Analysis and Design of Foundations: A Comprehensive Handbook for S...Structural Analysis and Design of Foundations: A Comprehensive Handbook for S...
Structural Analysis and Design of Foundations: A Comprehensive Handbook for S...
 
Call Girls in Nagpur Suman Call 7001035870 Meet With Nagpur Escorts
Call Girls in Nagpur Suman Call 7001035870 Meet With Nagpur EscortsCall Girls in Nagpur Suman Call 7001035870 Meet With Nagpur Escorts
Call Girls in Nagpur Suman Call 7001035870 Meet With Nagpur Escorts
 
Glass Ceramics: Processing and Properties
Glass Ceramics: Processing and PropertiesGlass Ceramics: Processing and Properties
Glass Ceramics: Processing and Properties
 
Call for Papers - African Journal of Biological Sciences, E-ISSN: 2663-2187, ...
Call for Papers - African Journal of Biological Sciences, E-ISSN: 2663-2187, ...Call for Papers - African Journal of Biological Sciences, E-ISSN: 2663-2187, ...
Call for Papers - African Journal of Biological Sciences, E-ISSN: 2663-2187, ...
 
UNIT-V FMM.HYDRAULIC TURBINE - Construction and working
UNIT-V FMM.HYDRAULIC TURBINE - Construction and workingUNIT-V FMM.HYDRAULIC TURBINE - Construction and working
UNIT-V FMM.HYDRAULIC TURBINE - Construction and working
 
Call Girls Service Nagpur Tanvi Call 7001035870 Meet With Nagpur Escorts
Call Girls Service Nagpur Tanvi Call 7001035870 Meet With Nagpur EscortsCall Girls Service Nagpur Tanvi Call 7001035870 Meet With Nagpur Escorts
Call Girls Service Nagpur Tanvi Call 7001035870 Meet With Nagpur Escorts
 
Online banking management system project.pdf
Online banking management system project.pdfOnline banking management system project.pdf
Online banking management system project.pdf
 
Porous Ceramics seminar and technical writing
Porous Ceramics seminar and technical writingPorous Ceramics seminar and technical writing
Porous Ceramics seminar and technical writing
 
BSides Seattle 2024 - Stopping Ethan Hunt From Taking Your Data.pptx
BSides Seattle 2024 - Stopping Ethan Hunt From Taking Your Data.pptxBSides Seattle 2024 - Stopping Ethan Hunt From Taking Your Data.pptx
BSides Seattle 2024 - Stopping Ethan Hunt From Taking Your Data.pptx
 
UNIT-III FMM. DIMENSIONAL ANALYSIS
UNIT-III FMM.        DIMENSIONAL ANALYSISUNIT-III FMM.        DIMENSIONAL ANALYSIS
UNIT-III FMM. DIMENSIONAL ANALYSIS
 
Coefficient of Thermal Expansion and their Importance.pptx
Coefficient of Thermal Expansion and their Importance.pptxCoefficient of Thermal Expansion and their Importance.pptx
Coefficient of Thermal Expansion and their Importance.pptx
 
Roadmap to Membership of RICS - Pathways and Routes
Roadmap to Membership of RICS - Pathways and RoutesRoadmap to Membership of RICS - Pathways and Routes
Roadmap to Membership of RICS - Pathways and Routes
 
(PRIYA) Rajgurunagar Call Girls Just Call 7001035870 [ Cash on Delivery ] Pun...
(PRIYA) Rajgurunagar Call Girls Just Call 7001035870 [ Cash on Delivery ] Pun...(PRIYA) Rajgurunagar Call Girls Just Call 7001035870 [ Cash on Delivery ] Pun...
(PRIYA) Rajgurunagar Call Girls Just Call 7001035870 [ Cash on Delivery ] Pun...
 
Top Rated Pune Call Girls Budhwar Peth ⟟ 6297143586 ⟟ Call Me For Genuine Se...
Top Rated  Pune Call Girls Budhwar Peth ⟟ 6297143586 ⟟ Call Me For Genuine Se...Top Rated  Pune Call Girls Budhwar Peth ⟟ 6297143586 ⟟ Call Me For Genuine Se...
Top Rated Pune Call Girls Budhwar Peth ⟟ 6297143586 ⟟ Call Me For Genuine Se...
 
result management system report for college project
result management system report for college projectresult management system report for college project
result management system report for college project
 

Tablas roadway design manual

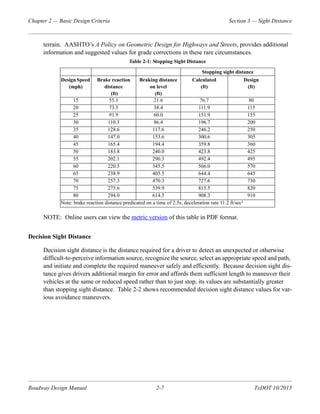
  • 1. Roadway Design Manual 2-7 TxDOT 10/2013 Chapter 2 — Basic Design Criteria Section 3 — Sight Distance terrain. AASHTO’s A Policy on Geometric Design for Highways and Streets, provides additional information and suggested values for grade corrections in these rare circumstances. NOTE: Online users can view the metric version of this table in PDF format. Decision Sight Distance Decision sight distance is the distance required for a driver to detect an unexpected or otherwise difficult-to-perceive information source, recognize the source, select an appropriate speed and path, and initiate and complete the required maneuver safely and efficiently. Because decision sight dis- tance gives drivers additional margin for error and affords them sufficient length to maneuver their vehicles at the same or reduced speed rather than to just stop, its values are substantially greater than stopping sight distance. Table 2-2 shows recommended decision sight distance values for var- ious avoidance maneuvers. Table 2-1: Stopping Sight Distance Stopping sight distance DesignSpeed (mph) Brake reaction distance (ft) Braking distance on level (ft) Calculated (ft) Design (ft) 15 55.1 21.6 76.7 80 20 73.5 38.4 111.9 115 25 91.9 60.0 151.9 155 30 110.3 86.4 196.7 200 35 128.6 117.6 246.2 250 40 147.0 153.6 300.6 305 45 165.4 194.4 359.8 360 50 183.8 240.0 423.8 425 55 202.1 290.3 492.4 495 60 220.5 345.5 566.0 570 65 238.9 405.5 644.4 645 70 257.3 470.3 727.6 730 75 275.6 539.9 815.5 820 80 294.0 614.3 908.3 910 Note: brake reaction distance predicated on a time of 2.5s; deceleration rate 11.2 ft/sec²
  • 2. Roadway Design Manual 2-8 TxDOT 10/2013 Chapter 2 — Basic Design Criteria Section 3 — Sight Distance NOTE: Online users can view the metric version of this table in PDF format. Examples of situations in which decision sight distance is preferred include the following:  Interchange and intersection locations where unusual or unexpected maneuvers are required (such as exit ramp gore areas and left-hand exits)  Changes in cross section such as toll plazas and lane drops  Areas of concentrated demand where there is apt to be “visual noise” whenever sources of information compete, as those from roadway elements, traffic, traffic control devices, and advertising signs Locations along the roadway where a driver has stopping sight distance but not the extra response time provided by decision sight distance is identified as a reduce decision zone. During the design process, the roadway engineer can avoid the location of intersections within a reduced decision zone either by relocating the intersection or by changing the grades to reduce the size of the reduced design zone. Table 2-2: Recommended Decision Sight Distance Values Decision sight distance (ft) Avoidance maneuver Design speed (mph) A B C D E 30 220 490 450 535 620 35 275 590 525 625 720 40 330 690 600 715 825 45 395 800 675 800 930 50 465 910 750 890 1030 55 535 1030 865 980 1135 60 610 1150 990 1125 1280 65 695 1275 1050 1220 1365 70 780 1410 1105 1275 1445 75 875 1545 1180 1365 1545 80 970 1685 1260 1455 1650 Avoidance Maneuver A: Stop on rural road – t = 3.0s Avoidance Maneuver B: Stop on urban road – t = 9.1s Avoidance Maneuver C: Speed/path/direction change on rural road – t varies between 10.2 and 11.2s Avoidance Maneuver D: Speed/path/direction change on suburban road – t varies between 12.1 and 12.9s Avoidance Maneuver E: Speed/path/direction change on urban road – t varies between 14.0 and 14.5s
  • 3. Roadway Design Manual 2-11 TxDOT 10/2013 Chapter 2 — Basic Design Criteria Section 4 — Horizontal Alignment Curve Radius The minimum radii of curves are important control values in designing for safe operation. Design guidance for curvature is shown in Table 2-3 and “Table 2-4: Horizontal Curvature of Highways without Superelevation1.” NOTE: Online users can view the metric version of this table in PDF format. Table 2-3: Horizontal Curvature of High-Speed Highways and Connecting Roadways with Superelevation Design Speed (mph) Usual Min.1,2 Radius of Curve (ft) Absolute Min.1,3 Radius of Curve (ft) [based on emax = 6%] 45 810 643 50 1050 833 55 1635 1060 60 2195 1330 65 2740 1660 70 3390 2040 75 3750 2500 80 4575 3050 [based on emax = 8%] 45 740 587 50 955 758 55 1480 960 60 1980 1200 65 2445 1480 70 3005 1810 75 3315 2210 80 4005 2670 1 For other maximum superelevation rates refer to AASHTO’s A Policy on Geometric Design of Highways and Streets. 2 Applies to new location construction. For 3R or reconstruction, existing curvature equal to or flatter than absolute minimum values may be retained unless accident history indicates flattening curvature. 3 Absolute minimum values should be used only where unusual design circumstances dictate.
  • 4. Roadway Design Manual 2-12 TxDOT 10/2013 Chapter 2 — Basic Design Criteria Section 4 — Horizontal Alignment NOTE: Online users can view the metric version of this table in PDF format. For high speed design conditions, the maximum deflection angle allowable without a horizontal curve is fifteen (15) minutes. For low speed design conditions, the maximum deflection angle allowable without a horizontal curve is thirty (30) minutes. Superelevation Rate As a vehicle traverses a horizontal curve, centrifugal force is counter-balanced by the vehicle weight component due to roadway superelevation and by the side friction between tires and surfac- ing as shown in the following equation: e + f = V2/15R (US Customary) Where: e = superelevation rate, in decimal format f = side friction factor V = vehicle speed, mph R = curve radius, feet NOTE: Online users can view the metric version of this equation in PDF format. There are practical limits to the rate of superelevation. High rates create steering problems for driv- ers traveling at lower speeds, particularly during ice or snow conditions. On urban facilities, lower Table 2-4: Horizontal Curvature of Highways without Superelevation Design Speed (mph) 6% Min. Radius (ft)1 8% Min. Radius (ft)1 15 868 932 20 1580 1640 25 2290 2370 30 3130 3240 35 4100 4260 40 5230 5410 45 6480 6710 50 7870 8150 55 9410 9720 60 11100 11500 65 12600 12900 70 14100 14500 75 15700 16100 80 17400 17800 1 Normal crown (2%) maintained
  • 5. Roadway Design Manual 2-14 TxDOT 10/2013 Chapter 2 — Basic Design Criteria Section 4 — Horizontal Alignment NOTE: Online users can view the metric version of this table in PDF format. Superelevation Rate on High-Speed Facilities. Tables 2-6 and 2-7 show superelevation rates (maximum 6 and 8 percent, respectively) for various design speeds and radii. These tables should be used for high-speed facilities such as rural highways and urban freeways. Table 2-5: Minimum Radii and Superelevation for Low-Speed Urban Streets e(%) V = 15 mph R (ft) V = 20 mph R (ft) V = 25 mph R (ft) V = 30 mph R (ft) V = 35 mph R (ft) V = 40 mph R (ft) V = 45 mph R (ft) -4.0 54 116 219 375 583 889 1227 -3.0 52 111 208 353 544 821 1125 -2.8 51 110 206 349 537 808 1107 -2.6 51 109 204 345 530 796 1089 -2.4 51 108 202 341 524 784 1071 -2.2 50 108 200 337 517 773 1055 -2.0 50 107 198 333 510 762 1039 -1.5 49 105 194 324 495 736 1000 0 47 99 181 300 454 667 900 1.5 45 94 170 279 419 610 818 2.0 44 92 167 273 408 593 794 2.2 44 91 165 270 404 586 785 2.4 44 91 164 268 400 580 776 2.6 43 90 163 265 396 573 767 2.8 43 89 161 263 393 567 758 3.0 43 89 160 261 389 561 750 3.2 43 88 159 259 385 556 742 3.4 42 88 158 256 382 550 734 3.6 42 87 157 254 378 544 726 3.8 42 87 155 252 375 539 718 4.0 42 86 154 250 371 533 711 Notes: 1. Computed using Superelevation Distribution Method 2. 2. Superelevation may be optional on low-speed urban streets. 3. Negative superelevation values beyond -2.0% should be used for low type surfaces such as gravel, crushed stone, and earth. However, areas with intense rainfall may use normal cross slopes on high type surfaces of -2.5%.
  • 6. Roadway Design Manual 2-15 TxDOT 10/2013 Chapter 2 — Basic Design Criteria Section 4 — Horizontal Alignment NOTE: Online users can view the metric version of this table in PDF format. Table 2-6: Minimum Radii for Design Superelevation Rates, Design Speeds, and emax = 6% e (%) 15 mph R (ft) 20 mph R (ft) 25 mph R (ft) 30 mph R(ft) 35mph R (ft) 40 mph R (ft) 45 mph R (ft) 50 mph R (ft) 55 mph R (ft) 60 mph R (ft) 65mph R (ft) 70 mph R (ft) 75 mph R (ft) 80 mph R (ft) 2.0 614 1120 1630 2240 2950 3770 4680 5700 6820 8060 9130 10300 11500 12900 2.2 543 991 1450 2000 2630 3370 4190 5100 6110 7230 8200 9240 10400 11600 2.4 482 884 1300 1790 2360 3030 3770 4600 5520 6540 7430 8380 9420 10600 2.6 430 791 1170 1610 2130 2740 3420 4170 5020 5950 6770 7660 8620 9670 2.8 384 709 1050 1460 1930 2490 3110 3800 4580 5440 6200 7030 7930 8910 3.0 341 635 944 1320 1760 2270 2840 3480 4200 4990 5710 6490 7330 8260 3.2 300 566 850 1200 1600 2080 2600 3200 3860 4600 5280 6010 6810 7680 3.4 256 498 761 1080 1460 1900 2390 2940 3560 4250 4890 5580 6340 7180 3.6 209 422 673 972 1320 1740 2190 2710 3290 3940 4540 5210 5930 6720 3.8 176 358 583 864 1190 1590 2010 2490 3040 3650 4230 4860 5560 6320 4.0 151 309 511 766 1070 1440 1840 2300 2810 3390 3950 4550 5220 5950 4.2 131 270 452 684 960 1310 1680 2110 2590 3140 3680 4270 4910 5620 4.4 116 238 402 615 868 1190 1540 1940 2400 2920 3440 4010 4630 5320 4.6 102 212 360 555 788 1090 1410 1780 2210 2710 3220 3770 4380 5040 4.8 91 189 324 502 718 995 1300 1640 2050 2510 3000 3550 4140 4790 5.0 82 169 292 456 654 911 1190 1510 1890 2330 2800 3330 3910 4550 5.2 73 152 264 413 595 833 1090 1390 1750 2160 2610 3120 3690 4320 5.4 65 136 237 373 540 759 995 1280 1610 1990 2420 2910 3460 4090 5.6 58 121 212 335 487 687 903 1160 1470 1830 2230 2700 3230 3840 5.8 51 106 186 296 431 611 806 1040 1320 1650 2020 2460 2970 3560 6.0 39 81 144 231 340 485 643 833 1060 1330 1660 2040 2500 3050
  • 7. Roadway Design Manual 2-16 TxDOT 10/2013 Chapter 2 — Basic Design Criteria Section 4 — Horizontal Alignment NOTE: Online users can view the metric version of this table in PDF format Superelevation Transition Length Superelevation transition is the general term denoting the change in cross slope from a normal crown section to the full superelevated section or vice versa. To meet the requirements of comfort and safety, the superelevation transition should be effected over a length adequate for the usual travel speeds. Table 2-7: Minimum Radii for Design Superelevation Rates, Design Speeds, and emax = 8% e (%) Vd= 15mph R(ft) Vd= 20mph R(ft) Vd= 25mph R(ft) Vd= 30mph R(ft) Vd= 35mph R(ft) Vd= 40mph R(ft) Vd= 45mph R(ft) Vd= 50mph R(ft) Vd= 55mph R(ft) Vd= 60mph R(ft) Vd= 65mph R(ft) Vd= 70mph R(ft) Vd= 75mph R(ft) Vd= 80mph R(ft) 2.0 676 1190 1720 2370 3120 3970 4930 5990 7150 8440 9510 10700 12000 13300 2.2 605 1070 1550 2130 2800 3570 4440 5400 6450 7620 8600 9660 10800 12000 2.4 546 959 1400 1930 2540 3240 4030 4910 5870 6930 7830 8810 9850 11000 2.6 496 872 1280 1760 2320 2960 3690 4490 5370 6350 7180 8090 9050 10100 2.8 453 796 1170 1610 2130 2720 3390 4130 4950 5850 6630 7470 8370 9340 3.0 415 730 1070 1480 1960 2510 3130 3820 4580 5420 6140 6930 7780 8700 3.2 382 672 985 1370 1820 2330 2900 3550 4250 5040 5720 6460 7260 8130 3.4 352 620 911 1270 1690 2170 2700 3300 3970 4700 5350 6050 6800 7620 3.6 324 572 845 1180 1570 2020 2520 3090 3710 4400 5010 5680 6400 7180 3.8 300 530 784 1100 1470 1890 2360 2890 3480 4140 4710 5350 6030 6780 4.0 277 490 729 1030 1370 1770 2220 2720 3270 3890 4450 5050 5710 6420 4.2 255 453 678 955 1280 1660 2080 2560 3080 3670 4200 4780 5410 6090 4.4 235 418 630 893 1200 1560 1960 2410 2910 3470 3980 4540 5140 5800 4.6 215 384 585 834 1130 1470 1850 2280 2750 3290 3770 4310 4890 5530 4.8 193 349 542 779 1060 1390 1750 2160 2610 3120 3590 4100 4670 5280 5.0 172 314 499 727 991 1310 1650 2040 2470 2960 3410 3910 4460 5050 5.2 154 284 457 676 929 1230 1560 1930 2350 2820 3250 3740 4260 4840 5.4 139 258 420 627 870 1160 1480 1830 2230 2680 3110 3570 4090 4640 5.6 126 236 387 582 813 1090 1390 1740 2120 2550 2970 3420 3920 4460 5.8 115 216 358 542 761 1030 1320 1650 2010 2430 2840 3280 3760 4290 6.0 105 199 332 506 713 965 1250 1560 1920 2320 2710 3150 3620 4140 6.2 97 184 308 472 669 909 1180 1480 1820 2210 2600 3020 3480 3990 6.4 89 170 287 442 628 857 1110 1400 1730 2110 2490 2910 3360 3850 6.6 82 157 267 413 590 808 1050 1330 1650 2010 2380 2790 3240 3720 6.8 76 146 248 386 553 761 990 1260 1560 1910 2280 2690 3120 3600 7.0 70 135 231 360 518 716 933 1190 1480 1820 2180 2580 3010 3480 7.2 64 125 214 336 485 672 878 1120 1400 1720 2070 2470 2900 3370 7.4 59 115 198 312 451 628 822 1060 1320 1630 1970 2350 2780 3250 7.6 54 105 182 287 417 583 765 980 1230 1530 1850 2230 2650 3120 7.8 48 94 164 261 380 533 701 901 1140 1410 1720 2090 2500 2970 8.0 38 76 134 214 314 444 587 758 960 1200 1480 1810 2210 2670
  • 8. Roadway Design Manual 2-17 TxDOT 10/2013 Chapter 2 — Basic Design Criteria Section 4 — Horizontal Alignment Desirable design values for length of superelevation transition are based on using a given maxi- mum relative gradient between profiles of the edge of traveled way and the axis of rotation. Table 2-8 shows recommended maximum relative gradient values. Transition length on this basis is directly proportional to the total superelevation, which is the product of the lane width and the change in cross slope. NOTE: Online users can view the metric version of this table in PDF format. Transition length, L, for a multilane highway can be calculated using the following equation: LCT = [(CS)(W)]/G (US Customary) Where: LCT = calculated transition length (ft) CS = percent change in cross slope of superelevated pavement, W = distance between the axis of rotation and the edge of traveled way (ft), G = maximum relative gradient (“Table 2-8: Maximum Relative Gradient for Superelevation Transition”). NOTE: Online users can view the metric version of this equation in PDF format. Example determinations of superelevation transition shown in Figure 2-1. Table 2-8: Maximum Relative Gradient for Superelevation Transition Design Speed (mph) Maximum Relative Gradient%1 Equivalent Maximum Relative Slope 15 0.78 1:128 20 0.74 1:135 25 0.70 1:143 30 0.66 1:152 35 0.62 1:161 40 0.58 1:172 45 0.54 1:185 50 0.50 1:200 55 0.47 1:213 60 0.45 1:222 65 0.43 1:233 70 0.40 1:250 75 0.38 1:263 80 0.35 1:286 1 Maximum relative gradient for profile between edge of traveled way and axis of rotation.
  • 9. Roadway Design Manual 2-19 TxDOT 10/2013 Chapter 2 — Basic Design Criteria Section 4 — Horizontal Alignment where “b” is defined in Table 2-9 Superelevation Transition Placement The location of the transition in respect to the termini of a simple (circular) curve should be placed to minimize lateral acceleration and the vehicle's lateral motion. The appropriate allocation of superelevation transition on the tangent, either preceding or following a curve, is provided on Table 2-10. When spiral curves are used, the transition usually is distributed over the length of the spiral curve. Care must be exercised in designing the length and location of the transition. Profiles of both gut- ters or pavement edges should be plotted relative to the profile grade line to insure proper drainage, especially where these sections occur within vertical curvature of the profile grade line. Special care should be given to ensure that the zero cross slope in the superelevation transition does not occur near the flat portion of the crest or sag vertical curve. A plot of roadway contours can identify drainage problems in areas of superelevation transition. See "Minimum Transition Grades" section of AASHTO's A Policy on Geometric Design of Highways and Streets for further discussion on potential drainage problems and effective means to mitigate them. Whenever reverse curves are closely spaced and superelevation transition lengths overlap, L values should be adjusted to prorate change in cross slope and to ensure that roadway cross slopes are in the proper direction for each horizontal curve. Table 2-9: Multilane Adjustment Factor1 Number of Lanes Rotated Adjustment Factor (b) 1.5 0.83 2 0.75 2.5 0.70 3 0.67 3.5 0.64 1 These adjustment factors are directly applicable to undivided streets and highways. For divided highways where the axis of rotation is not the edge of travel, see AASHTO’s A Policy on Geometric Design of Highways and Streets dis- cussion under “Axis of Rotation with a Median”. Table 2-10: Portion of Superelevation Transition Located on the Tangent1 Design Speed (mph) No. of Lanes Rotated 1.0 1.5 2.0 - 2.5 3.0 - 3.5 15 - 45 0.80 0.85 0.90 0.90 50 - 80 0.70 0.75 0.80 0.85 1 These values are desirable and should be followed as closely as possible when conditions allow. A value between 0.6 and 0.9 for all speeds and rotated widths is considered acceptable. (AASHTO’s A Policy on Geometric Design of Highways and Streets, 2011, pg. 3-67).
  • 10. Roadway Design Manual 2-25 TxDOT 10/2013 Chapter 2 — Basic Design Criteria Section 5 — Vertical Alignment Table 2-11 summarizes the maximum grade controls in terms of design speed. Generally, maxi- mum design grade should be used infrequently rather than as a value to be used in most cases. However, for certain cases such as urban freeways, a maximum value may be applied in blanket fashion on interchange and grade separated approaches. Flat or level grades on uncurbed pavements are satisfactory when the pavement is adequately crowned to drain the surface water laterally. When side ditches are required, the grade should sel- dom be less than 0.5 percent for unpaved ditches and 0.25 percent for lined channels. With curbed pavements, desirable minimum grades of 0.35 percent should be provided to facilitate surface drainage. Joint analyses of rainfall frequency and duration, the longitudinal grade, cross slope, curb inlet type and spacing of inlets or discharge points usually is required so that the width of water on the pavement surface during likely storms does not unduly interfere with traffic. Criteria Table 2-11: Maximum Grades Functional Classification Type of Terrain 15 20 25 30 35 40 45 50 55 60 65 70 75 80 Urban and Suburban: - - - - - - - - - - - - - - - - - - - - - - - - - - - - - - - Local1 All <15 <15 <15 <15 <15 <15 <15 -- -- -- -- -- -- -- - - - - - - - - - - - - - - - - Collector Level 9 9 9 9 9 9 8 7 7 6 -- -- -- -- - Rolling 12 12 12 11 10 10 9 8 8 7 -- -- -- -- - - - - - - - - - - - - - - - - Arterial Level -- -- -- 8 7 7 6 6 5 5 -- -- -- -- - Rolling -- -- -- 9 8 8 7 7 6 6 -- -- -- -- - - - - - - - - - - - - - - - - Freeway Level -- -- -- -- -- -- -- 4 4 3 3 3 3 3 - Rolling -- -- -- -- -- -- -- 5 5 4 4 4 4 4 Rural: - - - - - - - - - - - - - - - Local Level 9 8 7 7 7 7 7 6 6 5 -- -- -- -- - Rolling 12 11 11 10 10 10 9 8 7 6 -- -- -- -- - - - - - - - - - - - - - - - - Collector Level - 7 7 7 7 7 7 6 6 5 -- -- -- -- - Rolling - 10 10 9 9 8 8 7 7 6 -- -- -- -- - - - - - - - - - - - - - - - - Arterial Level -- -- -- -- -- 5 5 4 4 3 3 3 3 3 - Rolling -- -- -- -- -- 6 6 5 5 4 4 4 4 4 - - - - - - - - - - - - - - - - Freeway Level -- -- -- -- -- -- -- 4 4 3 3 3 3 3 - Rolling -- -- -- -- -- -- -- 5 5 4 4 4 4 4 1 8% maximum in commercial areas on local streets, desirably less than 5%. Flatter gradients should be used where practical.
  • 11. Roadway Design Manual 2-44 TxDOT 10/2013 Chapter 2 — Basic Design Criteria Section 6 — Cross Sectional Elements NOTE: Online users can view the metric version of this table in PDF format. The clear zone values shown in Table 2-12 are measured from the edge of travel lane. These are appropriate design values for all cut sections (see “Drainage Facility Placement”), for cross sec- tional design of ditches within the clear zone area) and for all fill sections with side slopes 1V:4H or flatter. It should be noted that, while a 1V:4H slope is acceptable, that a 1V:6H or flatter slope is preferred for both errant vehicle performance and slope maintainability. For fill slopes steeper than 1V:4H, errant vehicles have a reduced chance of recovery and the lateral extent of each roadside encroachment increases. It is therefore preferable to provide an obstacle-free area of 10 ft[3.0m] beyond the toe of steep side slopes even when this area is outside the clear zone. Table 2-12: Clear Zones Location Functional Classification Design Speed (mph) Avg. Daily Traffic Clear Zone Width (ft)3,4,5 - - - - Minimum Desirable Rural Freeways All All 30 (16 for ramps) Rural Arterial All 0 - 750 750 - 1500 >1500 10 16 30 16 30 -- Rural Collector  All Use above rural arterial criteria. Rural Collector 45 All 10 -- Rural Local All All 10 -- Suburban All All <8,000 106 106 Suburban All All 8,000 - 12,000 106 206 Suburban All All 12,000 - 16,000 106 256 Suburban All All >16,000 206 306 Urban Freeways All All 30 (16 for ramps) Urban All (Curbed)  All Use above suburban criteria insofar as available border width permits. Urban All (Curbed)  All 4 from curb face 6 Urban All (Uncurbed)  All Use above suburban criteria. Urban All (Uncurbed)  All 10 -- 1 Because of the need for specific placement to assist traffic operations, devices such as traffic signal supports, railroad signal/warning device supports, and controller cabinets are excluded from clear zone requirements. However, these devices should be located as far from the travel lanes as practical. Other non-breakaway devices should be located outside the prescribed clear zone or these devices should be protected with barrier. 2 Average ADT over project life, i.e., 0.5 (present ADT plus future ADT). Use total ADT on two-way roadways and directional ADT on one-way roadways. 3 Without barrier or other safety treatment of appurtenances. 4 Measured from edge of travel lane for all cut sections and for all fill sections where side slopes are 1V:4H or flatter. Where fill slopes are steeper than 1V:4H it is desirable to provide a 10 ft area free of obstacles beyond the toe of slope. 5 Desirable, rather than minimum, values should be used where feasible. 6 Purchase of 5 ft or less of additional right-of-way strictly for satisfying clear zone provisions is not required.
  • 12. Roadway Design Manual 2-46 TxDOT 10/2013 Chapter 2 — Basic Design Criteria Section 7 — Drainage Facility Placement appropriate entities prior to in-depth development of Plans, Specifications, and Estimates (P.S.&E.). Design Treatment of Cross Drainage Culvert Ends Cross drainage culverts are defined as those handling drainage across and beneath the highway. Selection of an appropriate end treatment is primarily related to culvert size, culvert end location, side slope rate, terrain characteristics, drift conditions, right-of-way availability, and other consid- erations that may influence treatment selection at individual sites. Roadside safety performance is related to clear zone width and side slope rate. (For a discussion of safety performance and design guidelines related to side slopes, see “Slopes and Ditches”) Where right-of-way availability and economic conditions permit, flatter slopes may be used. Design values for clear zones are shown in “Table 2-12: Clear Zones” for new location and major reconstruction projects. Within the clear zone, sideslopes should preferably be 1V:6H or flatter with 1V:4H as a maximum steepness in most cases. Small Pipe Culverts. A small pipe culvert is defined as a single round pipe with 36 inches [900 mm] or less diameter, or multiple round pipes each with 30 inches [750 mm] or less diameter, each oriented on normal skew. (Note: For arch pipes, use span dimension instead of diameter.) When skews are involved, the definition of a small pipe culvert is modified as shown in Table 2-13: NOTE: Click here to see the metric version of the table. Small pipe culverts with sloping, open ends have been crash tested and proven to be safely travers- able by vehicles for a range of speeds. Small pipe ends should be sloped at a rate of 1V:3H or flatter and should match side slope rate thereby providing a flush, traversable safety treatment. Sin- gle box culverts on normal skew with spans of 36 inches [900 mm] or less may be effectively safety treated just as small pipes (open, match 1V:3H or flatter slope). When vulnerable to run-off-the-road vehicles (i.e., unshielded by barrier), sloped ends should be provided on small pipe culverts regardless of culvert end location with respect to clear zone dimen- sions. For existing culverts, this often entails removing existing headwalls and may include removing the barrier treatment if it is no longer needed to protect an obstacle other than a culvert end. The resultant culvert with sloped end is both safe and inexpensive. Table 2-13: Maximum Diameter of Small Pipe Culvert Skew (degree) Single Pipe (in.) Multiple Pipe (in.) 15 30 30 30 24 24 45 24 21
  • 13. Roadway Design Manual 2-53 TxDOT 10/2013 Chapter 2 — Basic Design Criteria Section 7 — Drainage Facility Placement Side Ditches For side ditches, attention to cross section design can reduce the likelihood of serious injuries during vehicular encroachments. Ditches with the cross sectional characteristics defined in Table 2-15 are preferred and should especially be sought when ditch location is within the clear zone requirements. Where conditions dictate, such as insufficient existing right-of-way to accommodate the preferred ditch cross section or where ditches are located outside the horizontal clearance requirements, other ditch configurations may be used. Typically, guardrail is not necessary where the preferred ditch cross sections are provided. Ditches that include retards to control erosion should be avoided inside the clear zone requirements and should be located as far from the travel lanes as practical unless the retardant is a rock filter dam with side slopes of 1V:6H or flatter. Non-traversable catch or stilling basins should also be located outside the clear zone requirements. Table 2-15: Preferred Ditch Cross Sections - Preferred Maximum Back Slope (Vertical:Horizontal) Given Front Slope (Vertical:Horizontal) V-Shaped Trapezoidal-Shaped 1V:8H 1V:3.5H 1V:2.5H 1V:6H 1V:4H 1V:3H 1V:4H 1V:6H 1V:4H 1V:3H Level 1V:8H
  • 14. Roadway Design Manual 3-4 TxDOT 10/2014 Chapter 3 — New Location and Reconstruction (4R) Design Criteria Section 2 — Urban Streets ble to new location, reconstruction or major improvement projects (such as widening to provide additional lanes). Table 3-1: Geometric Design Criteria for Urban Streets (US Customary) Item Functional Class Desirable Minimum Design Speed (mph) All Up to 60 30 Minimum Horiz. Radius All See Tables 2-3 and 2-4, Figure 2-2 Maximum Gradient (%) All See Table 2-9 Stopping Sight Distance All See Table 2-1 Width of Travel Lanes (ft) Arterial Collector Local 12 12 11-12 111 102 102,3 Curb Parking Lane Width (ft) Arterial Collector Local 12 10 9 104 75 75 Shoulder Width6 (ft), Uncurbed Urban Streets Arterial Collector Local 10 8 -- 4 3 2 Width of Speed Change Lanes (ft) Arterial and Collector Local 11-12 10-12 10 9 Offset to Face of Curb (ft) All 2 1 Median Width All See Medians Border Width (ft) Arterial Collector 20 20 15 15 Right-of-Way Width All Variable 7 Clear Sidewalk Width (ft)10 All 6-88 5 On-Street Bicycle Lane Width All See Chapter 6, Bicycle Facilities Superelevation All See Chapter 2, Superelevation Horizontal Clearance Width All See Table 2-11 Vertical Clearance for New Structures (ft) All 16.5 16.59 Turning Radii - See Chapter 7, Minimum Designs for Truck and Bus Turns
  • 15. Roadway Design Manual 3-5 TxDOT 10/2014 Chapter 3 — New Location and Reconstruction (4R) Design Criteria Section 2 — Urban Streets 1 In highly restricted locations or locations with few trucks and speeds less than or equal to 40 mph, 10 ft permissible. 2 In industrial areas 12 ft usual, and 11 ft minimum for restricted R.O.W. conditions. In non-industrial areas, 10 ft minimum. 3 In residential areas, 9 ft minimum. 4 Where there is no demand for use as a future through lane, 8 ft minimum. 5 In commercial and industrial areas, 8 ft minimum. 6 Where only minimum width is provided, it should be fully surfaced. Where desirable width is provided, partial (not less than minimum width) surfacing or full width surfacing may be provided at the option of the designer. 7 Right-of-way width is a function of roadway elements as well as local conditions. 8 Applicable for commercial areas, school routes, or other areas with concentrated pedestrian traffic. 9 Exceptional cases near as practical to 16.5 ft but never less than 14.5 ft. Existing structures that provide at least 14 ft may be retained. 10 Cross slopes, ramps, and sidewalks shall be in compliance with the Americans with Disabilities Act Accessibility Guidelines and the Texas Accessibility Standards. See Chapter 2, Curb and Curb and Gutters and Sidewalks and Pedes- trian Elements. Table 3-1: Geometric Design Criteria for Urban Streets (US Customary) Table 3-1: Geometric Design Criteria for Urban Streets (Metric) Item Functional Class Desirable Minimum Design Speed (km/h) All Up to 100 50 Minimum Horiz. Radius All See Tables 2-3 and 2-4, Figure 2-2 Maximum Gradient (%) All See Table 2-9 Stopping Sight Distance All See Table 2-1 Width of Travel Lanes (m) Arterial Collector Local 3.6 3.6 3.3-3.6 3.31 3.02 3.02,3 Curb Parking Lane Width (m) Arterial Collector Local 3.6 3.0 2.7 3.04 2.15 2.15 Shoulder Width 6 (m), Uncurbed Urban Streets Arterial Collector Local 3.0 2.4 -- 1.2 0.9 0.6 Width of Speed Change Lanes (m) Arterial and Collector Local 3.3-3.6 3.0-3.6 3.0 2.7 Offset to Face of Curb (m) All 0.6 0.3 Median Width All See Medians Border Width (m) Arterial Collector 6.0 6.0 4.5 4.5 Right-of-Way Width All Variable 7 Clear Sidewalk Width (m)10 All 1.8-2.48 1.5
  • 16. Roadway Design Manual 3-6 TxDOT 10/2014 Chapter 3 — New Location and Reconstruction (4R) Design Criteria Section 2 — Urban Streets For minor rehabilitation projects where no additional lanes are proposed, existing curbed cross sec- tions should be compared with the design criteria in Table 3-1 to determine the practicality and economic feasibility of minor widening to meet the prescribed standards. Where only minimal wid- ening is required to conform with a standard design, it is often cost effective to retain the existing street section, thereby sparing the cost of removing and replacing concrete curb and gutter and curb inlets. For these type projects, Resurfacing, Restoration, and Rehabilitation (3R) guidelines are usually applicable, see Chapter 4. Medians Medians are desirable for urban streets with four or more traffic lanes. The primary functions of medians are to provide the following:  storage space for left-turning vehicles  separation of opposing traffic streams  access control to/from minor access drives and intersection. Medians used on urban streets include the following types:  raised On-Street Bicycle Lane Width All See Chapter 6, Bicycle Facilities Superelevation All See Chapter 2 Superelevation Horizontal Clearance Width All See Table 2-11 Vertical Clearance for New Structures (m) All 5.0 5.09 Turning Radii - See Chapter 7, Minimum Designs for Truck and Bus Turns 1 In highly restricted locations or locations with few trucks and speeds less than or equal to 60 km/h 3.0 m permissible. 2 In industrial areas 3.6 m usual, and 3.3 m minimum for restricted R.O.W. conditions. In non-industrial areas, 3.0 m minimum. 3 In residential areas, 2.7 m minimum. 4 Where there is no demand for use as a future through lane, 2.4 m minimum. 5 In commercial and industrial areas, 2.4 m minimum. 6 Where only minimum width is provided, it should be fully surfaced. Where desirable width is provided, partial (not less than minimum width) surfacing or full width surfacing may be provided at the option of the designer. 7 Right-of-way width is a function of roadway elements as well as local conditions. 8 Applicable for commercial areas, school routes, or other areas with concentrated pedestrian traffic. 9 Exceptional cases near as practical to 5.0 m but never less than 4.4 m. Existing structures that provide at least 4.3 m may be retained. 10 Cross slopes, ramps, and sidewalks shall be in compliance with the Americans with Disabilities Act Accessibility Guidelines and the Texas Accessibility Standards. See Chapter 2, Curb and Curb and Gutters and Sidewalks and Pedes- trian Elements. Table 3-1: Geometric Design Criteria for Urban Streets (Metric)
  • 17. Roadway Design Manual 3-8 TxDOT 10/2014 Chapter 3 — New Location and Reconstruction (4R) Design Criteria Section 2 — Urban Streets Recommended median lane widths for the TWLTL design are as shown in Table 3-2. In applying these criteria on new location projects or on reconstruction projects where widening necessitates the removal of exterior curbs, the median lane width should not be less than 12 ft [3.6 m], and pref- erably the desirable value shown in Table 3-2. Minimum values shown in Table 3-2 are appropriate for restrictive right-of-way projects and improvement projects where attaining the desirable width would necessitate removing and replacing exterior curbing to gain only a small amount of roadway width. Criteria for the potential use of a TWLTL for urban streets are as follows:  future ADT volume of 3,000 vehicles per day for an existing two-lane urban street, 6,000 vehi- cles per day for an existing four-lane urban street, or 10,000 vehicles per day for an existing six-lane urban street  side road plus driveway density of 20 or more entrances per mile [12 or more entrances per kilometer]. When the above two conditions are met, the site should be considered suitable for the use of a TWLTL. For ADT volumes greater than 20,000 vehicle per day or where development is occurring, and volumes are increasing and are anticipated to reach this level, a raised median design should be considered. Seven-lane cross sections should be evaluated for pedestrian crossing capabilities. Median Openings Openings should only be provided for street intersections or at intervals for major developed areas. Spacing between median openings must be adequate to allow for introduction of left-turn lanes and signal detection loops to operate without false calls. A directional opening can be used to limit the number and type of conflict. Figures 3-1 illustrates the different options for the design of a direc- tional median opening. Table 3-2: Median Lane Widths for Two-Way Left-Turn Lanes (US Customary) (Metric) Design Speed Mph Width of TWLTL - ft Design Speed Km/h Width of TWLTL – m Desirable Minimum Desirable Minimum Less than or equal to 40 12 - 14 11 Less than or equal to 60 3.6 - 4.2 3.3 45 - 50 14 12 70 - 80 4.2 3.6 Greater than 50 16 14 Greater than 80 4.8 4.2
  • 18. Roadway Design Manual 3-13 TxDOT 10/2014 Chapter 3 — New Location and Reconstruction (4R) Design Criteria Section 2 — Urban Streets Figure 3-3. Left-Turn Lanes on Urban Streets. Click here to see a PDF of the image. Table 3-3 provides recommended taper lengths, deceleration lengths, and storage lengths for left- turn lanes. These guidelines may also be applied to the design of right-turn lanes. Table 3-3: Lengths of Single Left-Turn Lanes on Urban Streets1 (US Customary) Speed (mph) Deceleration Length2( ft) Taper Length (ft) Storage Length (ft) - Signalized Non-Signalized - Calculated Minimum4 Calculated5 Minimum4 30 160 50 See footnote 3 100 See footnote 5 100
  • 19. Roadway Design Manual 3-14 TxDOT 10/2014 Chapter 3 — New Location and Reconstruction (4R) Design Criteria Section 2 — Urban Streets Deceleration Length. Deceleration length assumes that moderate deceleration will occur in the through traffic lane and the vehicle entering the left-turn lane will clear the through traffic lane at a speed of 10 mph (15 km/h) slower than through traffic. Where providing this deceleration length is 35 215 50 See footnote 3 100 See footnote 5 100 40 275 50 See footnote 3 100 See footnote 5 100 45 345 100 See footnote 3 100 See footnote 5 100 50 425 100 See footnote 3 100 See footnote 5 100 55 510 100 See footnote 3 100 See footnote 5 100 (Metric) Speed (km/h) Deceleration Length2 (m) Taper Length (m) Storage Length (m) Signalized Non-Signalized Calculated Minimum4 Calculated Minimum4 50 50 15 See footnote 3 30 See footnote 5 30 60 65 15 See footnote 3 30 See footnote 5 30 70 85 30 See footnote 3 30 See footnote 5 30 80 105 30 See footnote 3 30 See footnote 5 30 90 130 30 See footnote 3 30 See footnote 5 30 1 The minimum length of a left-turn lane is the sum of the deceleration length plus queue storage. In order to determine the design length, the deceleration plus storage length must be calculated for peak and off-peak periods, the longest total length will be the minimum design length. 2 See Deceleration Length discussion immediately following Table 3-3. 3 See Storage Length Calculations discussion immediately following Table 3-3A. 4 The minimum storage length shall apply when: 1) the required queue storage length calculated is less than the minimum length, or 2) there is no rational method for estimating the left-turn volume. 5 The calculated queue storage at unsignalized location using a traffic model or simulation model or by the following: L = (V/30)(2)(S) where: (V/30) is the left-turn volume in a two-minute interval and other terms are as defined in the Storage Length Calculations discussion immediately following Table 3-3A. Table 3-3: Lengths of Single Left-Turn Lanes on Urban Streets1 (US Customary)
  • 20. Roadway Design Manual 3-15 TxDOT 10/2014 Chapter 3 — New Location and Reconstruction (4R) Design Criteria Section 2 — Urban Streets impractical, it may be acceptable to allow turning vehicles to decelerate more than 10 mph (15km/ h) before clearing the through traffic lane. See Table 3-3A. Storage Length Calculations. The required storage may be obtained using an acceptable traffic model such as the latest version of the HCM software (HCS), SYNCHRO, or VISSIM or other acceptable simulation models. Where such model results have not been applied, the following may be used: L = (V/N)(2)(S) where:  L = storage length in feet (or meters)  V = left-turn volume per hour, vph  N = number of cycles  2 = a factor that provides for storage of all left-turning vehicles on most cycles; a value of 1.8 may be acceptable on collector streets  S = queue storage length, in feet (or meters), per vehicle Table 3-3A Deceleration Lengths for Speed Differentials Greater than 10 mph (15km/h) US Customary (ft) Metric (m) Speed Speed Differential* Speed Speed Differential* (mph) 15 mph 20 mph (km/h) 20 km/h 25km/h 30 110 75 50 40 35 35 160 110 60 60 50 40 215 160 70 75 65 45 275 215 80 95 85 50 345 275 90 115 105 55 425 345 * Speed differential = the difference between a turning vehicle when it clears the through traffic lane and speed of following through traffic. Clearance is considered to have occurred when the turning vehicle has moved laterally a sufficient distance (10 ft. [3m]) so that a following through vehicle can pass without encroaching upon the adjacent through lane. % of trucks S (ft) S (m) <5 25 7.6 5-9 30 9.1
  • 21. Roadway Design Manual 3-16 TxDOT 10/2014 Chapter 3 — New Location and Reconstruction (4R) Design Criteria Section 2 — Urban Streets Dual Left-Turn Deceleration Lanes. For major signalized intersections where high peak hour left-turn volumes are expected, dual left-turn lanes should be considered. As with single left-turn lanes, dual left-turn lanes should desirably include length for deceleration, storage, and taper. Table 3-4 provides recommended lengths for dual left-turn lanes. Right-Turn Acceleration Lanes. Acceleration lanes typically are not used on urban streets. See Section 5, Figure 3-10, for acceleration distances and taper lengths if an acceleration lane may be necessary. Right-Turn Deceleration Lanes. Figure 3-4 illustrates a right-turn deceleration lane. The length of a single right-turn deceleration lane is the same as that for a single left-turn lane (see Table 3-3). 10-14 35 10.7 15-19 40 12.2 Table 3-4: Lengths of Dual Left-Turn Lanes on Urban Streets 1 (US Customary) Speed Deceleration Taper Storage Length (ft) (mph) Length2 (ft) Length (ft) Calculated 3 Minimum4 30 160 100 See footnote 3 100 35 215 100 See footnote 3 100 40 275 100 See footnote 3 100 45 345 150 See footnote 3 100 50 425 150 See footnote 3 100 55 510 150 See footnote 3 100 Table 3-4: Lengths of Dual Left-Turn Lanes on Urban Streets (Metric) Speed Deceleration Taper Storage Length (m) (km/h) Length2 (m) Length (m) Calculated3 Minimum4 50 50 30 See footnote 3 30 60 65 30 See footnote 3 30 70 85 45 See footnote 3 30 80 105 45 See footnote 3 30 90 130 45 See footnote 3 30 See Table 3-3 for footnotes.
  • 22. Roadway Design Manual 3-20 TxDOT 10/2014 Chapter 3 — New Location and Reconstruction (4R) Design Criteria Section 3 — Suburban Roadways Design Speed (mph) All 60 50 Minimum Horizontal Radius All See Tables 2-3 and 2-4 Maximum Gradient (%) All See Table 2-9 Stopping Sight Distance All See Table 2-1 Width of Travel Lanes (ft) Arterial Collector 12 12 111 102 Curb Parking Lane Width (ft) All None Shoulder Width (ft) All 10 4 Width of Speed Change Lanes3 (ft) All 11-12 10 Offset to Face of Curb (ft) All 2 1 Median Width All See Medians, Urban Streets Border Width (ft) Arterial Collector 20 20 15 15 Right-of-Way Width (ft) All Variable4 Sidewalk Width (ft) All 6-85 5 Superelevation All See Chapter 2, Superelevation Horizontal Clearance All See Table 2-11 Vertical Clearance for New Strs. (ft) All 16.5 16.56 Turning Radii All See Chapter 7, Minimum Designs for Truck and Bus Turns 1 In highly restricted locations, 10 ft permissible. 2 In industrial areas 12 ft usual, and 11 ft minimum for restricted R.O.W. conditions. In non-industrial areas, 10 ft minimum. 3 Applicable when right or left-turn lanes are provided. 4 Right-of-way width is a function of roadway elements as well as local conditions. 5 Applicable for commercial areas, school routes, or other areas with concentrated pedestrian traffic. 6 Exceptional cases near as practical to 16.5 ft but never less than 14.5 ft. Existing structures that provide at least 14 ft may be retained. Table 3-5: Geometric Design Criteria for Suburban Roadways (Metric) Item Functional Class Desirable Minimum Design Speed (km/h) All 100 80 Table 3-5: Geometric Design Criteria for Suburban Roadways (US Customary)
  • 23. Roadway Design Manual 3-21 TxDOT 10/2014 Chapter 3 — New Location and Reconstruction (4R) Design Criteria Section 3 — Suburban Roadways Access Control A major concern for suburban roadways is the large number of access points introduced due to commercial development. These access points create conflicts between exiting/entering traffic and through traffic. In addition, the potential for severe accidents is increased due to the high-speed dif- ferentials. Driver expectancy is also violated because through traffic traveling at high speeds does Minimum Horizontal Radius All See Tables 2-3 and 2-4 Maximum Gradient (%) All See Table 2-9 Stopping Sight Distance All See Table 2-1 Width of Travel Lanes (m) Arterial Collector 3.6 3.6 3.31 3.02 Curb Parking Lane Width (m) All None Shoulder Width (m) All 3.0 1.2 Width of Speed Change Lanes3 (m) All 3.3-3.6 3.0 Offset to Face of Curb (m) All 0.6 0.3 Median Width All See Medians, Urban Streets Border Width (m) Arterial Collector 6.0 6.0 4.5 4.5 Right-of-Way Width (m) All Variable4 Sidewalk Width (m) All 1.8-2.45 1.5 Superelevation All See Chapter 2, Superelevation Horizontal Clearance All See Table 2-11 Vertical Clearance for New Strs. (m) All 5.0 5.06 Turning Radii All See Chapter 7, Minimum Designs for Truck and Bus Turns 1 In highly restricted locations, 3.0 m permissible. 2 In industrial areas 3.6 m usual, and 3.3 m minimum for restricted R.O.W. conditions. In non-industrial areas, 3.0 m minimum. 3 Applicable when right or left-turn lanes are provided. 4 Right-of-way width is a function of roadway elements as well as local conditions. 5 Applicable for commercial areas, school routes, or other areas with concentrated pedestrian traffic. 6 Exceptional cases near as practical to 5.0 m but never less than 4.4 m. Existing structures that provide at least 4.3 m may be retained. Table 3-5: Geometric Design Criteria for Suburban Roadways (Metric)
  • 24. Roadway Design Manual 3-25 TxDOT 10/2014 Chapter 3 — New Location and Reconstruction (4R) Design Criteria Section 4 — Two-Lane Rural Highways Section 4 — Two-Lane Rural Highways Overview The general geometric features for two-lane rural highways are provided in this section and are summarized in the following tables and figures:  Figure 3-5: Typical cross section  Table 3-6: Minimum Design Speed for Rural Two-lane Highways: Minimum design speed  Table 3-7. Geometric Design Criteria for Rural Two-Lane Highways: Basic design criteria and cross sectional elements  Table 3-8: Width of Travel Lanes and Shoulders on Rural Two-lane Highways: Lane and shoulder widths  Table 3-9: Minimum Structure Widths For Bridges to Remain in Place on Rural Two-lane Highways: Minimum structure widths that may remain in place. Additional information on structure widths may be obtained in the Bridge Design - LRFD and the Bridge Project Development Manual. Table 3-6: Minimum Design Speed for Rural Two-lane Highways (US Customary) Functional - Minimum Design Speed (mph) for future ADT of: Class Terrain < 400 400-1500 1500-2000 > 2000 Arterial Level Rolling 70 60 Collector Level Rolling 501 402 50 40 50 40 60 50 Local3 Level Rolling 402 30 50 40 50 40 50 40 (Metric) Functional - Minimum Design Speed (km/h) for future ADT of: Class Terrain < 400 400-1500 1500-2000 > 2000 Arterial Level Rolling 110 100 Collector Level Rolling 801 602 80 60 80 60 100 80
  • 25. Roadway Design Manual 3-26 TxDOT 10/2014 Chapter 3 — New Location and Reconstruction (4R) Design Criteria Section 4 — Two-Lane Rural Highways Local3 Level Rolling 602 50 80 60 80 60 80 60 1 A 40 mph [60 km/h] minimum design speed may be used where roadside environment or unusual design considerations dictate. 2 A 30 mph [50 km/h] minimum design speed may be used where roadside environment or unusual design considerations dictate. 3 Applicable only to off-system routes that are not functionally classified at a higher classification. Table 3-7. Geometric Design Criteria for Rural Two-Lane Highways (US Customary) Geometric Design Element Functional Class Reference or Design Value Design Speed All Table 3-6 Minimum Horizontal Radius All Table 2-3and Table 2-4 Max. Gradient All Table 2-9 Stopping Sight Distance All Table 2-1 Width of Travel Lanes All Table 3-8 Width of Shoulders All Table 3-8 Vertical Clearance, New Structures All 16.5 ft1 Horizontal Clearance All Table 2-11 Pavement Cross Slope All Chapter 2, Pavement Cross Slope (Metric) Geometric Design Element Functional Class Reference or Design Value Design Speed All Table 3-6 Minimum Horizontal Radius All Table 2-3and Table 2-4 Max. Gradient All Table 2-9 Stopping Sight Distance All Table 2-1 Width of Travel Lanes All Table 3-8 Width of Shoulders All Table 3-8 Vertical Clearance, New Structures All 5.0 m1 Horizontal Clearance All Table 2-11 Table 3-6: Minimum Design Speed for Rural Two-lane Highways (US Customary)
  • 26. Roadway Design Manual 3-27 TxDOT 10/2014 Chapter 3 — New Location and Reconstruction (4R) Design Criteria Section 4 — Two-Lane Rural Highways Pavement Cross Slope All Chapter 2, Pavement Cross Slope 1 Exceptional cases near as practical to 16.5 ft [5.0 m] but never less than 14.5 ft [4.4 m]. Table 3-8: Width of Travel Lanes and Shoulders on Rural Two-lane Highways (US Customary) Functional Class Design Speed (mph) Minimum Width 1,2(ft) for future ADT of: - - < 400 400-1500 1500-2000 > 2000 Arterial LANES (ft) - All 12 - SHOULDERS (ft) - All 43 43 or 83 83 8 - 103 Collector LANES (ft) - 30 10 10 11 12 - 35 10 10 11 12 - 40 10 10 11 12 - 45 10 10 11 12 - 50 10 10 12 12 - 55 10 10 12 12 - 60 11 11 12 12 - 65 11 11 12 12 - 70 11 11 12 12 - 75 11 12 12 12 - 80 11 12 12 12 - SHOULDERS (ft) - All 24,5 45 85 8 - 105 Local6 LANES (ft) - 30 10 10 11 12 - 35 10 10 11 12 - 40 10 10 11 12 - 45 10 10 11 12 - 50 10 10 11 12 - SHOULDERS (ft) - All 2 4 4 8 Table 3-7. Geometric Design Criteria for Rural Two-Lane Highways (US Customary)
  • 27. Roadway Design Manual 3-28 TxDOT 10/2014 Chapter 3 — New Location and Reconstruction (4R) Design Criteria Section 4 — Two-Lane Rural Highways 1 Minimum surfacing width is 24 ft for all on-system state highway routes. 2 On high riprapped fills through reservoirs, a minimum of two 12 ft lanes with 8 ft shoulders should be pro- vided for roadway sections. For arterials with 2,000 or more ADT in reservoir areas, two 12 ft lanes with 10 ft shoulders should be used. 3On arterials, shoulders fully surfaced. 4 On collectors, use minimum 4 ft shoulder width at locations where roadside barrier is utilized. 5 For collectors, shoulders fully surfaced for 1,500 or more ADT. Shoulder surfacing not required but desirable even if partial width for collectors with lower volumes and all local roads. 6 Applicable only to off-system routes that are not functionally classified at a higher classification. Table 3-8: Width of Travel Lanes and Shoulders on Rural Two-lane Highways (Metric) Functional Class Design Speed (km/h) Minimum Width 1,2 (m) for future ADT of: - - < 400 400-1500 1500-2000 > 2000 Arterial LANES (m) - All 3.6 - SHOULDERS (m) - All 1.23 1.23 or 2.43 2.43 2.4 - 3.03 Collector LANES (m) - 50 3.0 3.0 3.3 3.6 - 60 3.0 3.0 3.3 3.6 - 70 3.0 3.0 3.3 3.6 - 80 3.0 3.0 3.6 3.6 - 90 3.0 3.0 3.6 3.6 - 100 3.3 3.3 3.6 3.6 - 110 3.3 3.3 3.6 3.6 - 120 3.3 3.6 3.6 3.6 - 130 3.3 3.6 3.6 3.6 - SHOULDERS (m) - All 0.64,5 1.25 2.45 2.4-3.05 Local6 LANES (m) - 50 3.0 3.0 3.3 3.6 - 60 3.0 3.0 3.3 3.6 - 70 3.0 3.0 3.3 3.6 - 80 3.0 3.0 3.3 3.6 - SHOULDERS (m) - All 0.6 1.2 1.2 2.4 Table 3-8: Width of Travel Lanes and Shoulders on Rural Two-lane Highways (US Customary)
  • 28. Roadway Design Manual 3-29 TxDOT 10/2014 Chapter 3 — New Location and Reconstruction (4R) Design Criteria Section 4 — Two-Lane Rural Highways The following notes apply to Table 3-8:  Minimum width of new or widened structures should accommodate the approach roadway including shoulders.  See Table 3-9 for minimum structure widths that may remain in place. Basic Design Features This subsection includes information on the following basic design features for two-lane rural highways:  Access Control 1 Minimum surfacing width is 7.2 m for all on-system state highway routes.  On high riprapped fills through reservoirs, a minimum of two 3.6 m lanes with 2.4 m shoulders should be provided for roadway sections. For arterials with 2,000 or more ADT in reservoir areas, two 3.6 m lanes with 3.0 m shoulders should be used.  On arterials, shoulders fully surfaced. 4 On collectors, use minimum 1.2 m shoulder width at locations where roadside barrier is utilized. 5 For collectors, shoulders fully surfaced for 1,500 or more ADT. Shoulder surfacing not required but desirable even if partial width for collectors with lower volumes and all local roads. 6 Applicable only to off-system routes that are not functionally classified at a higher classification. Table 3-9: Minimum Structure Widths For Bridges to Remain in Place on Rural Two-lane Highways (US Customary) Functional Class Roadway Clear Width 1 (ft) for ADT of: - < 400 400-1500 1500-2000 > 2000 Local 20 22 24 28 Collector 22 22 24 28 Arterial Traveled Way + 6 ft (Metric) Functional Class Roadway Clear Width 1 (m) for ADT of: - < 400 400-1500 1500-2000 > 2000 Local 6.0 6.6 7.2 8.4 Collector 6.6 6.6 7.2 8.4 Arterial Traveled Way + 1.8 m 1 Clear width between curbs or rails, whichever is lesser, is considered to be at least the same as approach roadway clear width. Approach roadway width includes shoulders. Table 3-8: Width of Travel Lanes and Shoulders on Rural Two-lane Highways (Metric)
  • 29. Roadway Design Manual 3-31 TxDOT 10/2014 Chapter 3 — New Location and Reconstruction (4R) Design Criteria Section 4 — Two-Lane Rural Highways Minimum passing sight distance values for design of two-lane highways are shown in  Table 3-10. These distances are for design purposes only and should not be confused with other dis- tances used as warrants for striping no-passing zones as shown in the Texas Manual on Uniform Traffic Control Devices. For the design of typical two-lane rural highways, except for level terrain, provision of near continuous passing sight distance (2,680 ft at 80 mph [815 m at 130 km/h]) is impractical. However, the designer should attempt to increase the length and frequency of passing sections where economically feasible. Table 3-10: Passing Sight Distance (US Customary) K-Values for Determining Length of Crest Vertical Curve for Various Passing Sight Distances Design Speed (mph) Minimum Passing Sight Distance for Design (ft) K-Value1 20 710 180 25 900 289 30 1090 424 35 1280 585 40 1470 772 45 1625 943 50 1835 1203 55 1985 1407 60 2135 1628 65 2285 1865 70 2480 2197 75 2580 2377 80 2680 2565 (Metric) K-Values for Determining Length of Crest Vertical Curve for Various Passing Sight Distances Design Speed (km/h) Minimum Passing Sight Distance for Design (m) K-Value1 30 200 46 40 270 84 50 345 138 60 410 195 70 485 272 80 540 338 90 615 438 100 670 520 110 730 617 120 775 695 130 815 769
  • 30. Roadway Design Manual 3-35 TxDOT 10/2014 Chapter 3 — New Location and Reconstruction (4R) Design Criteria Section 4 — Two-Lane Rural Highways Right-Turn Deceleration Lanes. Shoulders 10 ft [3.0 m] wide alongside the traffic lanes generally provide sufficient area for acceleration or deceleration of right-turning vehicles. Where the right turn lane is being constructed in addition to the through lanes and shoulders, the minimum right turn lane width is 10 ft [3.0 m] with a 2 ft [0.6 m] surfaced shoulder. Where speed change lanes are used, they should be provided symmetrically along both sides of the highway for both directions of traffic, thus presenting drivers with a balanced section. A deceleration-acceleration lane on one side of a two-lane highway, such as at a “tee” intersection, results in the appearance of a three-lane highway and may result in driver confusion. In this regard, right-turn speed change lanes are generally inappropriate for “tee” intersection design except where a four lane (2 through, 1 median left turn, 1 right acceleration/deceleration) section is provided. Table 3-11: Guide for Left-Turn Lanes on Two-Lane Highways Opposing Volume (vph) Advancing Volume (vph) - 5 % Left Turns 10 % Left Turns 20 % Left Turns 30 % Left Turns 40 mph [60 km/h] Design Speed 800 330 240 180 160 600 410 305 225 200 400 510 380 275 245 200 640 470 350 305 100 720 515 390 340 50 mph [80 km/h] Design Speed 800 280 210 165 135 600 350 260 195 170 400 430 320 240 210 200 550 400 300 270 100 615 445 335 295 60 mph [100 km/h] Design Speed 800 230 170 125 115 600 290 210 160 140 400 365 270 200 175 200 450 330 250 215 100 505 370 275 240
  • 31. Roadway Design Manual 3-37 TxDOT 10/2014 Chapter 3 — New Location and Reconstruction (4R) Design Criteria Section 5 — Multi-Lane Rural Highways Section 5 — Multi-Lane Rural Highways Overview This section includes guidelines on geometric features for multilane rural highways. The guidelines are outlined in Table 3-12, and Figure 3-6 and Figure 3-7. The guidelines apply for all functional classes of roadways. Table 3-12: Design Criteria For Multilane Rural Highways (Non-controlled Access) (All Functional Classes) (US Customary) Type of Facility Six-Lane Divided Four-Lane Divided Four-Lane Undivided1 Design Speed (Arterials)2 (mph) Min. Min. Min. Flat 703 703 703 Rolling 604 604 604 Lane Width (ft) 12 - Des. Min. Des. Min. Des. Min Median Width (ft) Surfaced 16 4 16 4 Not Applicable - Depressed 76 48 76 48 - Shoulder Outside (ft) 10 85 10 85 10 85 Shoulder Inside (ft) for Depressed Medians 10 4 4 4 Not applicable Min. Structure Widths for Bridges to Remain in place (ft) Depressed Median -- 42 -- 30 -- 56 1 Undivided section may be used on two-lane highways to improve passing opportunities. Most appropriate for use in rolling terrain and/or restricted right of way conditions. 2 For multilane collectors, minimum design speed values are 10 mph less than tabulated. 3 60 mph acceptable for heavy betterment under unusual circumstances. Otherwise, 70 mph should be minimum. 4 50 mph acceptable for heavy betterment under unusual circumstances. Otherwise, 60 mph should be mini- mum for rural design. 5 Applies to collector roads only. On four-lane undivided highways, outside surfaced shoulder width may be decreased to 4 ft where flat (1V:10H), sodded front slopes are provided for a minimum distance of 4 ft from the shoulder edge.
  • 32. Roadway Design Manual 3-38 TxDOT 10/2014 Chapter 3 — New Location and Reconstruction (4R) Design Criteria Section 5 — Multi-Lane Rural Highways Table 3-12: Design Criteria For Multilane Rural Highways (Non-controlled Access) (All Functional Classes) (Metric) Type of Facility - Six-Lane Divided Four-Lane Divided Four-Lane Undivided1 Design Speed (Arterials)2 (km/h) Min. Min. Min. Flat 1103 1103 1103 Rolling 1004 1004 1004 Lane Width (m) 3.6 - Des. Min. Des. Min. Des. Min. - Median Width (m) Surfaced 4.8 1.2 4.8 1.2 Not applicable - Depressed - 22.8 14.4 22.8 14.4 - Shoulder Outside (m) 3.0 2.45 3.0 2.45 3.0 2.45 Shoulder Inside (m) for Depressed Medians 3.0 1.2 1.2 1.2 Not applicable Min. Structure Widths for Bridges to Remain in place (m) Depressed Median -- 12.6 -- 9.0 -- 16.8 1 Undivided section may be used on two-lane highways to improve passing opportunities. Most appropriate for use in rolling terrain and/or restricted right of way conditions. 2 For multilane collectors, minimum design speed values are 20 km/h less than tabulated. 3 100 km/h acceptable for heavy betterment under unusual circumstances. Otherwise, 110 km/h should be minimum. 4 80 km/h acceptable for heavy betterment under unusual circumstances. Otherwise, 100 km/h should be min- imum for rural design. 5 Applies to collector roads only. On four-lane undivided highways, outside surfaced shoulder width may be decreased to 1.2 m where flat (1V:10H), sodded front slopes are provided for a minimum distance of 1.2 m from the shoulder edge.
  • 33. Roadway Design Manual 3-44 TxDOT 10/2014 Chapter 3 — New Location and Reconstruction (4R) Design Criteria Section 5 — Multi-Lane Rural Highways may be acceptable on some low volume rural highways. Also adjustments for grade are given in Table 3-14. Right Turn Deceleration Lane. Right (12 ft [3.6 m] lane with 4 ft [1.2 m] adjacent shoulders) turn lanes provide deceleration or acceleration area for right-turning vehicles. The deceleration length and taper lengths for right turn lanes are the same as for left-turn lanes (See Table 3-13). Adjust- ment factors for grade effects are shown in Table 3-14. Table 3-13: Lengths of Median Turn Lanes Multilane Rural Highways (US Customary) Mainlane Design Speed (mph) Taper Length (ft)1 Deceleration Length (ft)2 - Design Turning ADT (vpd) Minimum Storage Length (ft) 30 50 160 - 150 50 35 50 215 - 300 100 40 50 275 - 500 175 45 100 345 - 750 250 50 100 425 - -- -- 55 100 510 - -- -- 60 150 615 - -- -- 65 150 715 - -- -- 70 150 830 - -- -- 75 150 950 - -- -- 80 150 1075 - -- -- (Metric) Mainlane Design Speed (km/h) Taper Length (m)1 Deceleration Length (m)2 - Design Turning ADT (vpd) Minimum Storage Length (m) 50 15 50 - 150 15 60 15 65 - 300 30 70 30 85 - 500 50 80 30 105 - 750 75 90 30 130 - - - 100 45 200 - - - 110 45 240 - - - 120 45 290 - - - 130 45 330 - - - 1 For low volume median openings, such as those serving private drives or U-turns, a taper length of 100 ft [30 m] may be used regardless of mainlane design speed. 2 Deceleration length assumes that moderate deceleration will occur in the through traffic lane and the vehicle entering the left-turn lane will clear the through traffic lane at a speed of 10 mph (15 km/h) slower than through traffic. Where providing this deceleration length is impractical, it may be acceptable to allow turning vehicles to decelerate more than 10 mph (15km/h) before clearing the through traffic lane.
  • 34. Roadway Design Manual 3-45 TxDOT 10/2014 Chapter 3 — New Location and Reconstruction (4R) Design Criteria Section 5 — Multi-Lane Rural Highways Acceleration Lanes. Acceleration lanes for right-turning and/or left-turning vehicles may be desir- able on multi-lane rural highways. Acceleration distances and taper lengths are provided in Figure 3-10. Adjustments for grade are given in Table 3-14. Figure 3-10. (US). Lengths of Right-Turn Acceleration Lanes. Click US Customary or Metric to see a PDF of the image. Table 3-14: Speed Change Lane Adjustment Factors as a Function of a Grade (US Customary) Deceleration Lanes - Ratio of Length on Grade to Length on Level* Design Speed of Roadway (mph) 3 to 4 % Upgrade 3 to 4 % Downgrade 5 to 6% Upgrade 5 to 6% Downgrade All 0.9 1.2 0.8 1.35 - Acceleration Lanes - Ratio of Length on Grade to Length for Design Speed (mph) of Turning Roadway Curve*
  • 35. Roadway Design Manual 3-46 TxDOT 10/2014 Chapter 3 — New Location and Reconstruction (4R) Design Criteria Section 5 — Multi-Lane Rural Highways Design Speed of Roadway (mph) 20 25 30 35 40 45 50 All Speeds - 3 to 4 % Upgrade 3 to 4% Downgrade 30 ---- ---- ---- ---- ---- ---- ---- ---- 35 ---- ---- ---- ---- ---- ---- ---- 0.7 40 1.3 1.3 1.3 1.3 ---- ---- ---- 0.7 45 1.3 1.3 1.35 1.35 ---- ---- ---- 0.675 50 1.3 1.35 1.4 1.4 1.4 ---- ---- 0.65 55 1.35 1.4 1.45 1.45 1.45 1.45 ---- 0.625 60 1.4 1.45 1.5 1.5 1.5 1.51.55 1.6 0.6 65 1.45 1.5 1.55 1.55 1.6 1..65 1.7 0.6 70 1.5 1.55 1.6 1.65 1.7 1.75 1.8 0.6 75 1.55 1.6 1.65 1.7 1.75 1.8 1.9 0.6 80 1.6 1.65 1.7 1.75 1.8 1.9 2.0 0.6 - 5 to 6% Upgrade 5 to 6% Downgrade 30 ---- ---- ---- ---- ---- ---- ---- ---- 35 ---- ---- ---- ---- ---- ---- ---- 0.6 40 1.5 1.5 1.5 1.6 ---- ---- ---- 0.6 45 1.5 1.55 1.6 1.6 ---- ---- ---- 0.575 50 1.5 1.6 1.7 1.8 1.9 2.0 ---- 0.55 55 1.6 1.7 1.8 1.9 2.05 2.1 ---- 0.525 60 1.7 1.8 1.9 2.05 2.2 2.4 2.5 0.5 65 1.85 1.95 2.05 2.2 2.4 2.6 2.75 0.5 70 2.0 2.1 2.2 2.4 2.6 2.8 3.0 0.5 75 2.2 2.3 2.4 2.65 2.9 3.2 3.5 0.5 80 2.4 2.5 2.6 2.9 2.9 3.6 4.0 0.5 *Ratio in this table multiplied by length of deceleration or acceleration distances in Table 3-13 and Figure 3- 10, gives length of deceleration/acceleration distance on grade. Table 3-14: Speed Change Lane Adjustment Factors as a Function of a Grade (Metric) Deceleration Lanes - Ration of Length on Grade to Length on Level* Design Speed of Roadway (mph) 3 to 4 % Upgrade 3 to 4 % Downgrade 5 to 6% Upgrade 5 to 6% Downgrade Table 3-14: Speed Change Lane Adjustment Factors as a Function of a Grade (US Customary)
  • 36. Roadway Design Manual 3-47 TxDOT 10/2014 Chapter 3 — New Location and Reconstruction (4R) Design Criteria Section 5 — Multi-Lane Rural Highways Travel Lanes and Shoulders Travel Lanes. Travel lanes should be 12 ft [3.6 m] minimum width on rural multilane highways. The Highway Capacity Manual should be consulted to determine the number of lanes to be used in the design. Shoulders. Shoulders should be provided with widths as shown in Table 3-12: Design Criteria For Multilane Rural Highways (Non-controlled Access) (All Functional Classes). All 0.9 1.2 0.8 1.35 - Acceleration Lanes - Ratio of Length on Grade to Length for Design Speed (km/h of Turning Roadway Curve)* Design Speed of Roadway (km/h) 40 50 60 70 80 All Speeds - 3 to 4 % Upgrade 3 to 4% Downgrade 50 ---- ---- ---- ---- ---- ---- 60 1.3 1.4 1.4 ---- ---- 0.7 70 1.3 1.4 1.4 1.5 ---- 0.65 80 1.4 1.5 1.5 1.5 1.6 0.65 90 1.4 1.5 1.5 1.5 1.6 0.6 100 1.5 1.6 1.7 1.7 1.8 0.6 110 1.5 1.6 1.7 1.7 1.8 0.6 120 1.5 1.6 1.7 1.7 1.8 0.6 130 1.5 1.6 1.7 1.7 1.8 0.6 - 5 to 6% Upgrade 5 to 6% Downgrade 50 ---- ---- ---- ---- ---- ---- 60 1.5 1.5 ---- ---- ---- 0.6 70 1.5 1.6 1.7 ---- ---- 0.6 80 1.5 1.7 1.9 1.8 ---- 0.55 90 1.6 1.8 2.0 2.1 2.2 0.55 100 1.7 1.9 2.2 2.4 2.5 0.5 110 2.0 2.2 2.6 2.8 3.0 0.5 120 2.3 2.5 3.0 3.2 3.5 0.5 130 2.6 2.8 3.4 3.6 4.0 0.5 *Ratio in this table multiplied by length of deceleration or acceleration distances in Table 3-13 and Figure 3- 10, gives length of deceleration/acceleration distance on grade. Table 3-14: Speed Change Lane Adjustment Factors as a Function of a Grade (Metric)
  • 37. Roadway Design Manual 3-57 TxDOT 10/2014 Chapter 3 — New Location and Reconstruction (4R) Design Criteria Section 6 — Freeways Table 3-16 shows the spacing to be used between exit ramps and driveways, side streets, or cross streets if practical. The number of weaving lanes is defined as the total number of lanes on the frontage road downstream from the ramp. Driveway or side street access on the frontage road in close downstream proximity to exit ramp ter- minals increases the weaving that occurs on the frontage road and may lead to operational problems. For this reason, it is important to maintain appropriate separation between the intersec- tion of the exit ramp and frontage road travel lanes, and downstream driveways or side streets where practical. It is recognized that there are occasions when meeting these exit ramp separation distance values may not be possible due to the nature of the existing development, such as a high number of closely spaced driveways and/or side streets especially when in combination with closely spaced inter- changes. In these cases, at least 250 ft [75 m] of separation should be provided between the intersection of the exit ramp and frontage road travel lanes and the downstream driveway or side street. Since the use of only 250 ft [75 m] of separation distance may negatively impact the opera- tion of the frontage road, exit ramp, driveway and/or side street traffic, careful consideration should be given to its use. When the 250 ft [75 m] separation distance cannot be obtained, consideration should be given to channelization methods that would restrict access to driveways within this 250 ft [75 m] distance. Refer to the Texas MUTCD for specific types of channelization. There will be similar occasions when meeting the entrance ramp separation distance values may not be possible due to the same existing development conditions associated with exit ramps. In these cases, at least 100 ft [30 m] of separation distance should be provided between the intersec- tion of the entrance ramp and frontage road travel lanes and the upstream driveway or side street. Table 3-16: Desirable Spacing between Exit Ramps and Driveways, Side Streets, or Cross Streets Total Volume (Frtg rd +Ramp) (vph) Driveway or Side Street Volume (vph) Spacing (ft [m]) -- -- Number of Weaving Lanes -- -- 2 3 4 < 2500 < 250 460 [140] 460 [140] 560 [170] -- > 250 520 [160] 460 [140] 560 [170] -- > 750 790 [240] 460 [140] 560 [170] -- > 1000 1000 [300] 460 [140] 560 [170] > 2500 < 250 920 [280] 460 [140] 560 [170] -- > 250 950 [290] 460 [140] 560 [170] -- > 750 1000 [300] 600 [180] 690 [210] -- > 1000 1000 [300] 1000 [300] 1000 [300]
  • 38. Roadway Design Manual 3-64 TxDOT 10/2014 Chapter 3 — New Location and Reconstruction (4R) Design Criteria Section 6 — Freeways Figure 3-16. Typical Highway Railway Railroad Overpass. Click here to see a PDF of the image. Horizontal. The minimum horizontal clearance to bridge parapets and piers should be as shown in Table 2-11: Horizontal Clearances and Figure 3-12. Table 3-18: Roadway Widths for Controlled Access Facilities (US Customary) Type of Roadway Inside Shoulder Width (ft) Outside Shoulder Width2 (ft) Traffic Lanes (ft) Mainlanes: - - - 4-Lane Divided 4 10 24 6-Lane or more Divided 10 10 361 1-Lane Direct Conn.2 2 Rdwy.; 4 Str. 8 14 2-Lane Direct Conn. 2 Rdwy.; 4 Str. 8 24 Ramps2 (uncurbed) 2 Rdwy.; 4 Str. Min. Des. 14 - - 6 8 - Ramps3 (curbed) — — 22 (Metric)
  • 39. Roadway Design Manual 3-65 TxDOT 10/2014 Chapter 3 — New Location and Reconstruction (4R) Design Criteria Section 6 — Freeways Frontage Roads This subsection discusses frontage roads and includes information on the following topics:  Function and Uses  Planning  Design Speed on Frontage Roads  Capacity and Level of Service Function and Uses Frontage roads serve a multitude of purposes in addition to controlling or providing access. Urban frontage roads are multi-functional. They reduce the “barrier” effect of urban freeways since they provide for some of the circulation of the local street system. They provide invaluable operational flexibility, serving as detour routes when mainlane accidents occur, during mainlane maintenance activity, for over-height loads, as bus routes, or during inclement weather. For freeways that include freeway surveillance and control, continuous frontage roads provide the operational flexibility required to manage saturation. Type of Roadway Inside Shoulder Width (m) Outside Shoulder Width2 (m) Traffic Lanes (m) Mainlanes: - - - 4-Lane Divided 1.2 3.0 7.2 6-Lane or more Divided 3.0 3.0 10.81 1-Lane Direct Conn.2 0.6 Rdwy.; 1.2 Str. 2.4 4.2 2-Lane Direct Conn. 0.6 Rdwy.; 1.2 Str. 2.4 7.2 Ramps2 (uncurbed) 0.6 Rdwy.; 1.2 Str. Min. Des. 4.2 - - 1.8 2.4 - Ramps3 (curbed) — — 6.6 1 For more than six lanes, add 12 ft [3.6 m] width per lane. 2 If sight distance restrictions are present due to horizontal curvature, the shoulder width on the inside of the curve may be increased to 8 ft [2.4 m] and the shoulder width on the outside of the curve decreased to 2 ft [0.6 m] (Rdwy) or 4 ft [1.2 m] (Str). 3 The curb for a ramp lane will be mountable and limited to 4 inches [100 mm] or less in height. The width of the curbed ramp lane is measured face to face of curb. Existing curb ramp lane widths of 19 ft [5.7 m] may be retained. Table 3-18: Roadway Widths for Controlled Access Facilities (US Customary)
  • 40. Roadway Design Manual 3-67 TxDOT 10/2014 Chapter 3 — New Location and Reconstruction (4R) Design Criteria Section 6 — Freeways Capacity and Level of Service Although techniques to estimate capacity and level of service on freeways and urban arterials are detailed in the Highway Capacity Manual, these procedures should not be applied directly to front- age roads, as frontage roads have features characteristic of both freeways (i.e., exit and entrance ramps) and urban arterials (i.e., driveways, cross streets and signalized intersections). The follow- ing report was developed to suggest techniques for estimating capacity and level of service on frontage roads. Kay Fitzpatrick, R. Lewis Nowlin, and Angelia H. Parham. Procedures to Determine Frontage Road Level of Service and Ramp Spacing. Research Report 1393-4F, Texas Department of Trans- portation, Texas Transportation Institute, 1996. Research Report 1393-4F contains procedures for the following:  determining level of service on a continuous frontage road section  analyzing frontage road weaving sections  determining spacing requirements for ramp junctions. Frontage Road Design Criteria Design criteria for urban frontage roads are shown in Table 3-1: Geometric Design Criteria for Urban Streets using the collector criteria. Design criteria for suburban frontage roads are shown in Table 3-5: Geometric Design Criteria for Suburban Roadways using the collector criteria. Design criteria for rural frontage roads are shown in Table 3-19: Design Criteria for Rural Frontage Roads. Horizontal clearances are given in Table 2-11: Horizontal Clearances. Any frontage road constructed will be designed to provide one-way operation initially. There may be exceptions in certain isolated instances; however, such exceptions will be considered only where, due to extraordinary circumstances, a one-way pattern would impose severe restrictions on circulation within an area. In those cases where such exceptions are considered, they must be approved by the Design Division at the schematic stage. Table 3-19: Design Criteria for Rural Frontage Roads (US Customary) Design Speed2 (mph) Min. Width1 for Future Traffic Volume of - 0-400 ADT 400-1,500 ADT 1,500-2,000 ADT 2,000 or more ADT LANES (ft) 20 10 10 11 12 25 10 10 11 12 30 10 10 11 12 35 10 10 11 12 40 10 11 11 12
  • 41. Roadway Design Manual 3-68 TxDOT 10/2014 Chapter 3 — New Location and Reconstruction (4R) Design Criteria Section 6 — Freeways 45 10 11 11 12 50 10 11 12 12 55 10 11 12 12 60 11 11 12 12 65 11 11 12 12 70 11 11 12 12 75 11 12 12 12 80 11 12 12 12 SHOULDERS (ft)4 Each Shoulder Two-Way Operation 23 4 8 8 – 10 Inside Shoulder One-Way Operation 23 23 4 44 Outside Shoulder One-Way Operation 23 4 8 8 – 10 1 May retain existing paved width on a reconstruction project if total paved width is 24 ft and operating satisfactorily. 2 Use rural collector criteria (Table 3-6) for determining minimum design speed. 3At locations where roadside barriers are provided, use minimum 4 ft offset from travel lane edge to barrier face. 4 If the one-way frontage road section contains three or more travel lanes, then minimum inside shoulder width is 8 – 10 ft. Table 3-19: Design Criteria for Rural Frontage Roads (Metric) Design Speed2 (km/h) Min. Width1 for Future Traffic Volume of - 0-400 ADT 400-1,500 ADT 1,500-2,000 ADT 2,000 or more ADT LANES (m) 30 3.0 3.0 3.3 3.6 40 3.0 3.0 3.3 3.6 50 3.0 3.0 3.3 3.6 60 3.0 3.3 3.3 3.6 70 3.0 3.3 3.3 3.6 80 3.0 3.3 3.6 3.6 90 3.0 3.3 3.6 3.6 Table 3-19: Design Criteria for Rural Frontage Roads (US Customary)
  • 42. Roadway Design Manual 3-69 TxDOT 10/2014 Chapter 3 — New Location and Reconstruction (4R) Design Criteria Section 6 — Freeways Conversion of Frontage Roads from Two-Way to One-Way Operation Existing frontage roads in some areas are currently operating as two-way facilities. Such two-way operation has the following disadvantages:  Higher crash rates are normally experienced when the frontage roads are two-way. In large part, this is because of the risk of essentially head-on collisions at the ramp terminals.  Increased potential for wrong-way entry to the mainlanes.  The intersections of the frontage roads with the arterials are much more complicated. Left turns from the arterial onto the frontage road must be accommodated from both directions. Accordingly, the signal phasing and sequencing options normally available at signalized dia- mond interchanges cannot be used.  The overall traffic-carrying capacity of the frontage roads is substantially less than if the same facility were re-striped for one-way operation. Existing two-way frontage roads should be converted to one-way operation when one or more of the following conditions occur. 100 3.3 3.3 3.6 3.6 110 3.3 3.3 3.6 3.6 120 3.3 3.6 3.6 3.6 130 3.3 3.6 3.6 3.6 SHOULDERS (m)4 Each Shoulder Two-Way Operation 0.63 1.2 2.4 2.4 – 3.0 Inside Shoulder One-Way Operation 0.63 0.63 1.2 1.24 Outside Shoulder One-Way Operation 0.63 1.2 2.4 2.4 – 3.0 1 May retain existing paved width on a reconstruction project if total paved width is 7.2 m and operating satisfactorily. 2 Use rural collector criteria (Table 3-6) for determining minimum design speed. 3At locations where roadside barriers are provided, use minimum 1.2 m offset from travel lane edge to barrier face. 4 If the one-way frontage road section contains three or more travel lanes, then minimum inside shoulder width is 2.4 – 3.0 m. Table 3-19: Design Criteria for Rural Frontage Roads (Metric)
  • 43. Roadway Design Manual 3-90 TxDOT 10/2014 Chapter 3 — New Location and Reconstruction (4R) Design Criteria Section 6 — Freeways Design Speed There should be a definite relationship between the design speed on a ramp or direct connection and the design speed on the intersecting highway or frontage road. All ramps and connections should be designed to enable vehicles to leave and enter the traveled way of the freeway at no less than 50 percent (70 percent usual, 85 percent desirable) of the freeway’s design speed. Table 3-20 shows guide values for ramp/connection design speed. The design speed for a ramp should not be less than the design speed on the intersecting frontage roads. AASHTO’s A Policy on Geometric Design of Highways and Streets provides additional guidance on the application of the ranges of ramp design speed shown in Table 3-20: Horizontal Geometrics Lane and shoulder widths for ramps and direct connections are shown in Table 3-18. Figure 3-36 provides design criteria for entrance and exit ramp acceleration, deceleration, and taper lengths; adjustment factors for grade effects are shown in Table 3-14: Speed Change Lane Adjust- ment Factors as a Function of a Grade Table 3-20: Guide Values for Ramp/Connection Design Speed as Related to Highway Design Speed* (US Customary) Highway Design Speed (mph) 30 35 40 45 50 55 60 65 70 75 80 Ramp** Design Speed (mph): - Upper Range (85%) 25 30 35 40 45 48 50 55 60 65 70 Mid Range (70%) 20 25 30 33 35 40 45 45 50 55 60 Lower Range (50%) 15 18 20 23 25 28 30 30 35 40 45 (Metric) Highway Design Speed (km/h) 50 60 70 80 90 100 110 120 130 Ramp** Design Speed (km/h): - Upper Range (85%) 40 50 60 70 80 90 100 110 120 Mid Range (70%) 30 40 50 60 60 70 80 90 100 Lower Range (50%) 20 30 40 40 50 50 60 70 80 * For corresponding minimum radius, see Table 2-6. **Loops: Upper and middle range values of design speed generally do not apply. The design speed on a loop should be no less than 25 mph [40 km/h] (185 ft [55 m] minimum radius) based on an emax of 6%. Particular attention should be given to controlling superelevation on loops due to the tight turning radii and speed limitations.
  • 44. Roadway Design Manual 3-91 TxDOT 10/2014 Chapter 3 — New Location and Reconstruction (4R) Design Criteria Section 6 — Freeways Exit and entrance ramp typical details are shown in Figure 3-23, Figure 3-24, Figure 3-25, Figure 3-26, Figure 3-27, Figure 3-28, and Figure 3-29. Channelized (braided) entrance and exit ramps, as typified in Figure 3-28, should be used only where ramp volumes are considerably greater than frontage road traffic such as where stub frontage roads occur. Where used, the exit ramp desirably should cross the frontage road at approximately 90 degrees to minimize wrong-way entry. Passing should be restricted between the crossroad and the channelized area. Figure 3-36. (US). Lengths of Exit and Entrance Ramp Speed Change Lanes. Click US Customary or Metric to see a PDF of the image. Distance Between Successive Ramps The minimum acceptable distance between ramps is dependent upon the merge, diverge and weav- ing operations that take place between ramps as well as distances required for signing. For analysis
  • 45. Roadway Design Manual 3-92 TxDOT 10/2014 Chapter 3 — New Location and Reconstruction (4R) Design Criteria Section 6 — Freeways of these requirements, see the Highway Capacity Manual. Figure 3-37 shows minimum distances between ramps for various ramp configurations. Figure 3-37. Arrangements For Successive Ramps. Click here to see a PDF of the image. Cross Section and Cross Slopes Superelevation rates, as related to curvature and design speed of the ramp or direct connector, are given in Table 3-21. While connecting roadways represent highly variable conditions, as high a superelevation rate as practicable should be used, preferably in the upper half or third of the indi- cated range, particularly in descending grades. Superelevation rates above 8% are shown in Table 3-21 only to indicate the limits of the range. Superelevation rates above 8% are not recommended and a larger radius is preferable. Table 3-21: Superelevation Range for Curves on Connecting Roadways (US Customary) Radius (ft) Range in Superelevation Rate (percent) For Connecting Roadways With Design Speed, mph, of: - 20 25 30 35 40 45 90 2-10 - - - - - 150 2-8 4-10 - - - - 230 2-6 3-8 6-10 - - -
  • 46. Roadway Design Manual 3-93 TxDOT 10/2014 Chapter 3 — New Location and Reconstruction (4R) Design Criteria Section 6 — Freeways The cross slope on portions of connecting roadways or ramps on tangent normally is sloped one way at a practical rate of 1.5% to 2%. The change in pavement edge elevation per given length of connecting roadway or ramp should be that as shown in Table 2-8: Maximum Relative Gradient for Superelevation Transition. The maxi- 310 2-5 3-6 5-9 8-10 - - 430 2-4 3-5 4-7 6-9 9-10 - 540 2-3 3-5 4-6 6-8 8-10 10-10 600 2-3 2-4 3-5 5-7 7-9 8-10 1000 2 2-3 3-4 4-5 5-6 7-9 1500 2 2 2-3 3-4 4-5 5-6 2000 2 2 2 2-3 3-4 4-5 3000 2 2 2 2 2-3 3-4 * See Tables 2-6 and 2-7 for design speeds greater than 45 mph. (Metric) Radius (m) Range in Superelevation Rate (percent) For Connecting Roadways With Design Speed, km/ h, of: - 20 30 40 50 60 70 15 2-10 - - - - - 25 2-9 2-10 - - - - 50 2-8 2-8 4-10 - - - 80 2-6 2-6 3-8 6-10 - - 100 2-5 2-4 3-6 5-8 - - 115 2-3 2-4 3-6 5-8 8-10 - 150 2-3 2-3 3-5 4-7 6-8 - 160 2-3 2-3 3-5 4-7 6-8 10-10 200 2 2-3 2-4 3-5 5-7 6-8 300 2 2-3 2-3 3-4 4-5 5-7 500 2 2 2 2-3 3-4 4-5 700 2 2 2 2 2-3 3-4 1000 2 2 2 2 2 2-3 * See Tables 2-6 and 2-7 for design speeds greater than 70 km/h. Table 3-21: Superelevation Range for Curves on Connecting Roadways (US Customary)
  • 47. Roadway Design Manual 3-94 TxDOT 10/2014 Chapter 3 — New Location and Reconstruction (4R) Design Criteria Section 6 — Freeways mum algebraic difference in pavement cross slope at connecting roadways or ramps should not exceed that set forth in Table 3-22: The cross section of a ramp or direct connector is a function of the following variables:  number of lanes determined by traffic volume  minimum lane and shoulder width  lane balance  where two lanes are required by volume, the provision of parallel merging two lanes onto the mainlanes must be provided at the terminal Sight Distance On all ramps and direct connections, the combination of grade, vertical curves, alignments and clearance of lateral and corner obstructions to vision shall be such as to provide sight distance along such ramps and connections from terminal junctions along the freeway, consistent with the proba- ble speeds of vehicle operation. Sight distance and sight lines are especially important at merge points for ramps and mainlanes or between individual ramps. Table 2-1: Stopping Sight Distance shows recommended stopping sight distances for ramps and direct connections. The sight distance on a freeway preceding the approach nose of an exit ramp should exceed the minimum stopping sight distance for the freeway design speed, preferably by 25 percent or more. Decision sight distance, as discussed in Decision Sight Distance in Chapter 2, is a desirable goal. Table 3-22: Maximum Algebraic Differences in Pavement Cross Slope at Connecting Roadway Terminals (US Customary) (Metric) Design Speed of Exit or Entrance Curve (mph) Maximum Algebraic Dif- ference in Cross Slope at Crossover Line (%) Design Speed of Exit or Entrance Curve (km/h) Maximum Algebraic Dif- ference in Cross Slope at Crossover Line (%) Less than or equal to 20 5.0 to 8.0 Less than or equal to 30 5.0 to 8.0 25 to 30 5.0 to 6.0 40 to 50 5.0 to 6.0 Greater than or equal to 35 4.0 to 5.0 Greater than or equal to 60 4.0 to 5.0
  • 48. Roadway Design Manual 4-4 TxDOT 10/2014 Chapter 4 — Non-Freeway Rehabilitation (3R) Design Criteria Section 2 — Design Characteristics NOTE: Online users can view the metric version of this table in PDF format.          Table 4-1: 3R Design Guidelines for Rural Multilane Highways (Nonfreeway)a (US Customary) Design Element Highway Class - 6-Lane Divided 4-Lane Divided 4-Lane Undivided Design Speedb 50 mph 50 mph 50 mph Lane Width 11 ft 11 ft 11 ft Outside Shoulder 4 ft 4 ft 4 ft Inside Shoulder 4 ft 2 ft N/A Turn Lane Widthc 10 ft 10 ft N/A Horizontal Clearance 16 ft 16 ft 16 ft Bridgesd : Width to be retained 42 ft 28 ft 52 ft a These values are intended for use on rehabilitation projects. However, the designer may select higher values to provide consistency with adjoining roadway sections, to provide consistency with prevailing conditions on similar roadways in the area or to provide operational improvements at specific locations. b Considerations in selecting design speeds for the project should include the roadway alignment characteris- tics as discussed in this chapter. c For two-way left turn lanes, 11 ft – 14 ft usual. d Where structures are to be modified, bridges should meet approach roadway width as a minimum. (Approach roadway width is the total width of the lanes and shoulders.) Greater bridge widths may be appro- priate if the rehabilitation project increases roadway life significantly or if higher design values are selected for the remainder of the project. Existing structure widths less than those shown may be retained if the total lane width is not reduced across or in the vicinity of the structure.
  • 49. Roadway Design Manual 4-5 TxDOT 10/2014 Chapter 4 — Non-Freeway Rehabilitation (3R) Design Criteria Section 2 — Design Characteristics  NOTE: Online users can view the metric version of this table in PDF format.       Table 4-2: 3R Design Guidelines for Rural Two-Lane Highwaysa (US Customary) Design Element Current Average Daily Traffic - 0 – 400 400 -1500 1500 or more Design Speedb 30 mph 30 mph 40 mph Shoulder Width 0 ft 1 ft 3 ft Lane Width 10 ft 11 ft 11 ft Surfaced Roadway 20 ft 24 ft 28 ft Turn Lane Widthc 10 ft 10 ft 10 ft Horizontal Clearance 7 ft 7 ft 16 ft Bridgesd: Width to be retained 20 ft 24 ft 24 fte a These values are intended for use on rehabilitation projects. However, the designer may select higher values to provide consistency with adjoining roadway sections, to provide consistency with prevailing conditions on similar roadways in the area or to provide operational improvements at specific locations. b Considerations in selecting design speeds for the project should include the roadway alignment characteris- tics as discussed in this chapter. c For two-way left turn lanes, 11 ft – 14 ft usual. d Where structures are to be modified, bridges should meet approach roadway width as a minimum. (Approach roadway width is the total width of the lanes and shoulders.) Greater bridge widths may be appro- priate if the rehabilitation project increases roadway life significantly or if higher design values are selected for the remainder of the project. Existing structure widths less than those shown may be retained if the total lane width is not reduced across or in the vicinity of the structure. e For current ADT exceeding 2000, minimum width of bridge to be retained is 28 ft.
  • 50. Roadway Design Manual 4-6 TxDOT 10/2014 Chapter 4 — Non-Freeway Rehabilitation (3R) Design Criteria Section 2 — Design Characteristics NOTE: Online users can view the metric version of this table in PDF format. Design Values Where the existing highway features comply with the design values given in this chapter, the designer may choose not to modify these features. However, where the existing features do not meet these values, upgrading should be to the values shown in this chapter. These values are intended for use on typical rehabilitation projects. The designer may select higher values to provide consistency with adjoining roadway sections, to provide consistency with prevailing conditions on similar roadways in the area or to provide operational improvements at specific locations. Alignment Typically, 3R projects will involve minor or no change in either vertical or horizontal alignment. However, flattening of curves or other improvements may be considered where suggested by acci- dent history, or where existing curvature is inconsistent with prevailing conditions within the Table 4-3: 3R Design Guidelines for Urban Streetsa All Functional Classes (US Customary) Design Element Guideline Design Speedb 30 mph Lane Width 10 ft Turn Lane Widthc 10 ft Parallel Parking Lane Width 7 ft Curb Offset 0 ft Shouldersd,e 2 ft Horizontal Clearance To back of curb or outside edge of shoulder Bridges: Width to be retained Approach roadway, not including shoulders a These values are intended for use on rehabilitation projects. However, the designer may select higher values to provide consistency with adjoining roadway sections, to provide consistency with prevailing conditions on similar roadways in the area or to provide operational improvements at specific locations. b Considerations in selecting design speeds for the project should include the roadway alignment characteris- tics as discussed in this chapter. c For two-way left turn lanes, 11 ft – 14 ft usual. d Minimally 1 ft of shoulder surfaced where lane width is 10 ft thereby providing a 22 ft surfacing width. e Applicable to uncurbed streets.
  • 51. Roadway Design Manual 4-12 TxDOT 10/2014 Chapter 4 — Non-Freeway Rehabilitation (3R) Design Criteria Section 4 — Frontage Roads Section 4 — Frontage Roads Overview Table 4-4: 3R Design Guidelines for Rural Frontage Roads and Table 4-5: 3R Design Guidelines for Urban Frontage Roads show geometric design guidelines for 3R projects on rural and urban freeway frontage roads. These guidelines are acceptable for those projects involving either rehabil- itation of only the frontage road or rehabilitation of the frontage road in conjunction with rehabilitation of the freeway mainlanes. It is not the intent of these 3R frontage road design guide- lines to be used when a freeway section is reconstructed from right of way line to right of way line even though no additional frontage road lanes are added. Complete frontage road reconstruction projects should reference the applicable reconstruction guidelines for the appropriate criteria. Frontage roads are built in some locations initially in a phased construction sequence with the mainlanes to be built when traffic conditions warrant. If the frontage road is serving as the principal roadway pending future mainlane construction, the 3R design guidelines for rural multilane high- ways would be applicable for rehabilitation work on these facilities. Table 4-4: 3R Design Guidelines for Rural Frontage Roadsa (US Customary) Design Element Current Average Daily Traffic - 0 - 1500 1500 or more Design Speed 30 mph 40 mph Lane Width 10 ft 11 ft Shoulder Width Two-Way Operation 1 ft 3 ft Inside Shoulder Width One-Way Operation 1 ft 2 ft Outside Shoulder Width One-Way Operation 1 ft 4 ft Horizontal Clearance 7 ft 16 ft Bridgesb : Width to be retained 22 ft 24 ftc
  • 52. Roadway Design Manual 4-13 TxDOT 10/2014 Chapter 4 — Non-Freeway Rehabilitation (3R) Design Criteria Section 4 — Frontage Roads NOTE: Online users can view the metric version of this table in PDF format. NOTE: Online users can view the metric version of this table in PDF format. a These values are intended for use on rehabilitation projects. However, the designer may select higher values to provide consistency with adjoining roadway sections, to provide consistency with prevailing conditions on similar roadways in the area, or to provide operational improvements at specific locations. b Where structures are to be modified, bridges should meet approach roadway width as a minimum. (Approach roadway width is the total width of the lanes and shoulders.) Greater bridge widths may be appro- priate if the rehabilitation project increases roadway life significantly or if higher design values are selected for the remainder of the project. Existing structure widths less than those shown may be retained if the total lane width is not reduced across or in the vicinity of the structure. c For current ADT exceeding 2000, minimum width of bridge to be retained is 28 ft. Table 4-5: 3R Design Guidelines for Urban Frontage Roadsa (US Customary) Design Element All Traffic Volumes Design Speed 30 mph Lane Width 10 ft Shoulder Width 0 ft inside 2 ft outside Horizontal Clearance Back of curb or edge of shoulder Curb Offset 1 ft either side Bridges: Width to be retained Approach roadway not including shoulders a These values are intended for use on rehabilitation projects. However, the designer may select higher values to provide consistency with adjoining roadway sections, to provide consistency with prevailing conditions on similar roadways in the area, or to provide operational improvements at specific locations. Table 4-4: 3R Design Guidelines for Rural Frontage Roadsa (US Customary)
  • 53. Roadway Design Manual 4-16 TxDOT 10/2014 Chapter 4 — Non-Freeway Rehabilitation (3R) Design Criteria Section 6 — Super 2 Highways Basic Design Criteria Recommended design values are shown in Table 4-6. The length for opening a passing lane (Figure 4-1) should be based on the following: L = WS/2, Where L = Length of taper, W = Lane width, and S = Posted speed. The taper length for closing a passing lane (Figure 4-1) should be based on: L = WS, Where L = Length of taper, W = Lane width, and S = Posted speed. Table 4-6: Design Criteria Minimum Desirable Design Speed See Table 4-2 Horizontal Clearance See Table 4-2 Lane Width 11 ft 12 ft Shoulder Width 3 fta 8 - 10 ft Passing Lane Length 1 mi 1.5 - 2 mib a. Where ROW is limited b. Longer passing lanes are acceptable, but not recommended more than 4 miles. Consider switching the direction if more than 4 miles.
  • 54. Roadway Design Manual 7-5 TxDOT 10/2014 Chapter 7 — Miscellaneous Design Elements Section 2 — Fencing Section 2 — Fencing Right-of-way The procedures for fencing highway right-of-way are in Right of Way Manual Vol. 2 - Right of Way Acquisition. Where additional right-of-way is not required for construction of improvements of existing highways, right-of-way (property) fencing is the responsibility of the land owner. Control of Access Fencing on Freeways Control of access fence should be erected whenever it is necessary to prohibit unrestricted access to the through lanes by pedestrians, animals and/or vehicles. The prohibition of access to the through lanes should be from private property, intercepted local roads and unauthorized crossings from frontage roads to the through lanes. Table 7-1 describes the types of fences that should be used for various conditions. Department standard designs should be used where applicable. Specially designed fences may be necessary in certain areas where sandstorms and snowstorms occur and for other special conditions. Table 7-1: Use of Control of Access Fencing on Freeways Condition Type of Fence Usual Location Urban and suburban areas Chain link fence of 4 ft [1.2 m] usual height or 6 ft [1.8 m] height where necessary for control of pedestrians Variable1 Rural conditions where both large and small animals exist Wire mesh fence with one or more strands of barbed wire ROW line Rural conditions where only large animals exist Barbed wire fence with height of 4 ft or 5 ft [1.2 or 1.5 m] ROW line Control of Vehicles Post and cable fence with closely spaced posts Variable1 1Where frontage roads are provided, control of access fence, when used, should be placed in the outer separa- tion approximately equidistant between the mainlanes and frontage roads and at least 30 ft [9.0 m] from the edge of mainlane pavement. Where the control of access line is at the right-of-way line, the control of access fence may be located at the right-of-way line and will serve a dual function as a right-of-way fence.
  • 55. Roadway Design Manual 7-23 TxDOT 10/2014 Chapter 7 — Miscellaneous Design Elements Section 7 — Minimum Designs for Truck and Bus Turns Alternatives to Simple Curvature To accommodate the longest vehicles, off-tracking characteristics in combination with the large (simple curve) radius that must be used results in a wide pavement area. In this regard, three-cen- tered compound curves, or offset simple curves in combination with tapers, are preferred since they more closely fit the paths of vehicles. Table 7-2 shows minimum edge of pavement designs for right turns to accommodate various design vehicles for turn angles varying from 60 to 120 degrees. (US Customary) Angle of Turn1 (degrees) Design Vehicle Simple Curve Radius Simple Curve Radius with Taper 3-Centered Compound Curve, Symmetric 3-Centered Compound Curve, Asymmetric - - (ft) Radius (ft) Offset (ft) Taper Radii (ft) Offset (ft) Radii (ft) Offset (ft) 60 P 40 - - - - - - - - SU 60 - - - - - - - - WB-40 90 - - - - - - - - WB-50 150 120 3.0 15:1 200-75-200 5.5 200-75-275 2.0-7.0 75 P 35 25 2.0 10:1 100-75-100 2.0 - - - SU 55 45 2.0 10:1 120-45-120 2.0 - - - WB-40 - 60 2.0 15:1 120-45-120 5.0 120-45-195 2.0-6.5 - WB-50 - 65 3.0 15:1 150-50-150 6.5 150-50-225 2.0-10.0 90 P 30 20 2.5 10:1 100-20-100 2.5 - - - SU 50 40 2.0 10:1 120-40-120 2.0 - - - WB-40 - 45 4.0 10:1 120-40-120 5.0 120-40-200 2.0-6.5 - WB-50 - 60 4.0 15:1 180-60-180 6.5 120-40-200 2.0-10.0 105 P - 20 2.5 - 100-20-100 2.5 - - - SU - 35 3.0 - 100-35-100 3.0 - - - WB-40 - 40 4.0 - 100-35-100 5.0 100-55-200 2.0-8.0 - WB-50 - 55 4.0 15:1 180-45-180 8.0 150-40-210 2.0-10.0 120 P - 20 2.0 - 100-20-100 2.0 - - - SU - 30 3.0 - 100-30-100 3.0 - - - WB-40 - 35 5.0 - 120-30-120 6.0 100-30-180 2.0-9.0 - WB-50 - 45 4.0 15:1 180-40-180 8.5 150-35-220 2.0-12.0
  • 56. Roadway Design Manual 7-24 TxDOT 10/2014 Chapter 7 — Miscellaneous Design Elements Section 7 — Minimum Designs for Truck and Bus Turns 1 “Angle of Turn” is the angle through which a vehicle travels in making a turn. It is measured from the extension of the tan- gent on which a vehicle approaches to the corresponding tangent on the intersecting road to which a vehicle turns. It is the same angle that is commonly called the delta angle in surveying terminology. (US Customary) Angle of Turn1 (degrees) Design Vehicle Simple Curve Radius Simple Curve Radius with Taper 3-Centered Compound Curve, Symmetric 3-Centered Compound Curve, Asymmetric (Metric) Angle of Turn1 (degrees) Design Vehicle Simple Curve Radius Simple Curve Radius with Taper 3-Centered Compound Curve, Symmetric 3-Centered Compound Curve, Asymmetric - - (m) Radius (m) Offset (m) Taper Radii (m) Offset (m) Radii (m) Offset (m) 60 P 12 - - - - - - - - SU 18 - - - - - - -- - WB-12 28 - - - - - - - - WB-15 45 29 1.0 15:1 60-23-60 1.7 60-23-84 0.6-2.0 75 P 11 8 0.6 10:1 30-8-30 0.6 - - - SU 17 14 0.6 10:1 36-14-36 0.6 - - - WB-12 - 18 0.6 15:1 36-14-36 1.5 36-14-60 0.6-2.0 - WB-15 - 20 1.0 15:1 45-15-45 2.0 45-15-69 0.6-3.0 90 P 9 6 0.8 10:1 30-6-30 0.8 - - - SU 15 12 0.6 10:1 36-12-36 0.6 - - - WB-12 - 14 1.2 10:1 36-12-36 1.5 36-12-60 0.6-2.0 - WB-15 - 18 1.2 15:1 55-18-55 2.0 36-12-60 0.6-3.0 105 P - 6 0.8 8:1 30-6-30 0.8 - - - SU - 11 1.0 10:1 30-11-30 1.0 - - - WB-12 - 12 1.2 10:1 30-11-30 1.5 30-17-60 0.6-2.5 - WB-15 - 17 1.2 15:1 55-14-55 2.5 45-12-64 0.6-3.0 120 P - 6 0.6 10:1 30-6-30 0.6 - - - SU - 9 1.0 10:1 30-9-30 1.0 - - - WB-12 - 11 1.5 8:1 36-9-36 2.0 30-9-55 0.6-2.7 - WB-15 - 14 1.2 15:1 55-12-55 2.6 45-11-67 0.6-3.6