SlideShare a Scribd company logo
1 of 16
Download to read offline
A GIS Methodology to Map Routes from a Truck Permit Database1
Utilizing a Linear Reference System and Network Analysis2
3
Sinaya Dayan M.S.4
Geospatial Analyst 25
Rahall Transportation Institute6
1900 Third Ave., Huntington, West Virginia 257037
Telephone: 304-521-26878
Email: sdayan@njrati.org9
10
Andrew P. Nichols, Ph.D., P.E.11
Associate Professor12
Weisberg Division of Engineering13
Marshall University14
One John Marshall Drive, Huntington, West Virginia 2575515
Telephone: 304-696-320316
Email: andrew.nichols@marshall.edu17
18
Chih-Sheng Chou, Ph.D.1
19
Research Associate20
Rahall Transportation Institute21
1900 Third Ave., Huntington, West Virginia 2570322
Telephone: 304-696-709823
Email: jchou@njrati.org24
25
Sanghong Yoo, M.S., M.S.E26
GIS Data Coordinator27
Office of Enterprise Web Portal and GIS (EWPG)28
Department of Information Technology (IT)29
Washington Metropolitan Area Transit Authority (WMATA)30
600 Fifth St NW, Washington, DC 2000131
Telephone: 202-962-165332
Email: syoo@wmata.com33
34
Tuan Nguyen, M.S.35
Geospatial Analyst 136
Rahall Transportation Institute37
1900 Third Ave., Huntington, West Virginia 2570338
Telephone: 304-521-266139
Email: tnguyen@njrati.org40
41
Eric Pennington M.A.42
Research Assistant43
Rahall Transportation Institute44
1900 Third Ave., Huntington, West Virginia 2570345
Telephone: 304-521-266546
Email:epennington@njrati.org47
48
49
August 1, 201350
Word count: 4,281 + 10 Figures + 3 Table =7,53151
52
Submitted for presentation at the 93nd Annual Meeting of the53
Transportation Research Board and publication in the Transportation Research Record54
55
1
Corresponding author
ABSTRACT1
Trucking companies can obtain permits from state agencies allowing them to haul oversize and2
overweight loads. Most permit systems assign a specific route to be followed that accounts for3
various network travel restrictions. The routes assigned in these permits can provide a wealth of4
information for different types of transportation analyses. Unfortunately, the permit data is not5
always generated by a system or stored in a manner that allows directly importing the data into a6
GIS platform for mapping purposes. This paper presents a methodology that was developed to7
process archived permit records in West Virginia so that they could be imported into GIS and8
plotted using the existing WVDOT linear reference system (LRS). Since most states manage9
their transportation network in GIS using LRS, this methodology should be widely applicable.10
The automated procedure was able to map 91.4% of the permits that contained route data for the11
month of July 2011.12
INTRODUCTION1
Shipping by commercial truck is an incredibly popular means of transporting goods. However2
this form of transportation does a great deal of damage to the nation’s highways and bridges.3
Often, large pieces of equipment and other cargo are heavy enough that they can’t be divided4
into smaller loads that are within the legal hauling limits for size and weight. In this situation,5
companies can apply for special permits issued by either the state transportation agency or state6
law enforcement that will allow them to exceed the legal limits. Proper evaluation and7
subsequent permitting of these oversize and/or overweight vehicles is necessary to insure that the8
infrastructure is protected by assigning certain travel routes (to avoid bridges with weight9
restrictions) and travel time windows (to avoid congested time periods). The archive of10
historical permit data and the intended route of travel is a useful source of information that can11
be used for planning purposes.12
The original concept for the data analysis discussed in this paper was presented by Chou13
et al. (1) as part of a methodology to estimate the number of overweight trucks on specific14
roadways that do not have the proper permits. The methodology presented in that paper required15
the mapping of oversize/overweight (OSOW) permit data and subsequently matching the permits16
with weigh-in-motion (WIM) stations that the vehicle should have crossed. This paper will17
expand on the permit mapping portion of that methodology. Several researchers have previously18
examined OSOW truck aspects using geographic information systems (GIS). Previous GIS work19
in this field has dealt with designing and developing routing procedures for the permits (2, 3, 4),20
network optimization (5,6), and automation of route selection and permit processing (7). Each of21
these papers uses GIS to either optimize or automate decision making to initially assign a route22
to the permit. These papers however do not explore actually mapping the routes in order to23
determine the spatial occurrence and travel patterns of permitted vehicles for planning and24
analysis purposes.25
The only study that could be found that dealt with mapping archived OSOW permits in26
order to explore this information for planning purposes was conducted by Li et al. (8). Li27
developed an approach to convert the Texas DOT archived OSOW permits into a GIS format.28
They retrieved the data from a centralized database, processed it to be GIS compatible, and29
directly mapped the truck routes in a GIS system. The objectives of their research were to30
identify strategic infrastructure improvements to accommodate the extreme loads and to develop31
optimal routes for certain load groups between the most common origins and destinations using32
the Texas DOT highway network. A significant amount of their effort was in processing and33
correcting the travel route data in the permit record in order to be mapped with GIS.34
The research presented here is different from Li’s research primarily due to the format of35
the data stored for the permit route, which required a different set of procedures to format and36
map the data. The permit data for West Virginia used route numbers and milepost information to37
designate the permitted routes, which was conducive to processing and mapping the routes using38
a Linear Reference System (LRS. The Texas permit data contained non-standardized route39
information (e.g., some route numbers and some route names) and did not contain milepost40
information, so utilizing an LRS was likely not a viable option in their study. The approach41
using LRS reduces the data processing time and allows for a more accurate determination of42
locations where the permit route transitions between roads (used to construct the overall route).43
Most state transportation agencies, including the West Virginia Department of Transportation44
(WVDOT), use a LRS to identify and define the location of their assets on their roadway45
network, so this methodology should be widely applicable. Additionally, this research also46
includes an automated method to identify the direction of travel for each permit on a specific1
roadway segment, which can be useful on certain types of data analysis.2
This paper presents a methodology to map OSOW permits to a LRS using GIS. Although3
it is implemented with permit data from WV, it can be applied to data from other states whose4
route data is not archived in a format readily compatible with an LRS. Thus, an overview of the5
WV permit system is presented in the next section. It is followed by a five-step GIS mapping6
methodology with Linear Reference System functionality. Finally, some sample applications of7
the mapped permit data are presented, including the specific application referenced earlier where8
the permits are assigned to a weigh-in-motion system in order to quantify illegal overweight9
truck activity. Conclusions and future study directions are then derived.10
11
OVERSIZE/OVERWEIGHT PERMIT SYSTEM12
In West Virginia, the process of acquiring a permit for an oversize or overweight truck is13
conducted electronically through the WVDOT website (9). The West Virginia Department of14
Motor Vehicles issues five different permit types; Blanket, Mobile Home Blanket, Seagoing,15
Single Trip Mobile Home, and OS/OW/Superload. The only permit type that is assigned a16
specific route is the OS/OW/Superload permits because their weight limits approach the limits of17
some bridges across the state and require that a certain route be followed. Permit applicants18
submit sufficient information for the WVDOT to evaluate the vehicles, including the vehicle19
model, dimensions, axle spacing, axle and gross weights, desired travel dates, and origin and20
destination (within West Virginia). With user defined origin and destination information, the21
online permit system will generate a recommended route that accounts for various factors, such22
as bridge weight limits, underpass height limits, and other general travel restrictions. This system23
appears to have some linear referencing components as it incorporates milepost information and24
consistent route name information in the “Routes” field. This system, however, does not seem to25
be fully integrated with the WVDOT LRS because the route name does not follow a route26
numbering structure common for an LRS. After the user enters this information, WVDOT27
personnel will review and approve, modify, or deny the permit.28
Of particular interest in this research are the fields in the permit database “Permit ID” (as29
a unique permit identifier), “Origin”, “Destination”, and “Routes”. Table 1 shows the data30
contained in these four fields for a sample permit. As shown in the table, the “Routes” field31
contains the permitted route as a single string of text, which is a set of segment-by-segment32
instructions with the keywords “START”, “TO”, “END”, and “RETURN”. This sample route33
happens to be a roundtrip permit that starts on a state route (WV-25), continues on the interstate34
(I-64), and ends on a US route (US-35) where it intersects with a county route (C33). The35
information after the “RETURN” keyword indicates the route to take from the destination back36
to the origin. The format of this data is not compatible for GIS mapping purposes without37
additional processing, as will be discussed in the next section. Thus, this study discusses a38
methodology that will convert this field of data into a format that is LRS compatible for mapping39
purposes.40
Permit data from WV for the month of July in 2011 were utilized in this analysis. There41
were a total of 17,201 permit records during this time period. There were 3,876 records that42
contained no route information and were excluded from further analysis. These records43
corresponded to the permit types previously discussed that are not assigned to specific routes.44
45
Table 1. Sample Permit Database Record1
Permit ID Origin Destination Routes
10140093 NITRO ST ALBANS START WV-25 W MP PUTNAM 2.19 TO WV-25 MP PUTNAM
1.07 @ I-64 W TO I-64 MP PUTNAM 43.78 @ US-35 S END US-35
@ C33AND RETURN US-35 N @ C33 TO US-35 MP PUTNAM
2.10 @ I-64 E TO I-64 MP PUTNAM 44.53 @ WV-25 E END WV-
25 MP PUTNAM 2.19
2
LINEAR REFERENCE SYSTEMS (LRS)3
Linear referencing is a method of specifying a location as a distance or offset measurement (e.g.,4
milepost) along a linear feature (e.g., a roadway), from a known reference point (e.g., milepost5
0.0) (10). A Linear Referencing System (LRS) is one type of location referencing system with6
the primary benefit of establishing intuitive reference points which are easily identified in the7
field. For example, transportation agencies use routes and mileposts to define the locations of8
assets (e.g., bridges, signs, structures) and events (e.g. road conditions, traffic counts, incidents)9
(11). The WVDOT has developed a Road Inventory Log (RIL) that uses LRS as a reference10
system. WVDOT RIL is a transportation network database defined and maintained in a tabular11
form and records transportation assets or activities on or along the route.12
A key feature of an LRS is a systematic way to define route segments, (i.e., Route ID).13
Each agency defines its own Route ID structure as well as the number designations for each14
component of the Route ID. The current WVDOT structure is shown in Figure 1. The county15
code is a two digit number referring to one of the 55 counties. The road classification is a single16
digit from 0 to 9, where 1 is an Interstate, 2 is a US route, 3 is a State route, etc. The route17
number is a four digit number corresponding to the assigned route number. The sub-route18
number is the assigned route designation for those roadways that have a sub-route designation.19
Generally, primary roadways (road classification 1, 2, and 3) only have a route number and non-20
primary roadways (typically road classification 4 and above) will have both a route number21
(corresponding to its adjacent primary route) and a sub-route number. The supplemental code is22
a code that provides additional information about certain roadway characteristics (e.g., toll roads,23
entrance/exit ramps, spurs). The LRS codes for each road segment in the permit route will be24
automatically assigned within Step 2 of the methodology.25
26
XX X XXXX XX XX
↑ ↑ ↑ ↑ ↑
County Code Road Classification Route Number Sub-route Number Supplemental Code
Figure 1: WVDOT LRS Route ID Structure (12)27
GIS ROUTE MAPPING METHODOLOGY28
To facilitate the analysis and visualization of the permit data, the route information from each29
permit must be mapped in GIS. Since the Routes field in the permit database contains “route”30
and “milepost” information, it is feasible to assign the trips to the WV LRS after the data is31
converted to be compatible.32
The methodology used in this study to convert the route information and plot it consists33
of a five-step process, summarized in Figure 2. Step 1 seeks to decompose the single string of34
text into specific transition points along the permit route, which would occur when the vehicle35
must turn onto a new route. Step 2 creates a unique Route ID for every transition point, which36
corresponds to the Route IDs used in the WVDOT LRS. In Step 3, all transition points in each37
permit are plotted on a map. These plotted points are then connected and the segments merged to1
form a continuous permit route in Step 4. Finally, Step 5 assigns the cardinal direction of travel2
on each tangent segment in the permit route. Step 5 is not essential for plotting purposes, but it3
information that is useful in some types of analysis.4
5
Figure 2: Methodology Flowchart6
7
Step 1. ROUTES Field Decomposition8
This step decomposes the continuous text string from the Routes field into segments9
corresponding with a transition point in the permit trip. A Visual Basic program was written to10
search for key words in the route string, including START, RETURN, TO, and END, which are11
then used to partition the string. This exercise is continued until the end of the string to get a12
complete list of transition points associated with a permit.13
The transition points of each permit are also identified with the order in which the14
transition points occurred, which is important in Step 4 when the continuous route is constructed.15
The program generates a new field called “order” and assigns the sequence value for each16
transition point. This process served as the initial stage for LRS assignment and GIS transition17
point plotting and permit mapping.18
19
Step 2. LRS Assignment1
For each transition point in the route, the text content is further evaluated to assign an 11-digit2
Route ID that corresponds to the WVDOT LRS format. The text in each transition point field3
was processed automatically using a Visual Basic script that utilized lookup tables and logic4
statements to determine each individual component of the Route ID. Each component had a5
separate lookup table that contained all possible values from the WVDOT LRS. The individual6
components were then concatenated to form the overall Route ID, which is shown in Table 2.7
8
Table 2: LRS Route ID Generation for Sample Permit ID 101400939
General
Road Name
County
Road
Classification
Route
Number
Sub
Route
Supplemental
Code
Concatenated
11-digit Route ID
I-64
40
(Putnam)
1
(Interstate)
0064
(64)
00
(none)
00
(n/a)
40100640000
US 35
40
(Putnam)
2
(US Route)
0035
(35)
00
(none)
00
(n/a)
40200350000
WV 25
40
(Putnam)
3
(State Route)
0025
(25)
00
(none)
00
(n/a)
40300250000
10
The results of Steps 1 and 2 are a new data table similar to the one in Table 3, which lists11
the order, Route ID and milepost for the decomposed text of Permit ID 10140093, all necessary12
components for LRS/GIS plotting.13
14
Table 3. LRS Compatible Transition Points for Permit ID 1014009315
Transition Point Order Route ID Milepost
WV-25 W MP PUTNAM 2.19 1 40300250000 2.19
WV-25 MP PUTNAM 1.07 @ I-64 W 2 40300250000 1.07
I-64 MP PUTNAM 43.78 @ US-35 S 3 40100640000 43.78
US-35 MP PUTNAM 0.00 @ C33 4 40200350000 0
US-35 N MP PUTNAM 0.00 @ C33 5 40200350000 0
US-35 MP PUTNAM 1.59 @ I-64 E 6 40200350000 1.59
I-64 MP PUTNAM 44.53 @ WV-25 E 7 40100640000 44.53
WV-25 MP PUTNAM 2.19 8 40300250000 2.19
16
Table 4 summarizes the records that were processed in Steps 1 and 2. The scripts17
automatically processed 12,178 of the 13,325 records that contained route information. There18
were 1,147 records that could not be automatically processed and required manual inspection.19
Problems with these records included missing key words (i.e. START, RETURN, TO, END),20
missing transition point information or milepost in route description, or inconsistent descriptive21
structure (e.g., missing the @ indicator for an intersection). Of these 1,147 records, 905 were22
successfully coded manually and 242 had insufficient information to generate a Route ID or23
milepost and could not be processed or included for further analysis. The resulting permit24
database of 13,083 unique records was utilized for Steps 3 and 4.25
26
27
28
29
30
31
Table 4: Summary of Record Processing Statistics after Steps 1 and 21
Description Frequency
Total Records for July 2011 with Route Information 13,325
Successfully Processed with Automated Procedure in Step 1 and Step 2 12,178 (91.4%)
Required Manual Processing 1,147 (8.6%)
Manual Route ID Generation Successful 905
Insufficient Route or Milepost Information and Excluded 242
2
Step 3. Plotting Transition Points Using LRS3
The plotting of transition points from the permits was possible using the “make route event4
layer” in the LRS tools in ArcGIS. This tool uses a reference network, in this case the WVDOT5
LRS, to locate events or points along the network, using the Route ID field and the milepost6
information for each transition point as a reference. The WVDOT network already includes the7
Route ID field for proper matching as well as the calculated measurements, referred to as M8
values, along each of the routes. This allows the identification of specific routes and the location9
of transition points along such routes, providing alternative location determination to records or10
features without the use of longitude or latitude information. This layer was needed for the route11
generation and automated mapping process carried out in Step 4. The plotted points for the12
sample permit are shown in Figure 4.13
The GIS process generated a point feature class for all successfully located transition14
points as well as an error field flagging transition points that could not be automatically located15
on the LRS due to a problem with the Route ID or with the milepost. Two types of errors were16
generated in the LRS plotting process, “Route Not Found” and “Route Measure Not Found”.17
The Route Not Found error generally indicates a segment where the 11-digit Route ID generated18
in Step 2 does not correspond to an actual Route ID in the WVDOT LRS. This is most likely19
caused by a clerical error in the reference WVDOT network. The Route Measure Not Found20
error indicates that the milepost in the transition point is outside the milepost limits in the21
WVDOT LRS. This generally occurs near the end of a route (at the maximum milepost or county22
line) or if the milepost information assigned by the permit system is invalid. Example for this23
error type is presented in Figure 3: Example for LRS Error “Route Measure Not Found”. In this24
example, a transition point within a permit was assigned the milepost 7.45, however, the route25
only goes up to milepost 6.95 which yields an LRS plotting error. All errors were manually26
inspected and resolved in an iterative process until all permit records were properly matched with27
the route network.28
1
Figure 3: Example for LRS Error “Route Measure Not Found”.2
3
4
Figure 4: Permit 10140093 Transition Point Plot in GIS in Step 35
6
Step 4. Connecting Transition Points to Create Continuous Route7
After the transition points are plotted along the road network, a continuous permit route is8
created by connecting these points along the mapped roadway, as opposed to a straight line9
connecting the points. A batch process was developed within ESRI ArcGIS Model Builder and10
utilized Network Analyst and Tele Atlas Premium StreetMap North America to automatically11
Route ID: 0420019000
Milepost: 6.95
Route ID: 0420019000
Milepost: 0.00
Route ID: 0420019000
Milepost: 7.45
Route Measure Not Found
construct the continuous routes (13, 14). The batch process is illustrated in Figure 5. Model1
elements include an iterator to process all permits in the database and their transition points. The2
model integrated “MakeRouteLayer”, “AddLoactions”, and “Solve” tools from the Network3
Analyst extension in ArcGIS. The first tool creates a route analysis layer, namely “outputRoute”,4
for determining the optimized routes between a set of transition points. The output is carried5
over to the next tool, AddLocations, which adds the transition points (RouteStops in Figure) to6
the network created by the first tool. All transition points are sorted by the order value assigned7
in Step 1 for a hierarchical assignment. Both the outputs for the AddLocations and8
MakeRouteLayer tools are analyzed to solve the network analysis layer. The “Solve” tool9
determines the optimal route by identifying the barriers and constraints within the network10
transition points, and accounting for their hierarchical order by which their connectivity is11
determined. The final output, “NetworkAnalystLayerSolved” captures the actual traveled route12
for each permit within the database, accounting for all transition points.13
Figure 6 shows Permit 101400093 plotted in GIS after connecting the transition points in14
Step 4. Notice that the plotted route follows the mapped roadways rather than the straight line15
distance, which would have missed the ramps connecting I-64 to US 35.16
17
18
Figure 5: GIS Batch Routing Model for Step 419
1
Figure 6: Permit 10140093 GIS Plot in Step 42
3
Step 5. Assigning direction of travel to route segments4
It was desirable to assign the direction of travel to certain segments of the permit route in order5
to facilitate future directional analysis. In order to derive the directional information of a route at6
any specific location, the permit was segmented in order to identify tangent sections. Once the7
straight segments were identified, the Linear Directional Mean (LDM) was calculated using the8
corresponding ESRI ArcGIS Spatial Statistics tool. The LDM computes the azimuth for a line,9
referenced from north (0 degrees) in a clockwise direction. A Python script was used to convert10
the azimuth to one of the four primary directions – North, South, East, West. Figure 7 illustrates11
the azimuths assigned to each travel direction of the segment of I-64 in Permit 10140093.12
13
14
Figure 7: Assigned Azimuth for I-64 Segment from Permit 1014009315
Permit 10140093
Permit 10140093
SAMPLE APPLICATIONS1
Matching Permits to WIM Stations2
This methodology was applied in previous research to help estimate the percentage of3
overweight trucks on certain roads that do not have proper permits. This was accomplished by4
integrating the permit data discussed here with weight data measured in the field at specific5
locations. In West Virginia, truck weight data is collected at 73 weigh-in-motion (WIM)6
stations. The physical location of the WIM stations was known, so by plotting their location in7
GIS and identifying the permits that should have crossed the corresponding tangent roadway8
section, the permit data and the WIM data could be directly compared. Figure 8. Frequency of9
Permits Crossing WIM Sites (July 2011) shows the frequency of unique permits that crossed10
each WIM station during July 2011. It is easy to see that the WIM sites located along interstates11
and other primary routes experienced more permitted overweight activity. By comparing the12
quantity of permits crossing the WIM with the actual overweight truck counts crossing the WIM,13
compliance rates were estimated. This information is useful for overweight enforcement14
purposes.15
16
17
Figure 8. Frequency of Permits Crossing WIM Sites (July 2011)18
19
Statewide Roadway Permit Frequency1
To protect the highway infrastructure and prioritize maintenance activities, a map illustrating the2
routes that overweight trucks are taking is useful. Figure 9 illustrates the mapped results from the3
13,083 permits that were processed for July 2011. The roadway segments with the highest4
frequency of permitted loads can easily be identified, which tend to be the interstate system. I-795
between Morgantown, WV and the Pennsylvania border showed the highest number of truck6
permit loads in the range of 1,241 to 2,485 permits during the study period. Heavy truck loaded7
roadway segments warrant frequent inspections to protect the safety of the infrastructure.8
Additionally, this information might assist the authorities in selecting segments for permit9
compliance enforcement.10
11
12
Figure 9. Statewide Frequency of Permits on Roadway Network (July 2011)13
14
Origin-Destination Analysis15
An origin-destination (OD) matrix can be created to identify all OD pairs, which can be used to16
identify frequently used travel paths, which can be useful in planning new facilities or upgrading17
existing ones. As an example, all permits with an origin in the vicinity of Nitro, WV were18
plotted, both as Euclidean Distance (Figure 10) and the permitted routes (Figure 11). The data in19
Figure 10 could have been plotted without the data processing described in this paper since it20
does not utilize the route information. Figure 11: Actual Route Distribution of Permit OD Pairs1
Leaving Nitro,WV (July 2011) can only be derived after processing the route data, using the2
procedure discussed here.3
4
5
Figure 10: Euclidean Distribution of Permit OD Pairs Leaving Nitro, WV (July 2011)6
7
8
Figure 11: Actual Route Distribution of Permit OD Pairs Leaving Nitro,WV (July 2011)9
10
CONCLUSION11
This paper presents a methodology to convert oversize/overweight permit data into a format12
compatible with a LRS for GIS mapping purposes. Overall, the methodology resulted in13
successful mapping of 91.4% of the permits that contained route information during July 2011 in14
West Virginia. This methodology should be widely applicable, as most state transportation15
agencies manage their assets with a LRS and have network established.16
Results from the mapped permit routes can be integrated with other databases to derive17
valuable knowledge for traffic analysis and planning purposes. For example, the integration18
between permit routes and WIM locations can facilitates the derivation of illegal overweight19
truck activity. This can improve enforcement mechanisms, but can also contribute to roadway20
planning, construction, and maintenance, creating a safer infrastructure network.21
With this analysis, the actual route that is occupied during travel can be determined,1
rather than using a less exact Euclidian distance. The mapping procedure can also provide2
information on OSOW permit travel frequency, which could be used in economic development3
analysis, land use planning, transportation planning, and other analyses.4
5
ACKONWLEDGEMENTS6
This work was supported by the West Virginia Department of Transportation, Division of7
Highways and the Nick J. Rahall II Appalachian Transportation Institute at Marshall University.8
The contents of this paper reflect the views of the authors, who are responsible for the facts and9
the accuracy of the data presented herein, and do not necessarily reflect the official views or10
policies of the sponsoring organizations. These contents do not constitute a standard,11
specification, or regulation.12
13
14
REFERENCES15
1 Chou, C.-S., A.P. Nichols, S. Yoo, and M. Cetin, "Methodology to Estimate Percent of
Overweight Trucks Without Proper Permits," Proceeding of Transportation Research Board
92nd Annual Meeting, no. 13-4579. 2013.
2 Osegueda, R., A. Garcia-Diaz, S. Ashur, O. Melchor, S.-H. Chang, C. Carrasco, and A.
Kuyumcu, "GIS-based network routing procedures for overweight and oversized
vehicles," Journal of Transportation Engineering 125, no. 4 pp.324-331, 1999.
3 Nord, M., and G. Hovey. "Load Rating and Permit Vehicle Routing." In Eighth
Transportation Research Board Conference on Bridge Management, no. L-5, IBMC-058.
1999.
4 Datla, S.K., R.S. Moorthy, and K.K. Rao, "A GIS for Routing of Oversized and Hazardous
Material Carrying Vehicles," Proceeding of Map Asia Conference, pp.1-12. 2004.
5 Adams, T.M., S. Malaikrisanachalee, C. Blazquez, S. Lueck, and A. Vonderohe, "Enterprise-
wide data integration and analysis for oversize/overweight permitting," Journal of computing
in civil engineering 16, no. 1 pp.11-22, 2002.
6 Ray, J.J. "A web-based spatial decision support system optimizes routes for
oversize/overweight vehicles in Delaware," Decision Support Systems 43, no. 4 pp.1171-1185,
2007.
7 Adams, T.M., S. Malaikrisanachalee, C. Blazquez, and A. Vonderohe, "GIS-Based
Automated Oversize/Overweight Permit Processing," Computing in Civil and Building
Engineering, pp.209-216. ASCE, 2000.
8 Li, Y., J.T. Le, D.R. Middleton, and C.A. Quiroga, "Mapping Oversized and Overweight
Truck Routes with Procedure Based on Geographic Information Systems," Transportation
Research Record: Journal of the Transportation Research Board 2291, no. 1 pp.8-16, 2012.
9 “Hauling Permits,” Website, West Virginia Department of Transportation, accessed June,
2013,
http://www.transportation.wv.gov/highways/maintenance/hauling_permits/Pages/default.aspx
10 Federal Highway Administration, “Federal Highway Administration Linear Referencing
Practitioners Guidebook,” GIS/Trans Ltd, 1999.
11 Curtin, K.M. “Linear Referencing,” The Encyclopedia of Geographic Information Science,
pp. 261-264. K. Kemp ed. Sage Publications, 2008.
12 “Geospatial Transportation Information,” Website, West Virginia Department of
Transportation, accessed June, 2013,
http://www.transportation.wv.gov/highways/programplanning/gti/Pages/default.aspx
13 “ESRI 2011. ArcGIS Desktop: Release 10.1.,” Redlands, CA: Environmental Systems
Research Institute, 2011.
14 “ESRI ArcPad 10 StreetMap Premium Tele ATLAS North America,” Redlands, CA:
Environmental Systems Research Institute. 2010.

More Related Content

What's hot

Hsr competes with caltrain - planning workshop document
Hsr competes with caltrain - planning workshop documentHsr competes with caltrain - planning workshop document
Hsr competes with caltrain - planning workshop documentAdina Levin
 
Utilizing GIS to Develop a Non-Signalized Intersection Data Inventory for Saf...
Utilizing GIS to Develop a Non-Signalized Intersection Data Inventory for Saf...Utilizing GIS to Develop a Non-Signalized Intersection Data Inventory for Saf...
Utilizing GIS to Develop a Non-Signalized Intersection Data Inventory for Saf...IJERA Editor
 
Potomac River Crossing Data Development Study
Potomac River Crossing Data Development StudyPotomac River Crossing Data Development Study
Potomac River Crossing Data Development StudyFairfax County
 
2010 10 14_bay_bridge_report_v5_d
2010 10 14_bay_bridge_report_v5_d2010 10 14_bay_bridge_report_v5_d
2010 10 14_bay_bridge_report_v5_dE'ville Eye
 
7 ncdot&u senal deladvcurvahor 2010 150p
7   ncdot&u senal deladvcurvahor 2010 150p7   ncdot&u senal deladvcurvahor 2010 150p
7 ncdot&u senal deladvcurvahor 2010 150pSierra Francisco Justo
 
Architecture of the global navigation satellite system for maritime applications
Architecture of the global navigation satellite system for maritime applicationsArchitecture of the global navigation satellite system for maritime applications
Architecture of the global navigation satellite system for maritime applicationsTELKOMNIKA JOURNAL
 
Tftn findings to date esri uc
Tftn findings to date esri ucTftn findings to date esri uc
Tftn findings to date esri ucKSI Koniag
 
Impact of Lane Occupancy on Urban Roads
Impact of Lane Occupancy on Urban RoadsImpact of Lane Occupancy on Urban Roads
Impact of Lane Occupancy on Urban RoadsScientific Review SR
 
Study of Road Maintenance Fund Needs Approach with Link Based and Network Based
Study of Road Maintenance Fund Needs Approach with Link Based and Network BasedStudy of Road Maintenance Fund Needs Approach with Link Based and Network Based
Study of Road Maintenance Fund Needs Approach with Link Based and Network Basedijtsrd
 
Transportation planning 1
Transportation planning 1Transportation planning 1
Transportation planning 1EngrABRahimoon
 
Online Bus Arrival Time Prediction Using Hybrid Neural Network and Kalman fil...
Online Bus Arrival Time Prediction Using Hybrid Neural Network and Kalman fil...Online Bus Arrival Time Prediction Using Hybrid Neural Network and Kalman fil...
Online Bus Arrival Time Prediction Using Hybrid Neural Network and Kalman fil...IJMER
 
STUDY ON HISTORICAL COMMUTER TRAFFIC PATTERN OF DHAKA-CHITTAGONG HIGHWAY (NH-...
STUDY ON HISTORICAL COMMUTER TRAFFIC PATTERN OF DHAKA-CHITTAGONG HIGHWAY (NH-...STUDY ON HISTORICAL COMMUTER TRAFFIC PATTERN OF DHAKA-CHITTAGONG HIGHWAY (NH-...
STUDY ON HISTORICAL COMMUTER TRAFFIC PATTERN OF DHAKA-CHITTAGONG HIGHWAY (NH-...IAEME Publication
 
Poster: Exploring the shortest route options: Applying Environmental Indicato...
Poster: Exploring the shortest route options: Applying Environmental Indicato...Poster: Exploring the shortest route options: Applying Environmental Indicato...
Poster: Exploring the shortest route options: Applying Environmental Indicato...Matthew Pulis
 
Ite Vancourver Nelson Corridors
Ite Vancourver Nelson CorridorsIte Vancourver Nelson Corridors
Ite Vancourver Nelson Corridorsnelsondonnac
 
Traffic study on road network to identify the short term road improvement pro...
Traffic study on road network to identify the short term road improvement pro...Traffic study on road network to identify the short term road improvement pro...
Traffic study on road network to identify the short term road improvement pro...iaemedu
 

What's hot (19)

Virginia
VirginiaVirginia
Virginia
 
Hsr competes with caltrain - planning workshop document
Hsr competes with caltrain - planning workshop documentHsr competes with caltrain - planning workshop document
Hsr competes with caltrain - planning workshop document
 
Utilizing GIS to Develop a Non-Signalized Intersection Data Inventory for Saf...
Utilizing GIS to Develop a Non-Signalized Intersection Data Inventory for Saf...Utilizing GIS to Develop a Non-Signalized Intersection Data Inventory for Saf...
Utilizing GIS to Develop a Non-Signalized Intersection Data Inventory for Saf...
 
Potomac River Crossing Data Development Study
Potomac River Crossing Data Development StudyPotomac River Crossing Data Development Study
Potomac River Crossing Data Development Study
 
2010 10 14_bay_bridge_report_v5_d
2010 10 14_bay_bridge_report_v5_d2010 10 14_bay_bridge_report_v5_d
2010 10 14_bay_bridge_report_v5_d
 
7 ncdot&u senal deladvcurvahor 2010 150p
7   ncdot&u senal deladvcurvahor 2010 150p7   ncdot&u senal deladvcurvahor 2010 150p
7 ncdot&u senal deladvcurvahor 2010 150p
 
Trb2012 slideshow final
Trb2012 slideshow finalTrb2012 slideshow final
Trb2012 slideshow final
 
Architecture of the global navigation satellite system for maritime applications
Architecture of the global navigation satellite system for maritime applicationsArchitecture of the global navigation satellite system for maritime applications
Architecture of the global navigation satellite system for maritime applications
 
Tftn findings to date esri uc
Tftn findings to date esri ucTftn findings to date esri uc
Tftn findings to date esri uc
 
Impact of Lane Occupancy on Urban Roads
Impact of Lane Occupancy on Urban RoadsImpact of Lane Occupancy on Urban Roads
Impact of Lane Occupancy on Urban Roads
 
Study of Road Maintenance Fund Needs Approach with Link Based and Network Based
Study of Road Maintenance Fund Needs Approach with Link Based and Network BasedStudy of Road Maintenance Fund Needs Approach with Link Based and Network Based
Study of Road Maintenance Fund Needs Approach with Link Based and Network Based
 
Fdlp presentation
Fdlp presentationFdlp presentation
Fdlp presentation
 
Transportation planning 1
Transportation planning 1Transportation planning 1
Transportation planning 1
 
Online Bus Arrival Time Prediction Using Hybrid Neural Network and Kalman fil...
Online Bus Arrival Time Prediction Using Hybrid Neural Network and Kalman fil...Online Bus Arrival Time Prediction Using Hybrid Neural Network and Kalman fil...
Online Bus Arrival Time Prediction Using Hybrid Neural Network and Kalman fil...
 
STUDY ON HISTORICAL COMMUTER TRAFFIC PATTERN OF DHAKA-CHITTAGONG HIGHWAY (NH-...
STUDY ON HISTORICAL COMMUTER TRAFFIC PATTERN OF DHAKA-CHITTAGONG HIGHWAY (NH-...STUDY ON HISTORICAL COMMUTER TRAFFIC PATTERN OF DHAKA-CHITTAGONG HIGHWAY (NH-...
STUDY ON HISTORICAL COMMUTER TRAFFIC PATTERN OF DHAKA-CHITTAGONG HIGHWAY (NH-...
 
Poster: Exploring the shortest route options: Applying Environmental Indicato...
Poster: Exploring the shortest route options: Applying Environmental Indicato...Poster: Exploring the shortest route options: Applying Environmental Indicato...
Poster: Exploring the shortest route options: Applying Environmental Indicato...
 
Ite Vancourver Nelson Corridors
Ite Vancourver Nelson CorridorsIte Vancourver Nelson Corridors
Ite Vancourver Nelson Corridors
 
MetroRapid Transit Signal Priority—Using Technology to Improve Service Quality
MetroRapid Transit Signal Priority—Using Technology to Improve Service QualityMetroRapid Transit Signal Priority—Using Technology to Improve Service Quality
MetroRapid Transit Signal Priority—Using Technology to Improve Service Quality
 
Traffic study on road network to identify the short term road improvement pro...
Traffic study on road network to identify the short term road improvement pro...Traffic study on road network to identify the short term road improvement pro...
Traffic study on road network to identify the short term road improvement pro...
 

Viewers also liked

Break the Cycle Final Logo
Break the Cycle Final LogoBreak the Cycle Final Logo
Break the Cycle Final LogoMaggie Currie
 
National Symposium on Student Retention 2015 Presentation
National Symposium on Student Retention 2015 PresentationNational Symposium on Student Retention 2015 Presentation
National Symposium on Student Retention 2015 PresentationMorgan Blair
 
Inventos que revolucionaron en el mundo
Inventos que revolucionaron en el mundoInventos que revolucionaron en el mundo
Inventos que revolucionaron en el mundoLizBroncanoYambay
 
Cara Mensharing Data lewat Kabel LAN
Cara Mensharing Data lewat Kabel LANCara Mensharing Data lewat Kabel LAN
Cara Mensharing Data lewat Kabel LANkurniawaan
 
Le paysage portuaire de Veracruz (Golfe du Mexique) : méthodes et techniques ...
Le paysage portuaire de Veracruz (Golfe du Mexique) : méthodes et techniques ...Le paysage portuaire de Veracruz (Golfe du Mexique) : méthodes et techniques ...
Le paysage portuaire de Veracruz (Golfe du Mexique) : méthodes et techniques ...Loïc Ménanteau
 
Nuevo sistema educativo en japon
Nuevo sistema educativo en japonNuevo sistema educativo en japon
Nuevo sistema educativo en japonnanci gonzalez
 

Viewers also liked (11)

Break the Cycle Final Logo
Break the Cycle Final LogoBreak the Cycle Final Logo
Break the Cycle Final Logo
 
National Symposium on Student Retention 2015 Presentation
National Symposium on Student Retention 2015 PresentationNational Symposium on Student Retention 2015 Presentation
National Symposium on Student Retention 2015 Presentation
 
Inventos que revolucionaron en el mundo
Inventos que revolucionaron en el mundoInventos que revolucionaron en el mundo
Inventos que revolucionaron en el mundo
 
Cara Mensharing Data lewat Kabel LAN
Cara Mensharing Data lewat Kabel LANCara Mensharing Data lewat Kabel LAN
Cara Mensharing Data lewat Kabel LAN
 
Mohammed Abu Nahel CV
Mohammed Abu Nahel CV Mohammed Abu Nahel CV
Mohammed Abu Nahel CV
 
Academic Writing
Academic WritingAcademic Writing
Academic Writing
 
Le paysage portuaire de Veracruz (Golfe du Mexique) : méthodes et techniques ...
Le paysage portuaire de Veracruz (Golfe du Mexique) : méthodes et techniques ...Le paysage portuaire de Veracruz (Golfe du Mexique) : méthodes et techniques ...
Le paysage portuaire de Veracruz (Golfe du Mexique) : méthodes et techniques ...
 
Nuevo sistema educativo en japon
Nuevo sistema educativo en japonNuevo sistema educativo en japon
Nuevo sistema educativo en japon
 
Microservices at NewStore
Microservices at NewStoreMicroservices at NewStore
Microservices at NewStore
 
Nickel titanium alloys
Nickel titanium alloysNickel titanium alloys
Nickel titanium alloys
 
introduction to HRM
introduction to HRMintroduction to HRM
introduction to HRM
 

Similar to A GIS Methodology to Map Truck Routes from Permit Database

In Data Mining ISBN 978-1-63463-738-1 Editor Harold L..docx
In Data Mining  ISBN 978-1-63463-738-1 Editor Harold L..docxIn Data Mining  ISBN 978-1-63463-738-1 Editor Harold L..docx
In Data Mining ISBN 978-1-63463-738-1 Editor Harold L..docxsleeperharwell
 
Understanding Map Integration Using GIS Software_ff
Understanding Map Integration Using GIS Software_ffUnderstanding Map Integration Using GIS Software_ff
Understanding Map Integration Using GIS Software_ffMichelle Pasco
 
TRAFFIC INFORMATION SYSTEM TO DELIVER IN-VEHICLE MESSAGES ON PRE-DEFINED ROUT...
TRAFFIC INFORMATION SYSTEM TO DELIVER IN-VEHICLE MESSAGES ON PRE-DEFINED ROUT...TRAFFIC INFORMATION SYSTEM TO DELIVER IN-VEHICLE MESSAGES ON PRE-DEFINED ROUT...
TRAFFIC INFORMATION SYSTEM TO DELIVER IN-VEHICLE MESSAGES ON PRE-DEFINED ROUT...Attiq Uz Zaman
 
Trouble at the_fare_gates
Trouble at the_fare_gatesTrouble at the_fare_gates
Trouble at the_fare_gatesAdina Levin
 
Modeling Truck Movements: A Comparison between the Quick Response Freight Man...
Modeling Truck Movements: A Comparison between the Quick Response Freight Man...Modeling Truck Movements: A Comparison between the Quick Response Freight Man...
Modeling Truck Movements: A Comparison between the Quick Response Freight Man...inventionjournals
 
Application of GIS in Transportation Planning
Application of GIS in Transportation Planning Application of GIS in Transportation Planning
Application of GIS in Transportation Planning shrikrishna kesharwani
 
Density of route frequency for enforcement
Density of route frequency for enforcement Density of route frequency for enforcement
Density of route frequency for enforcement Conference Papers
 
Alternative BART Fares TRB - Miller Schabas - v7F
Alternative BART Fares TRB - Miller Schabas - v7FAlternative BART Fares TRB - Miller Schabas - v7F
Alternative BART Fares TRB - Miller Schabas - v7FRuth Miller
 
Kim-Blanco_Cirlugea_de Sherbinin_OSM_validation_Data_science_day
Kim-Blanco_Cirlugea_de Sherbinin_OSM_validation_Data_science_dayKim-Blanco_Cirlugea_de Sherbinin_OSM_validation_Data_science_day
Kim-Blanco_Cirlugea_de Sherbinin_OSM_validation_Data_science_dayBogdan-Mihai Cîrlugea
 
Chapter 3 -Line-Based Analysis-edited-final
Chapter 3 -Line-Based Analysis-edited-finalChapter 3 -Line-Based Analysis-edited-final
Chapter 3 -Line-Based Analysis-edited-finalAdriana Abramovich
 
Geographical information system in transportation planning
Geographical information system in transportation planning Geographical information system in transportation planning
Geographical information system in transportation planning shayiqRashid
 
Mining data for traffic detection system
Mining data for traffic detection systemMining data for traffic detection system
Mining data for traffic detection systemijccsa
 
Ijmer 46044245
Ijmer 46044245Ijmer 46044245
Ijmer 46044245IJMER
 
A low cost method of real time pavement condition data sharing to expedite ma...
A low cost method of real time pavement condition data sharing to expedite ma...A low cost method of real time pavement condition data sharing to expedite ma...
A low cost method of real time pavement condition data sharing to expedite ma...UVision
 
Travel time prediction using svm and wma
Travel time prediction using svm and wmaTravel time prediction using svm and wma
Travel time prediction using svm and wmatanjil huda sany
 

Similar to A GIS Methodology to Map Truck Routes from Permit Database (20)

In Data Mining ISBN 978-1-63463-738-1 Editor Harold L..docx
In Data Mining  ISBN 978-1-63463-738-1 Editor Harold L..docxIn Data Mining  ISBN 978-1-63463-738-1 Editor Harold L..docx
In Data Mining ISBN 978-1-63463-738-1 Editor Harold L..docx
 
Understanding Map Integration Using GIS Software_ff
Understanding Map Integration Using GIS Software_ffUnderstanding Map Integration Using GIS Software_ff
Understanding Map Integration Using GIS Software_ff
 
BusVizPoster-v2
BusVizPoster-v2BusVizPoster-v2
BusVizPoster-v2
 
TRAFFIC INFORMATION SYSTEM TO DELIVER IN-VEHICLE MESSAGES ON PRE-DEFINED ROUT...
TRAFFIC INFORMATION SYSTEM TO DELIVER IN-VEHICLE MESSAGES ON PRE-DEFINED ROUT...TRAFFIC INFORMATION SYSTEM TO DELIVER IN-VEHICLE MESSAGES ON PRE-DEFINED ROUT...
TRAFFIC INFORMATION SYSTEM TO DELIVER IN-VEHICLE MESSAGES ON PRE-DEFINED ROUT...
 
Trouble at the_fare_gates
Trouble at the_fare_gatesTrouble at the_fare_gates
Trouble at the_fare_gates
 
Modeling Truck Movements: A Comparison between the Quick Response Freight Man...
Modeling Truck Movements: A Comparison between the Quick Response Freight Man...Modeling Truck Movements: A Comparison between the Quick Response Freight Man...
Modeling Truck Movements: A Comparison between the Quick Response Freight Man...
 
Application of GIS in Transportation Planning
Application of GIS in Transportation Planning Application of GIS in Transportation Planning
Application of GIS in Transportation Planning
 
Density of route frequency for enforcement
Density of route frequency for enforcement Density of route frequency for enforcement
Density of route frequency for enforcement
 
Alternative BART Fares TRB - Miller Schabas - v7F
Alternative BART Fares TRB - Miller Schabas - v7FAlternative BART Fares TRB - Miller Schabas - v7F
Alternative BART Fares TRB - Miller Schabas - v7F
 
Kim-Blanco_Cirlugea_de Sherbinin_OSM_validation_Data_science_day
Kim-Blanco_Cirlugea_de Sherbinin_OSM_validation_Data_science_dayKim-Blanco_Cirlugea_de Sherbinin_OSM_validation_Data_science_day
Kim-Blanco_Cirlugea_de Sherbinin_OSM_validation_Data_science_day
 
Chapter 3 -Line-Based Analysis-edited-final
Chapter 3 -Line-Based Analysis-edited-finalChapter 3 -Line-Based Analysis-edited-final
Chapter 3 -Line-Based Analysis-edited-final
 
5667
56675667
5667
 
Geographical information system in transportation planning
Geographical information system in transportation planning Geographical information system in transportation planning
Geographical information system in transportation planning
 
Mining data for traffic detection system
Mining data for traffic detection systemMining data for traffic detection system
Mining data for traffic detection system
 
Space 134 - Caltrans Transportation Concept Report (2012)
Space 134 - Caltrans Transportation Concept Report (2012)Space 134 - Caltrans Transportation Concept Report (2012)
Space 134 - Caltrans Transportation Concept Report (2012)
 
Ijmer 46044245
Ijmer 46044245Ijmer 46044245
Ijmer 46044245
 
Kentucky
KentuckyKentucky
Kentucky
 
A low cost method of real time pavement condition data sharing to expedite ma...
A low cost method of real time pavement condition data sharing to expedite ma...A low cost method of real time pavement condition data sharing to expedite ma...
A low cost method of real time pavement condition data sharing to expedite ma...
 
Travel time prediction using svm and wma
Travel time prediction using svm and wmaTravel time prediction using svm and wma
Travel time prediction using svm and wma
 
I-95 Corridor
I-95 CorridorI-95 Corridor
I-95 Corridor
 

A GIS Methodology to Map Truck Routes from Permit Database

  • 1. A GIS Methodology to Map Routes from a Truck Permit Database1 Utilizing a Linear Reference System and Network Analysis2 3 Sinaya Dayan M.S.4 Geospatial Analyst 25 Rahall Transportation Institute6 1900 Third Ave., Huntington, West Virginia 257037 Telephone: 304-521-26878 Email: sdayan@njrati.org9 10 Andrew P. Nichols, Ph.D., P.E.11 Associate Professor12 Weisberg Division of Engineering13 Marshall University14 One John Marshall Drive, Huntington, West Virginia 2575515 Telephone: 304-696-320316 Email: andrew.nichols@marshall.edu17 18 Chih-Sheng Chou, Ph.D.1 19 Research Associate20 Rahall Transportation Institute21 1900 Third Ave., Huntington, West Virginia 2570322 Telephone: 304-696-709823 Email: jchou@njrati.org24 25 Sanghong Yoo, M.S., M.S.E26 GIS Data Coordinator27 Office of Enterprise Web Portal and GIS (EWPG)28 Department of Information Technology (IT)29 Washington Metropolitan Area Transit Authority (WMATA)30 600 Fifth St NW, Washington, DC 2000131 Telephone: 202-962-165332 Email: syoo@wmata.com33 34 Tuan Nguyen, M.S.35 Geospatial Analyst 136 Rahall Transportation Institute37 1900 Third Ave., Huntington, West Virginia 2570338 Telephone: 304-521-266139 Email: tnguyen@njrati.org40 41 Eric Pennington M.A.42 Research Assistant43 Rahall Transportation Institute44 1900 Third Ave., Huntington, West Virginia 2570345 Telephone: 304-521-266546 Email:epennington@njrati.org47 48 49 August 1, 201350 Word count: 4,281 + 10 Figures + 3 Table =7,53151 52 Submitted for presentation at the 93nd Annual Meeting of the53 Transportation Research Board and publication in the Transportation Research Record54 55 1 Corresponding author
  • 2. ABSTRACT1 Trucking companies can obtain permits from state agencies allowing them to haul oversize and2 overweight loads. Most permit systems assign a specific route to be followed that accounts for3 various network travel restrictions. The routes assigned in these permits can provide a wealth of4 information for different types of transportation analyses. Unfortunately, the permit data is not5 always generated by a system or stored in a manner that allows directly importing the data into a6 GIS platform for mapping purposes. This paper presents a methodology that was developed to7 process archived permit records in West Virginia so that they could be imported into GIS and8 plotted using the existing WVDOT linear reference system (LRS). Since most states manage9 their transportation network in GIS using LRS, this methodology should be widely applicable.10 The automated procedure was able to map 91.4% of the permits that contained route data for the11 month of July 2011.12
  • 3. INTRODUCTION1 Shipping by commercial truck is an incredibly popular means of transporting goods. However2 this form of transportation does a great deal of damage to the nation’s highways and bridges.3 Often, large pieces of equipment and other cargo are heavy enough that they can’t be divided4 into smaller loads that are within the legal hauling limits for size and weight. In this situation,5 companies can apply for special permits issued by either the state transportation agency or state6 law enforcement that will allow them to exceed the legal limits. Proper evaluation and7 subsequent permitting of these oversize and/or overweight vehicles is necessary to insure that the8 infrastructure is protected by assigning certain travel routes (to avoid bridges with weight9 restrictions) and travel time windows (to avoid congested time periods). The archive of10 historical permit data and the intended route of travel is a useful source of information that can11 be used for planning purposes.12 The original concept for the data analysis discussed in this paper was presented by Chou13 et al. (1) as part of a methodology to estimate the number of overweight trucks on specific14 roadways that do not have the proper permits. The methodology presented in that paper required15 the mapping of oversize/overweight (OSOW) permit data and subsequently matching the permits16 with weigh-in-motion (WIM) stations that the vehicle should have crossed. This paper will17 expand on the permit mapping portion of that methodology. Several researchers have previously18 examined OSOW truck aspects using geographic information systems (GIS). Previous GIS work19 in this field has dealt with designing and developing routing procedures for the permits (2, 3, 4),20 network optimization (5,6), and automation of route selection and permit processing (7). Each of21 these papers uses GIS to either optimize or automate decision making to initially assign a route22 to the permit. These papers however do not explore actually mapping the routes in order to23 determine the spatial occurrence and travel patterns of permitted vehicles for planning and24 analysis purposes.25 The only study that could be found that dealt with mapping archived OSOW permits in26 order to explore this information for planning purposes was conducted by Li et al. (8). Li27 developed an approach to convert the Texas DOT archived OSOW permits into a GIS format.28 They retrieved the data from a centralized database, processed it to be GIS compatible, and29 directly mapped the truck routes in a GIS system. The objectives of their research were to30 identify strategic infrastructure improvements to accommodate the extreme loads and to develop31 optimal routes for certain load groups between the most common origins and destinations using32 the Texas DOT highway network. A significant amount of their effort was in processing and33 correcting the travel route data in the permit record in order to be mapped with GIS.34 The research presented here is different from Li’s research primarily due to the format of35 the data stored for the permit route, which required a different set of procedures to format and36 map the data. The permit data for West Virginia used route numbers and milepost information to37 designate the permitted routes, which was conducive to processing and mapping the routes using38 a Linear Reference System (LRS. The Texas permit data contained non-standardized route39 information (e.g., some route numbers and some route names) and did not contain milepost40 information, so utilizing an LRS was likely not a viable option in their study. The approach41 using LRS reduces the data processing time and allows for a more accurate determination of42 locations where the permit route transitions between roads (used to construct the overall route).43 Most state transportation agencies, including the West Virginia Department of Transportation44 (WVDOT), use a LRS to identify and define the location of their assets on their roadway45 network, so this methodology should be widely applicable. Additionally, this research also46
  • 4. includes an automated method to identify the direction of travel for each permit on a specific1 roadway segment, which can be useful on certain types of data analysis.2 This paper presents a methodology to map OSOW permits to a LRS using GIS. Although3 it is implemented with permit data from WV, it can be applied to data from other states whose4 route data is not archived in a format readily compatible with an LRS. Thus, an overview of the5 WV permit system is presented in the next section. It is followed by a five-step GIS mapping6 methodology with Linear Reference System functionality. Finally, some sample applications of7 the mapped permit data are presented, including the specific application referenced earlier where8 the permits are assigned to a weigh-in-motion system in order to quantify illegal overweight9 truck activity. Conclusions and future study directions are then derived.10 11 OVERSIZE/OVERWEIGHT PERMIT SYSTEM12 In West Virginia, the process of acquiring a permit for an oversize or overweight truck is13 conducted electronically through the WVDOT website (9). The West Virginia Department of14 Motor Vehicles issues five different permit types; Blanket, Mobile Home Blanket, Seagoing,15 Single Trip Mobile Home, and OS/OW/Superload. The only permit type that is assigned a16 specific route is the OS/OW/Superload permits because their weight limits approach the limits of17 some bridges across the state and require that a certain route be followed. Permit applicants18 submit sufficient information for the WVDOT to evaluate the vehicles, including the vehicle19 model, dimensions, axle spacing, axle and gross weights, desired travel dates, and origin and20 destination (within West Virginia). With user defined origin and destination information, the21 online permit system will generate a recommended route that accounts for various factors, such22 as bridge weight limits, underpass height limits, and other general travel restrictions. This system23 appears to have some linear referencing components as it incorporates milepost information and24 consistent route name information in the “Routes” field. This system, however, does not seem to25 be fully integrated with the WVDOT LRS because the route name does not follow a route26 numbering structure common for an LRS. After the user enters this information, WVDOT27 personnel will review and approve, modify, or deny the permit.28 Of particular interest in this research are the fields in the permit database “Permit ID” (as29 a unique permit identifier), “Origin”, “Destination”, and “Routes”. Table 1 shows the data30 contained in these four fields for a sample permit. As shown in the table, the “Routes” field31 contains the permitted route as a single string of text, which is a set of segment-by-segment32 instructions with the keywords “START”, “TO”, “END”, and “RETURN”. This sample route33 happens to be a roundtrip permit that starts on a state route (WV-25), continues on the interstate34 (I-64), and ends on a US route (US-35) where it intersects with a county route (C33). The35 information after the “RETURN” keyword indicates the route to take from the destination back36 to the origin. The format of this data is not compatible for GIS mapping purposes without37 additional processing, as will be discussed in the next section. Thus, this study discusses a38 methodology that will convert this field of data into a format that is LRS compatible for mapping39 purposes.40 Permit data from WV for the month of July in 2011 were utilized in this analysis. There41 were a total of 17,201 permit records during this time period. There were 3,876 records that42 contained no route information and were excluded from further analysis. These records43 corresponded to the permit types previously discussed that are not assigned to specific routes.44 45
  • 5. Table 1. Sample Permit Database Record1 Permit ID Origin Destination Routes 10140093 NITRO ST ALBANS START WV-25 W MP PUTNAM 2.19 TO WV-25 MP PUTNAM 1.07 @ I-64 W TO I-64 MP PUTNAM 43.78 @ US-35 S END US-35 @ C33AND RETURN US-35 N @ C33 TO US-35 MP PUTNAM 2.10 @ I-64 E TO I-64 MP PUTNAM 44.53 @ WV-25 E END WV- 25 MP PUTNAM 2.19 2 LINEAR REFERENCE SYSTEMS (LRS)3 Linear referencing is a method of specifying a location as a distance or offset measurement (e.g.,4 milepost) along a linear feature (e.g., a roadway), from a known reference point (e.g., milepost5 0.0) (10). A Linear Referencing System (LRS) is one type of location referencing system with6 the primary benefit of establishing intuitive reference points which are easily identified in the7 field. For example, transportation agencies use routes and mileposts to define the locations of8 assets (e.g., bridges, signs, structures) and events (e.g. road conditions, traffic counts, incidents)9 (11). The WVDOT has developed a Road Inventory Log (RIL) that uses LRS as a reference10 system. WVDOT RIL is a transportation network database defined and maintained in a tabular11 form and records transportation assets or activities on or along the route.12 A key feature of an LRS is a systematic way to define route segments, (i.e., Route ID).13 Each agency defines its own Route ID structure as well as the number designations for each14 component of the Route ID. The current WVDOT structure is shown in Figure 1. The county15 code is a two digit number referring to one of the 55 counties. The road classification is a single16 digit from 0 to 9, where 1 is an Interstate, 2 is a US route, 3 is a State route, etc. The route17 number is a four digit number corresponding to the assigned route number. The sub-route18 number is the assigned route designation for those roadways that have a sub-route designation.19 Generally, primary roadways (road classification 1, 2, and 3) only have a route number and non-20 primary roadways (typically road classification 4 and above) will have both a route number21 (corresponding to its adjacent primary route) and a sub-route number. The supplemental code is22 a code that provides additional information about certain roadway characteristics (e.g., toll roads,23 entrance/exit ramps, spurs). The LRS codes for each road segment in the permit route will be24 automatically assigned within Step 2 of the methodology.25 26 XX X XXXX XX XX ↑ ↑ ↑ ↑ ↑ County Code Road Classification Route Number Sub-route Number Supplemental Code Figure 1: WVDOT LRS Route ID Structure (12)27 GIS ROUTE MAPPING METHODOLOGY28 To facilitate the analysis and visualization of the permit data, the route information from each29 permit must be mapped in GIS. Since the Routes field in the permit database contains “route”30 and “milepost” information, it is feasible to assign the trips to the WV LRS after the data is31 converted to be compatible.32 The methodology used in this study to convert the route information and plot it consists33 of a five-step process, summarized in Figure 2. Step 1 seeks to decompose the single string of34 text into specific transition points along the permit route, which would occur when the vehicle35 must turn onto a new route. Step 2 creates a unique Route ID for every transition point, which36 corresponds to the Route IDs used in the WVDOT LRS. In Step 3, all transition points in each37
  • 6. permit are plotted on a map. These plotted points are then connected and the segments merged to1 form a continuous permit route in Step 4. Finally, Step 5 assigns the cardinal direction of travel2 on each tangent segment in the permit route. Step 5 is not essential for plotting purposes, but it3 information that is useful in some types of analysis.4 5 Figure 2: Methodology Flowchart6 7 Step 1. ROUTES Field Decomposition8 This step decomposes the continuous text string from the Routes field into segments9 corresponding with a transition point in the permit trip. A Visual Basic program was written to10 search for key words in the route string, including START, RETURN, TO, and END, which are11 then used to partition the string. This exercise is continued until the end of the string to get a12 complete list of transition points associated with a permit.13 The transition points of each permit are also identified with the order in which the14 transition points occurred, which is important in Step 4 when the continuous route is constructed.15 The program generates a new field called “order” and assigns the sequence value for each16 transition point. This process served as the initial stage for LRS assignment and GIS transition17 point plotting and permit mapping.18 19
  • 7. Step 2. LRS Assignment1 For each transition point in the route, the text content is further evaluated to assign an 11-digit2 Route ID that corresponds to the WVDOT LRS format. The text in each transition point field3 was processed automatically using a Visual Basic script that utilized lookup tables and logic4 statements to determine each individual component of the Route ID. Each component had a5 separate lookup table that contained all possible values from the WVDOT LRS. The individual6 components were then concatenated to form the overall Route ID, which is shown in Table 2.7 8 Table 2: LRS Route ID Generation for Sample Permit ID 101400939 General Road Name County Road Classification Route Number Sub Route Supplemental Code Concatenated 11-digit Route ID I-64 40 (Putnam) 1 (Interstate) 0064 (64) 00 (none) 00 (n/a) 40100640000 US 35 40 (Putnam) 2 (US Route) 0035 (35) 00 (none) 00 (n/a) 40200350000 WV 25 40 (Putnam) 3 (State Route) 0025 (25) 00 (none) 00 (n/a) 40300250000 10 The results of Steps 1 and 2 are a new data table similar to the one in Table 3, which lists11 the order, Route ID and milepost for the decomposed text of Permit ID 10140093, all necessary12 components for LRS/GIS plotting.13 14 Table 3. LRS Compatible Transition Points for Permit ID 1014009315 Transition Point Order Route ID Milepost WV-25 W MP PUTNAM 2.19 1 40300250000 2.19 WV-25 MP PUTNAM 1.07 @ I-64 W 2 40300250000 1.07 I-64 MP PUTNAM 43.78 @ US-35 S 3 40100640000 43.78 US-35 MP PUTNAM 0.00 @ C33 4 40200350000 0 US-35 N MP PUTNAM 0.00 @ C33 5 40200350000 0 US-35 MP PUTNAM 1.59 @ I-64 E 6 40200350000 1.59 I-64 MP PUTNAM 44.53 @ WV-25 E 7 40100640000 44.53 WV-25 MP PUTNAM 2.19 8 40300250000 2.19 16 Table 4 summarizes the records that were processed in Steps 1 and 2. The scripts17 automatically processed 12,178 of the 13,325 records that contained route information. There18 were 1,147 records that could not be automatically processed and required manual inspection.19 Problems with these records included missing key words (i.e. START, RETURN, TO, END),20 missing transition point information or milepost in route description, or inconsistent descriptive21 structure (e.g., missing the @ indicator for an intersection). Of these 1,147 records, 905 were22 successfully coded manually and 242 had insufficient information to generate a Route ID or23 milepost and could not be processed or included for further analysis. The resulting permit24 database of 13,083 unique records was utilized for Steps 3 and 4.25 26 27 28 29 30 31
  • 8. Table 4: Summary of Record Processing Statistics after Steps 1 and 21 Description Frequency Total Records for July 2011 with Route Information 13,325 Successfully Processed with Automated Procedure in Step 1 and Step 2 12,178 (91.4%) Required Manual Processing 1,147 (8.6%) Manual Route ID Generation Successful 905 Insufficient Route or Milepost Information and Excluded 242 2 Step 3. Plotting Transition Points Using LRS3 The plotting of transition points from the permits was possible using the “make route event4 layer” in the LRS tools in ArcGIS. This tool uses a reference network, in this case the WVDOT5 LRS, to locate events or points along the network, using the Route ID field and the milepost6 information for each transition point as a reference. The WVDOT network already includes the7 Route ID field for proper matching as well as the calculated measurements, referred to as M8 values, along each of the routes. This allows the identification of specific routes and the location9 of transition points along such routes, providing alternative location determination to records or10 features without the use of longitude or latitude information. This layer was needed for the route11 generation and automated mapping process carried out in Step 4. The plotted points for the12 sample permit are shown in Figure 4.13 The GIS process generated a point feature class for all successfully located transition14 points as well as an error field flagging transition points that could not be automatically located15 on the LRS due to a problem with the Route ID or with the milepost. Two types of errors were16 generated in the LRS plotting process, “Route Not Found” and “Route Measure Not Found”.17 The Route Not Found error generally indicates a segment where the 11-digit Route ID generated18 in Step 2 does not correspond to an actual Route ID in the WVDOT LRS. This is most likely19 caused by a clerical error in the reference WVDOT network. The Route Measure Not Found20 error indicates that the milepost in the transition point is outside the milepost limits in the21 WVDOT LRS. This generally occurs near the end of a route (at the maximum milepost or county22 line) or if the milepost information assigned by the permit system is invalid. Example for this23 error type is presented in Figure 3: Example for LRS Error “Route Measure Not Found”. In this24 example, a transition point within a permit was assigned the milepost 7.45, however, the route25 only goes up to milepost 6.95 which yields an LRS plotting error. All errors were manually26 inspected and resolved in an iterative process until all permit records were properly matched with27 the route network.28
  • 9. 1 Figure 3: Example for LRS Error “Route Measure Not Found”.2 3 4 Figure 4: Permit 10140093 Transition Point Plot in GIS in Step 35 6 Step 4. Connecting Transition Points to Create Continuous Route7 After the transition points are plotted along the road network, a continuous permit route is8 created by connecting these points along the mapped roadway, as opposed to a straight line9 connecting the points. A batch process was developed within ESRI ArcGIS Model Builder and10 utilized Network Analyst and Tele Atlas Premium StreetMap North America to automatically11 Route ID: 0420019000 Milepost: 6.95 Route ID: 0420019000 Milepost: 0.00 Route ID: 0420019000 Milepost: 7.45 Route Measure Not Found
  • 10. construct the continuous routes (13, 14). The batch process is illustrated in Figure 5. Model1 elements include an iterator to process all permits in the database and their transition points. The2 model integrated “MakeRouteLayer”, “AddLoactions”, and “Solve” tools from the Network3 Analyst extension in ArcGIS. The first tool creates a route analysis layer, namely “outputRoute”,4 for determining the optimized routes between a set of transition points. The output is carried5 over to the next tool, AddLocations, which adds the transition points (RouteStops in Figure) to6 the network created by the first tool. All transition points are sorted by the order value assigned7 in Step 1 for a hierarchical assignment. Both the outputs for the AddLocations and8 MakeRouteLayer tools are analyzed to solve the network analysis layer. The “Solve” tool9 determines the optimal route by identifying the barriers and constraints within the network10 transition points, and accounting for their hierarchical order by which their connectivity is11 determined. The final output, “NetworkAnalystLayerSolved” captures the actual traveled route12 for each permit within the database, accounting for all transition points.13 Figure 6 shows Permit 101400093 plotted in GIS after connecting the transition points in14 Step 4. Notice that the plotted route follows the mapped roadways rather than the straight line15 distance, which would have missed the ramps connecting I-64 to US 35.16 17 18 Figure 5: GIS Batch Routing Model for Step 419
  • 11. 1 Figure 6: Permit 10140093 GIS Plot in Step 42 3 Step 5. Assigning direction of travel to route segments4 It was desirable to assign the direction of travel to certain segments of the permit route in order5 to facilitate future directional analysis. In order to derive the directional information of a route at6 any specific location, the permit was segmented in order to identify tangent sections. Once the7 straight segments were identified, the Linear Directional Mean (LDM) was calculated using the8 corresponding ESRI ArcGIS Spatial Statistics tool. The LDM computes the azimuth for a line,9 referenced from north (0 degrees) in a clockwise direction. A Python script was used to convert10 the azimuth to one of the four primary directions – North, South, East, West. Figure 7 illustrates11 the azimuths assigned to each travel direction of the segment of I-64 in Permit 10140093.12 13 14 Figure 7: Assigned Azimuth for I-64 Segment from Permit 1014009315 Permit 10140093 Permit 10140093
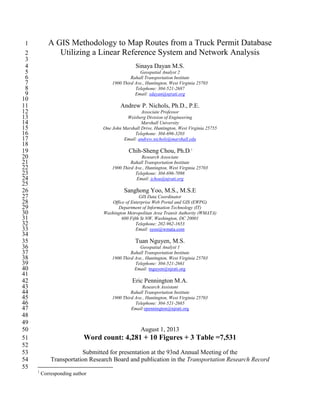
  • 12. SAMPLE APPLICATIONS1 Matching Permits to WIM Stations2 This methodology was applied in previous research to help estimate the percentage of3 overweight trucks on certain roads that do not have proper permits. This was accomplished by4 integrating the permit data discussed here with weight data measured in the field at specific5 locations. In West Virginia, truck weight data is collected at 73 weigh-in-motion (WIM)6 stations. The physical location of the WIM stations was known, so by plotting their location in7 GIS and identifying the permits that should have crossed the corresponding tangent roadway8 section, the permit data and the WIM data could be directly compared. Figure 8. Frequency of9 Permits Crossing WIM Sites (July 2011) shows the frequency of unique permits that crossed10 each WIM station during July 2011. It is easy to see that the WIM sites located along interstates11 and other primary routes experienced more permitted overweight activity. By comparing the12 quantity of permits crossing the WIM with the actual overweight truck counts crossing the WIM,13 compliance rates were estimated. This information is useful for overweight enforcement14 purposes.15 16 17 Figure 8. Frequency of Permits Crossing WIM Sites (July 2011)18 19
  • 13. Statewide Roadway Permit Frequency1 To protect the highway infrastructure and prioritize maintenance activities, a map illustrating the2 routes that overweight trucks are taking is useful. Figure 9 illustrates the mapped results from the3 13,083 permits that were processed for July 2011. The roadway segments with the highest4 frequency of permitted loads can easily be identified, which tend to be the interstate system. I-795 between Morgantown, WV and the Pennsylvania border showed the highest number of truck6 permit loads in the range of 1,241 to 2,485 permits during the study period. Heavy truck loaded7 roadway segments warrant frequent inspections to protect the safety of the infrastructure.8 Additionally, this information might assist the authorities in selecting segments for permit9 compliance enforcement.10 11 12 Figure 9. Statewide Frequency of Permits on Roadway Network (July 2011)13 14 Origin-Destination Analysis15 An origin-destination (OD) matrix can be created to identify all OD pairs, which can be used to16 identify frequently used travel paths, which can be useful in planning new facilities or upgrading17 existing ones. As an example, all permits with an origin in the vicinity of Nitro, WV were18 plotted, both as Euclidean Distance (Figure 10) and the permitted routes (Figure 11). The data in19 Figure 10 could have been plotted without the data processing described in this paper since it20
  • 14. does not utilize the route information. Figure 11: Actual Route Distribution of Permit OD Pairs1 Leaving Nitro,WV (July 2011) can only be derived after processing the route data, using the2 procedure discussed here.3 4 5 Figure 10: Euclidean Distribution of Permit OD Pairs Leaving Nitro, WV (July 2011)6 7 8 Figure 11: Actual Route Distribution of Permit OD Pairs Leaving Nitro,WV (July 2011)9 10 CONCLUSION11 This paper presents a methodology to convert oversize/overweight permit data into a format12 compatible with a LRS for GIS mapping purposes. Overall, the methodology resulted in13 successful mapping of 91.4% of the permits that contained route information during July 2011 in14 West Virginia. This methodology should be widely applicable, as most state transportation15 agencies manage their assets with a LRS and have network established.16 Results from the mapped permit routes can be integrated with other databases to derive17 valuable knowledge for traffic analysis and planning purposes. For example, the integration18 between permit routes and WIM locations can facilitates the derivation of illegal overweight19 truck activity. This can improve enforcement mechanisms, but can also contribute to roadway20 planning, construction, and maintenance, creating a safer infrastructure network.21
  • 15. With this analysis, the actual route that is occupied during travel can be determined,1 rather than using a less exact Euclidian distance. The mapping procedure can also provide2 information on OSOW permit travel frequency, which could be used in economic development3 analysis, land use planning, transportation planning, and other analyses.4 5 ACKONWLEDGEMENTS6 This work was supported by the West Virginia Department of Transportation, Division of7 Highways and the Nick J. Rahall II Appalachian Transportation Institute at Marshall University.8 The contents of this paper reflect the views of the authors, who are responsible for the facts and9 the accuracy of the data presented herein, and do not necessarily reflect the official views or10 policies of the sponsoring organizations. These contents do not constitute a standard,11 specification, or regulation.12 13 14 REFERENCES15 1 Chou, C.-S., A.P. Nichols, S. Yoo, and M. Cetin, "Methodology to Estimate Percent of Overweight Trucks Without Proper Permits," Proceeding of Transportation Research Board 92nd Annual Meeting, no. 13-4579. 2013. 2 Osegueda, R., A. Garcia-Diaz, S. Ashur, O. Melchor, S.-H. Chang, C. Carrasco, and A. Kuyumcu, "GIS-based network routing procedures for overweight and oversized vehicles," Journal of Transportation Engineering 125, no. 4 pp.324-331, 1999. 3 Nord, M., and G. Hovey. "Load Rating and Permit Vehicle Routing." In Eighth Transportation Research Board Conference on Bridge Management, no. L-5, IBMC-058. 1999. 4 Datla, S.K., R.S. Moorthy, and K.K. Rao, "A GIS for Routing of Oversized and Hazardous Material Carrying Vehicles," Proceeding of Map Asia Conference, pp.1-12. 2004. 5 Adams, T.M., S. Malaikrisanachalee, C. Blazquez, S. Lueck, and A. Vonderohe, "Enterprise- wide data integration and analysis for oversize/overweight permitting," Journal of computing in civil engineering 16, no. 1 pp.11-22, 2002. 6 Ray, J.J. "A web-based spatial decision support system optimizes routes for oversize/overweight vehicles in Delaware," Decision Support Systems 43, no. 4 pp.1171-1185, 2007. 7 Adams, T.M., S. Malaikrisanachalee, C. Blazquez, and A. Vonderohe, "GIS-Based Automated Oversize/Overweight Permit Processing," Computing in Civil and Building Engineering, pp.209-216. ASCE, 2000. 8 Li, Y., J.T. Le, D.R. Middleton, and C.A. Quiroga, "Mapping Oversized and Overweight Truck Routes with Procedure Based on Geographic Information Systems," Transportation Research Record: Journal of the Transportation Research Board 2291, no. 1 pp.8-16, 2012. 9 “Hauling Permits,” Website, West Virginia Department of Transportation, accessed June, 2013, http://www.transportation.wv.gov/highways/maintenance/hauling_permits/Pages/default.aspx 10 Federal Highway Administration, “Federal Highway Administration Linear Referencing Practitioners Guidebook,” GIS/Trans Ltd, 1999. 11 Curtin, K.M. “Linear Referencing,” The Encyclopedia of Geographic Information Science, pp. 261-264. K. Kemp ed. Sage Publications, 2008.
  • 16. 12 “Geospatial Transportation Information,” Website, West Virginia Department of Transportation, accessed June, 2013, http://www.transportation.wv.gov/highways/programplanning/gti/Pages/default.aspx 13 “ESRI 2011. ArcGIS Desktop: Release 10.1.,” Redlands, CA: Environmental Systems Research Institute, 2011. 14 “ESRI ArcPad 10 StreetMap Premium Tele ATLAS North America,” Redlands, CA: Environmental Systems Research Institute. 2010.