
Recommended
More Related Content
What's hot
What's hot (20)
Viewers also liked
Viewers also liked (11)
Similar to Empirical Analysis of Borehole Temperatures
Similar to Empirical Analysis of Borehole Temperatures (20)
Empirical Analysis of Borehole Temperatures
- 1. Empirical Analysis of Borehole Temperatures Located throughout California specifically relating to heat flow. Stephen Gronow, University of Akron – Ohio 1. ABSTRACT The National Geothermal DataSystem,specificallyCaliforniaboreholetemperatures,was usedtofirst calculate specificheatandthenanalyzedtofindpatternsbetweenheatflow andgeologiclocation.Heat flowdatawere groupedinthree categories:Low (Q<=0.02 W/m2 ),Medium(.1 W/m2 >Q<.02 W/m2 ),and high(Q=>.1 W/m2 ). Boreholeswere then plottedusinglongitude andlatitude onamap of California displayingone of the three heatflowcategories.Datawasinspectedthroughvisualization. Regions closerto coast of Californiahada highvalue forheatflow while valueslocatedcentrallyhad low heat flowvalues.The difference inthe heatflow betweenthe geologicpositionswashypothesizedtobe the resultof distance fromthe subductionof the FarallonPlate.More specifically,the highheatflow region liesonan outerarc while the lowheatflow valueslieona fore arc basin. 2. INTRODUCTION The boreholesinCaliforniavaryby manyparameters,includingbutnotlimitedto:depthdrilled, geographiclocation,andboreholetemperature.Thereare about12,000 borehole locations inCalifornia. Dependingonheatflow, some boreholelocationspresentoptimum sitesforgeothermal energy.With the growingdemandforcleanenergysources,it importanttoassessif there are any geological processesthatcan be correlatedto highervaluedheatflow locations.Understandingthe relationship betweenheatflow andgeologiclocationisessential fordetermining costefficientsitesforgeothermal energyplants. 3. METHODS Parametersfromthe National GeothermalDataSystemwere mergedandimportedtoaspreadsheetfor analysis.Datawere manipulatedinordertosolve forheatflow usingFourierequation(Q= -K(ΔT/ΔD). Note that an average of 2.5 W/mKwas usedforthe thermal conductivity. HeatFlow datawere organizedintothree groups:Low (Q<=0.02 W/m2 ),Medium(.1W/m2 >Q<.02 W/m2 ),andhigh(Q=>.1 W/m2 ).Heatflowdata points were mappedontoCaliforniavia LongitudesandLatitudes.Datawas analyzedbyvisual inspection. 4. DATA DESCRIPTION Whenheatflowwasmappedvialongitude andlatitude onCalifornia(Figure 1),patternsemerge.There are prominentregionswithhighspatial densitiesof low andhighheatflow values thatare located spatially close (observered circle Figure 1). Alsoshownare eachheatflow groupgraphedindividually (Figure 2,Figure 3, Figure 4). 5. INTERPRETATION The regionwithhighlocalizedheatflow values(Figure 1) isinterpretedtohave bedrockmade up of volcanicrock due to the Franciscansubductionprocess.(Bartow andNilsen1990) The regionwithlow localizedheatflowvalues (Figure 1) isinterpretedtohave layersof marine sedimentsdue tothe Great Valleysequence.(BartowandNilsen1990)
- 2. 6. DISCUSSION The regionwithhighheatflowvaluesisgeologicallylocatedon anouterarc. Specifically,the regionwas made by the Franciscansubductionprocess.Due toitslocationneara subductioncomplex,the heat flowtemperaturesare significantlyhigherhere.(Bartow andNilsen1990) On the otherhand,the region locatedgeologicallywithinthe fore arcbasinisknownas the Great Valley.Due tothe basinbeing furtherawayfrom the subductionzone the heatflow tempsare cooler.(Bartow andNilsen1990) Consequently,itwouldbe more efficienttoputa geothermal energyplant onanouterarc (See Figure 5 for general picture of subductionzone) 7. CONCLUSION The purpose of thislab wasto betterunderstandthe geothermal energyof differentgeologiclocations withinCaliforniabasedonheatflow. Itwasfoundthatthe regionthat had highheatflow valueswere geologicallylocatedonanouterarc. Adversely,the regionwithlow heatvalueswasgeologicallylocated on a fore arc basin. Basedonthe findings,apossible location tobuildageothermal energyplantin Californiawouldbe onthe outerarc,specificallynearSanta Rosa. 8. CITATIONS Bartow,J. and T. Nilsen.1990. Reviewof the GreatValleysequence,easternDiabloRange andnorthern San JoaquinValley,central California.Departmentof the InteriorU.S.Geological Survey:1-25. WilliamP.Elder,Geologyof the GoldenGate Headlands,National ParkService,GoldenGate National RecreationArea, from,Stoffer,P.W.,andGordon,L.C.,eds.,2001, GeologyandNatural History of the San FranciscoBay Area:A Field-TripGuidebook,U.S.Geological SurveyBulletin2188, p. 61-86.
- 3. APPENDIXA Figure 1. Borehole locationsinCaliforniaclassifiedbyheatflow,notice regionencircledbyred boundary.
- 4. Figure 2. Borehole locationsinCaliforniaregardinghighheatflow,notice locationof highvaluesare alongthe westcoast.
- 5. Figure 3. Borehole locationsinCaliforniaregardinghighmediumflow,notice mediumvaluesare located nearthe westcoast.
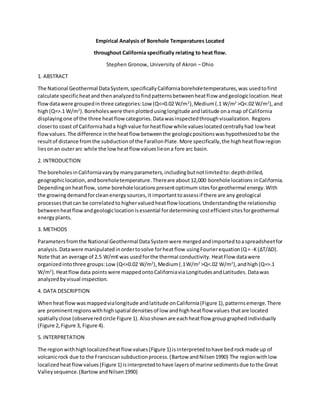
- 6. Figure 4. Borehole locationsinCaliforniaregarding low heatflow,notice low valuesare locatedinthe Great Valley.
- 7. Figure 5. Great ValleySequence presentedbyGeocaching.com takenfromWilliamElder.