Salesforce.com.pdf
•
0 likes•2 views

CRM Stock Forecast & Price: Based on the Salesforce.com stock forecasts from 31 analysts, the average analyst target price for Salesforce.com is USD 241.56 over the next 12 months. Salesforce.com average analyst rating is Strong Buy. Stock Target Advisor’s own stock analysis of Salesforce.com is Slightly Bullish , which is based on 7 positive signals and 4 negative signals. At the last closing, Salesforce.com stock price was USD 173.91. Salesforce.com stock price has changed by -7.46% over the past week, -1.91% over the past month and -33.33% over the last year.

Recommended
Recommended
More Related Content
Similar to Salesforce.com.pdf
Similar to Salesforce.com.pdf (20)
More from Stocktargetadvisor.com
More from Stocktargetadvisor.com (20)
Recently uploaded
Recently uploaded (20)
Salesforce.com.pdf
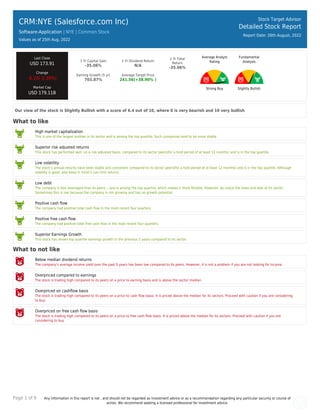
- 1. Page 1 of 9 Any information in this report is not , and should not be regarded as investment advice or as a recommendation regarding any particular security or course of action. We recommend seeking a licensed professional for investment advice. CRM:NYE (Salesforce.com Inc) Software-Application | NYE | Common Stock Values as of 25th Aug, 2022 Stock Target Advisor Detailed Stock Report Report Date: 26th August, 2022 Last Close USD 173.91 Change -6.10(-3.39%) Market Cap USD 179.11B 1 Yr Capital Gain -35.06% 1 Yr Dividend Return N/A 1 Yr Total Return -35.06% Earning Growth (5 yr) 703.87% Average Target Price 241.56(+38.90% ) Average Analyst Rating Strong Buy Fundamental Analysis Slightly Bullish Our view of the stock is Slightly Bullish with a score of 6.4 out of 10, where 0 is very bearish and 10 very bullish What to like High market capitalization This is one of the largest entities in its sector and is among the top quartile. Such companies tend to be more stable. Superior risk adjusted returns This stock has performed well, on a risk adjusted basis, compared to its sector peers(for a hold period of at least 12 months) and is in the top quartile. Low volatility The stock’s annual returns have been stable and consistent compared to its sector peers(for a hold period of at least 12 months) and is in the top quartile. Although stability is good, also keep in mind it can limit returns. Low debt The company is less leveraged than its peers ,, and is among the top quartile, which makes it more flexible. However, do check the news and look at its sector. Sometimes this is low because the company is not growing and has no growth potential. Positive cash flow The company had positive total cash flow in the most recent four quarters. Positive free cash flow The company had positive total free cash flow in the most recent four quarters. Superior Earnings Growth This stock has shown top quartile earnings growth in the previous 5 years compared to its sector. What to not like Below median dividend returns The company’s average income yield over the past 5 years has been low compared to its peers. However, it is not a problem if you are not looking for income. Overpriced compared to earnings The stock is trading high compared to its peers on a price to earning basis and is above the sector median. Overpriced on cashflow basis The stock is trading high compared to its peers on a price to cash flow basis. It is priced above the median for its sectors. Proceed with caution if you are considering to buy. Overpriced on free cash flow basis The stock is trading high compared to its peers on a price to free cash flow basis. It is priced above the median for its sectors. Proceed with caution if you are considering to buy.
- 2. Page 2 of 9 Any information in this report is not , and should not be regarded as investment advice or as a recommendation regarding any particular security or course of action. We recommend seeking a licensed professional for investment advice. CRM:NYE (Salesforce.com Inc) Software-Application | | Common Stock Stock Target Advisor Detailed Stock Report Report Date: 26th August, 2022 Adjusted Closing Share Volume Relative Returns Relative Performance (Total Returns) Security Capital Gain Dividend Return Total Return CRM Salesforce.com Inc -33.3% 0 -33.3% VTI Vanguard Total Stock Market Index Fund ETF Shares -9.1% +1.3% -7.8% Company Overview Salesforce, Inc. provides customer relationship management technology that brings companies and customers together worldwide. Its Customer 360 platform empowers its customers to work together to deliver connected experiences for their customers. The company's service offerings include Sales to store data, monitor leads and progress, forecast opportunities, gain insights through analytics and relationship intelligence, and deliver quotes, contracts, and invoices; and Service that enables companies to deliver trusted and highly personalized customer service and support at scale. Its service offerings also comprise flexible platform that enables companies of various sizes, locations, and industries to build business apps to bring them closer to their customers with drag-and-drop tools; online learning platform that allows anyone to learn in-demand Salesforce skills; and Slack, a system of engagement. In addition, the company's service offerings include Marketing offering that enables companies to plan, personalize, and optimize one-to-one customer marketing journeys; and Commerce offering, which empowers brands to unify the customer experience across mobile, web, social, and store commerce points. Further, its service offerings comprise Tableau, an end-to-end analytics solution serving various enterprise use cases; and MuleSoft, an integration offering that allows its customers to unlock data across their enterprise. The company provides its service offering for customers in financial services, healthcare and life sciences, manufacturing, and other industries. It also offers professional services; and in-person and online courses to certify its customers and partners on architecting, administering, deploying, and developing its service offerings. The company provides its services through direct sales; and consulting firms, systems integrators, and other partners. Salesforce, Inc. was incorporated in 1999 and is headquartered in San Francisco, California.
- 3. Page 3 of 9 Any information in this report is not , and should not be regarded as investment advice or as a recommendation regarding any particular security or course of action. We recommend seeking a licensed professional for investment advice. Company Website https://www.salesforce.com Address Salesforce Tower, San Francisco, CA, United States, 94105 Fiscal Year End January Employees 77810 Technical Indicators Value Value Beta 1.08 52 Week High 311.75 Short Ratio 2.61 52 Week Low 154.55 Shorted Shares 12,869,799 200 Day Moving Average 207.96 Shorted Shares Previous Month 12,155,072 50 Day Moving Average 177.39 Shares Held By Insiders 330.10% Short Percentage 2.00% Shares Held by Institutions 80.38 Dividend Yield N/A
- 4. Page 4 of 9 Any information in this report is not , and should not be regarded as investment advice or as a recommendation regarding any particular security or course of action. We recommend seeking a licensed professional for investment advice. CRM:NYE (Salesforce.com Inc) Software-Application | | Common Stock Stock Target Advisor Detailed Stock Report Report Date: 26th August, 2022 Market Performance Market Performance vs. Industry / Classification (Software-Application) Market Performance vs. Exchange (Nasdaq Global Select) Value Sector Median Percentile Rank Grade Market Median Percentile Rank Grade YTD Capital Gain -31.57% -34.4% 57% -11.9% 13% Dividend Return N/A 1.9% N/A 1.8% N/A Total Return -31.57% -34.4% 57% -10.4% 13% Trailing 12 Months Capital Gain -35.06% -37.5% 59% -10.9% 14% Dividend Return N/A 1.8% N/A 2.8% N/A Total Return -35.06% -37.5% 59% -8.3% 12% Trailing 5 Years Capital Gain 84.81% 124.1% 43% 6.7% 84% Dividend Return N/A 7.9% N/A 12.9% N/A Total Return 84.81% 124.1% 43% 21.8% 82% Average Annual (5 Year Horizon) Capital Gain 19.95% 23.9% 47% 3.0% 84% Dividend Return N/A 0.3% N/A 2.2% N/A Total Return 19.95% 23.9% 47% 6.4% 82% Risk Return Profile Volatility (Standard Deviation) 24.46% 47.6% 80% 22.5% 46% Risk Adjusted Return 81.55% N/A 86% 33.1% 92% Market Capitalization 179.11B 3.33B 100% 0.96B 99%
- 5. Page 5 of 9 Any information in this report is not , and should not be regarded as investment advice or as a recommendation regarding any particular security or course of action. We recommend seeking a licensed professional for investment advice. Key Financial Ratios Ratios vs. Industry / Classification (Computer Hardware) Ratios vs. Exchange (Nasdaq Global Select) Value Sector Median Percentile Rank Grade Market Median Percentile Rank Grade Market Value peratio 185.6 85.2 31% 16.3 3% pbratio 3.0 5.0 70% 1.6 29% pcfratio 29.9 23.3 44% 7.1 11% pfcfratio 47.0 -3.4 15% 8.2 3% Management Effectiveness retequity 1.98% -12.3% 71% 9.9% 28% retinvcap 0.81% -6.2% 65% 5.7% 29% retass 0.21% -2.5% 65% 2.6% 20% debtequityratio 18.22% 60.6% 84% 68.4% 82% Technical Ratios yield N/A 2.4% N/A 3.3% N/A sratio 2.61 4.83 81% 2.53 49% spercent 1.34% 6.2% 93% 3.9% 74% beta 1.08 1.16 58% 1.04 46%
- 6. Page 6 of 9 Any information in this report is not , and should not be regarded as investment advice or as a recommendation regarding any particular security or course of action. We recommend seeking a licensed professional for investment advice. CRM:NYE (Salesforce.com Inc) Software-Application | | Common Stock Stock Target Advisor Detailed Stock Report Report Date: 26th August, 2022 Recent Analyst Ratings Price Action Rating Action Analyst Rating Price date Maintains Credit Suisse Outperform USD 315 » USD 250 2022-08-25 Maintains Wells Fargo Overweight USD 235 » USD 220 2022-08-25 Maintains Canaccord Capital Buy USD 260 » USD 215 2022-08-25 Reiterates STA Research Buy USD 210 2022-08-25 Maintains Mizuho Securities Buy USD 245 » USD 235 2022-08-25 Maintains BMO Financial Outperform USD 223 » USD 207 2022-08-25 Maintains Citigroup Neutral USD 189 » USD 179 2022-08-25 Maintains JP Morgan & Company Overweight USD 275 » USD 245 2022-08-25 Maintains Robert W Baird Outperform USD 260 » USD 230 2022-08-25 Maintains Cowen Outperform USD 225 » USD 210 2022-08-25 Maintains Wolfe Research Outperform USD 215 » USD 200 2022-08-25 Maintains Barclays Overweight USD 218 » USD 202 2022-08-25 Maintains Deutsche Bank Capital Buy USD 260 » USD 255 2022-08-25 Maintains Truist Securities Buy USD 330 » USD 240 2022-08-25 Target Lowered by Stifel Nicolaus Research USD 200 2022-08-25 Maintains Raymond James Capital Strong Buy USD 250 » USD 225 2022-08-25 Maintains Wedbush Outperform USD 225 » USD 215 2022-08-25 Maintains UBS Neutral USD 190 » USD 180 2022-08-25 Maintains Piper Sandler Overweight USD 220 » USD 200 2022-08-25 Target Down Jefferies Financial LLC USD 250 2022-08-22 Target Up Oppenheimer Holdings USD 240 2022-08-22 Target Raised by Mizuho Securities Buy USD 225 » USD 245 2022-08-17 Maintains Morgan Stanley Overweight USD 291 » USD 273 2022-08-16 Target Up STA Research Buy USD 210 2022-08-16 Initiated by Guggenheim Securities Sell USD 150 2022-08-12
- 7. Page 7 of 9 Any information in this report is not , and should not be regarded as investment advice or as a recommendation regarding any particular security or course of action. We recommend seeking a licensed professional for investment advice. CRM:NYE (Salesforce.com Inc) Software-Application | | Common Stock Stock Target Advisor Detailed Stock Report Report Date: 26th August, 2022 Annual Financial (USD)
- 8. Page 8 of 9 Any information in this report is not , and should not be regarded as investment advice or as a recommendation regarding any particular security or course of action. We recommend seeking a licensed professional for investment advice. CRM:NYE (Salesforce.com Inc) Software-Application | | Common Stock Stock Target Advisor Detailed Stock Report Report Date: 26th August, 2022 Quarterly Financial (USD)
- 9. Page 9 of 9 Any information in this report is not , and should not be regarded as investment advice or as a recommendation regarding any particular security or course of action. We recommend seeking a licensed professional for investment advice. CRM:NYE (Salesforce.com Inc) Software-Application | | Common Stock Stock Target Advisor Detailed Stock Report Report Date: 26th August, 2022 Largest Industry Peers for Software-Application Symbol Company Name Price(Change) Market Cap SAP SAP SE ADR +0.78 (+0.9%) USD 103.46B NOW ServiceNow Inc +8.51 (+1.9%) USD 92.11B UBER Uber Technologies Inc +0.91 (+3.2%) USD 55.44B SNOW Snowflake Inc. +36.79 (+23.1%) USD 48.69B SHOP Shopify Inc +1.05 (+3.2%) USD 43.38B WORK Slack Technologies Inc N/A USD 26.52B PAYC Paycom Soft +2.69 (+0.7%) USD 22.30B BILL Bill Com Holdings Inc +5.18 (+3.0%) USD 17.89B HUBS HubSpot Inc +2.24 (+0.6%) USD 16.92B TYL Tyler Technologies Inc +7.42 (+1.9%) USD 16.18B ETFs Containing CRM Symbol Company Name Weight Mer Price(Change) Market Cap DDM ProShares Ultra Dow30 0.00 % 0.95 % +1.25 (+1.3%) USD 0.38B QDVR:F iShares Sustainable MSCI USA S.. 0.00 % 0.00 % +0.10 (+1.3%) USD 7.94B XUTC:XETRA Xtrackers MSCI USA Information.. 0.00 % 0.00 % +0.42 (+1.3%) USD 0.83B XDWT:XETRA Xtrackers MSCI World Informati.. 0.00 % 0.00 % +0.30 (+1.3%) USD 1.98B SXRU:XETRA iShares VII PLC - iShares Dow .. 0.00 % 0.00 % -0.30 (1.3%) USD 0.85B QDVE:XETRA iShares S&P 500 USD Informatio.. 0.00 % 0.00 % +0.10 (+1.3%) USD 3.13B EXI3:XETRA iShares Dow Jones Industrial A.. 0.00 % 0.00 % -0.40 (1.3%) USD 0.25B ZPDT:F SPDR S&P U.S. Technology Selec.. 0.00 % 0.00 % +0.34 (+1.3%) USD 0.96B XDWT:F Xtrackers MSCI World Informati.. 0.00 % 0.00 % -0.11 (1.3%) USD 1.98B SXRU:F iShares VII Public Limited Com.. 0.00 % 0.00 % +2.30 (+1.3%) USD 0.85B The Stock Target Advisor platform run millions of calculations every day on over 30,000 Canadian and American stocks, comparing and ranking their financial and market performance against their sectors and exchange. We represent the percentile ranking using the following grading system. Letter Grade Percentage Letter Grade Percentage Letter Grade Percentage A+ 97%-100% A 93%-96% A- 90%-92% B+ 97%-89% B 83%-86% B- 80%-82% C+ 77%-79% C 73%-76% C- 70%-72% D+ 67%-69% D 63%-66% D- 60%-62% F 0%-59%