SlideShare a Scribd company logo
1 of 8
6.8 billion mobile-cellular subscriptions
As the number of subscriptions approaches global population figures
mobile-cellular growth slows
The World in
2013 ICTFacts and Figures
In 2013, there are almost as many mobile-cellular subscriptions as people in the world, with more than half in the
Asia-Pacific region (3.5 billion out of 6.8 billion total subscriptions).
As global mobile-cellular penetration approaches 100% and market saturation is reached, growth rates have
fallen to their lowest levels in both developed and developing countries.
Mobile-cellular penetration rates stand at 96% globally; 128% in developed countries; and 89% in developing
countries.
Source: ITU World Telecommunication /ICT Indicators database
Note: * Estimate
Billions
7.1
6.8
8
7
6
5
4
3
2
1
0
	2005	 2006	 2007	 2008	 2009	 2010	 2011	 2012*	 2013*
Population
Mobile-cellular subscriptions
Mobile-cellular penetration, 2013*, and mobile-cellular subscription growth rates, 2005-2013*
180
160
140
120
100
80
60
40
20
0
63
89 89
96
105 109
126 128
Source: ITU World Telecommunication /ICT Indicators database
Note: * Estimate
2005/06	 06/07	 07/08	 08/09	09/10	 10/11	11/12*	12/13*
35
30
25
20
15
10
5
0
6.1
5.4
3.7
__	Developing
__	World
__	Developed
170
Africa
Asia&Pacific
Developing
World
ArabStates
TheAmericas
Europe
Developed
CIS
Percent
Per100inhabitants
“I am pleased to present the latest ICT Facts and Figures which show continued and almost
universal growth in ICT uptake. Every day we are moving closer to having almost as
many mobile- cellular subscriptions as people on earth. This is exciting news. The mobile
revolution is m-powering people in developing countries by delivering ICT applications in
education, health, government, banking, environment and business. Let us all celebrate this
mobile miracle that I have no doubt will hasten our pace towards sustainable development.”
Brahima Sanou, Director of the ITU Telecommunication Development Bureau
2.7 billion people – almost 40% of the world’s
population – are online
In developing countries, 16% fewer women than men use the Internet
Internet users by development level, 2003-2013*, and by region, 2013*
The gender gap: men and women online, totals and penetration rates, 2013*
In 2013, over 2.7 billion people are using the
Internet, which corresponds to 39% of the world’s
population.
In the developing world, 31% of the population is
online, compared with 77% in the developed world.
Europe is the region with the highest Internet
penetration rate in the world (75%), followed by
the Americas (61%).
In Africa, 16% of people are using the Internet –
only half the penetration rate of Asia and the Pacific.
Source: ITU World Telecommunication /ICT Indicators database
Note: * Estimate
Source: ITU World Telecommunication /ICT Indicators database
Note: * Estimate
Per100inhabitants
	Africa	 Asia	 Arab	 CIS 	 The	 Europe
		 & Pacific	 States		 Americas		
16
32	
52
38
61
75
80
70
60
50
40
30
20
10
0
80
70
60
50
40
30
20
10
0
Per100inhabitants
__	Developed
__	World
__	Developing
2003	04	 05	06	07	08	09	 10	11	12*	13*
74% 80%
29%
37%
41%
33%
	 Women	Men	Women	 Men	 Women	Men
	Developed	 Developing	 World
1.4
1.2
1.0
0.8
0.6
0.4
0.2
0.0
Billionsofpeople
Internet users
% all of men/women
More men than women use the Internet: globally, 37% of all women are online, compared with 41% of all men.
This corresponds to 1.3 billion women and 1.5 billion men.
The developing world is home to about 826 million female Internet users and 980 million male Internet users. The
developed world is home to about 475 million female Internet users and 483 million male Internet users.
The gender gap is more pronounced in the developing world, where 16% fewer women than men use the Internet,
compared with only 2% fewer women than men in the developed world.
77
39
31
Households with Internet access, 2013*
Households with Internet access, by region
750 million households – 41% globally –
connected to the Internet
In 2013, 41% of the world’s households are connected to the Internet. Half of them are in the
developing world, where household Internet penetration has reached 28%.
In the developed world, 78% of all households are connected to the Internet.
90% of the 1.1 billion households not connected to the Internet are in the developing world.
Europe and Africa are the regions with the highest and the lowest levels of household Internet penetration
respectively: 77% in Europe, compared with 7% in Africa.
The majority of households in the Americas are online (61%), compared with around one third of households in
the Arab States and Asia and the Pacific.
Between 2009 and 2013, Internet penetration in households has grown fastest in Africa, with annual growth of
27%, followed by 15% annual growth in Asia and the Pacific, the Arab States and the CIS.
C 10Y 100 M 75 K 15 C 74Y 45 M 0 K 27
C 70Y 15 M 0 K 12 C 50Y 10 M 100 K 0 C 0Y 50 M 100 K 0
MAIN COLOURS
SECONDARY COLOURS
Developing countries
Developed countries
Source: ITU World Telecommunication /ICT Indicators database
Note: * Estimate
Source: ITU World Telecommunication /ICT Indicators database
Note: * Estimate
__Europe
__The Americas
__CIS
__Arab States
__Asia & Pacific
__Africa
	 2005	2006	2007	2008	2009	2010	 2011	2012*	2013*
PercentageofhouseholdswithInternetaccess
77
61
46
34
33
7
90
80
70
60
50
40
30
20
10
0
Households
without
Internet
960
million
108
million
376
million
Households
with
Internet
373
million
Fixed-broadband prices drop by 82%
between 2008 and 2012
Over the past five years, fixed-broadband prices as a share of GNI per capita dropped by 82%. By 2012, fixed-
broadband prices represented 1.7% of monthly GNI p.c. in developed countries. In developing countries, fixed-
broadband services remain expensive, accounting for 30.1% of average monthly incomes.
In 95 countries – including 48 developing countries – the price of a monthly fixed-broadband subscription
represented 5% or less of monthly GNI p.c. in 2012.
As services are becoming more affordable, fixed-broadband uptake has shown strong growth and by 2013, there
are almost 700 million fixed-broadband subscriptions, corresponding to a global penetration rate of 9.8%.
In 2013, the total number of fixed-broadband subscriptions in developing countries surpasses those in developed
countries. But there is still a wide gap when it comes to fixed-broadband penetration rates, with 6.1% in developing
countries (and less than 1% in Sub-Saharan Africa), compared with 27.2% in developed countries.
Fixed-broadbandsub-basket
as%ofGNIp.c.
Fixed-broadbandpenetration
Source: ITU World Telecommunication /ICT Indicators database
Note: Simple averages. † Preliminary result. * Estimate
2008	2009	 2010	 2011	 2012† 2008	 2009	 2010	 2011	2012*	 2013*
2.5	 2.0	1.7	 1.7	 1.7
120
100
80
60
40
20
0
30
25
20
15
10
5
0
115.1
164.6
85.1
59.4
40.359.7
41.8
28.5 21.5
30.1
__ Developing
__ World
__ Developed
__ Developed
__ World
__ Developing
26
11
1
18
6
19
4 4 7
19
36
Developed
Developing
60
50
40
30
20
10
0
22
As fixed-broadband services become more affordable, penetration increases
Source: ITU World Telecommunication /ICT Indicators database
Note: † Preliminary result, based on 173 countries
Fixed-broadband sub-basket value 2012†
Numberofcountries
By 2012, the majority of countries have reached the Broadband Commission
target of offering basic fixed-broadband services at below 5% of monthly GNI p.c.
0-2	 2-5	 5-8	 8-10	10-20	 20-30	30-40	40-50	 >50	
27
10
6
High-speed access to the internet
Differences in broadband speed persist
Uptake of high-speed broadband (at least 10 Mbit/s) is highest in some Asian economies, including the Republic of
Korea, Hong Kong (China) and Japan, and in several European countries, such as Bulgaria, Iceland and Portugal.
In Africa, less than 10% of fixed (wired) broadband subscriptions offer speeds of at least 2 Mbit/s. This is also the
case of several countries in Asia and the Pacific, the Americas and some Arab States.
CIS
Asia & Pacific
Americas
Africa
Arab States
	0%	10%	 20%	30%	 40%	50%	 60%	70%	 80%	 90%	100%
≥10 Mbit/s ≥2 to <10 Mbit/s ≥256 kbit/s to <2 Mbit/s
Source: ITU World Telecommunication/ICT Indicators database										
Note: Refers to advertised speeds. * Data correspond to speed intervals slightly different from the ones defined by ITU. ** Breakdown
by speed available only for a part of the total fixed (wired)-broadband subscriptions. † Data include fixed wireless broadband subscriptions
Europe
Fixed-broadband subscriptions, by speed, early 2012
Korea (Rep.)
Hong Kong, China
Japan
Singapore
Macao, China
Bangladesh
Iran (I.R.)
Bhutan
Bulgaria
Iceland**
Portugal
United Kingdom
Belgium
Andorra
Denmark
Romania
Netherlands
France
Greece
Spain
Hungary
Switzerland
Czech Republic
Norway*†
Israel
Finland†
Slovenia
Slovak Republic
Ireland
Germany
Austria
Malta
Poland**
Estonia
Croatia
Cyprus†
Italy
Turkey
Bosnia and Herzegovina
United States*†
Canada*†
Brazil
Trinidad & Tobago
Chile
Colombia
Ecuador
Belize
Venezuela
Guyana
Georgia
Russia
Azerbaijan
Armenia
United Arab Emirates
Saudi Arabia*
Oman
Morocco
Jordan
Tunisia
Qatar
Egypt
Uganda
Senegal
Namibia
Côte d’Ivoire
Mauritius
Kenya
Benin
Mobile-broadband subscriptions have climbed
from 268 million in 2007 to 2.1 billion in 2013. This
reflects an average annual growth rate of 40%,
making mobile broadband the most dynamic ICT
market.
In developing countries, the number of mobile-
broadband subscriptions more than doubled from
2011 to 2013 (from 472 million to 1.16 billion) and
surpassed those in developed countries in 2013.
Africa is the region with the highest growth rates
over the past three years and mobile-broadband
penetration has increased from 2% in 2010 to 11%
in 2013.
	 Active mobile-broadband subscriptions, 2007-2013*
Continuous high growth of mobile broadband
More than 2 billion subscriptions worldwide by end 2013*
Denom and classifications employed in these maps do not imply any opinion on the part of the ITU concerning the legal or other status of any territory or any endorsement or acceptance of any boundary.
Americas
460 million subscriptions
48% penetration
28% CAGR (2010-2013)
CIS
129 million subscriptions
46% penetration
27% CAGR (2010-2013)
Europe
422 million subscriptions
68% penetration
33% CAGR (2010-2013)
Arab States
71 million subscriptions
19% penetration
55% CAGR (2010-2013)
Africa
93 million subscriptions
11% penetration
82% CAGR (2010-2013)
Asia-Pacific
895 million subscriptions
22% penetration
45% CAGR (2010-2013)
Per100inhabitants
Source: ITU World Telecommunication /ICT Indicators database
Note: * Estimate
Source: ITU World Telecommunication /ICT Indicators database
Note: * Estimate
80
70
60
50
40
30
20
10
0
__ Developed
__ World
__ Developing
20
75
30
	2007	 2008	 2009	 2010	 2011	 2012*	 2013*
By early 2013, the price of an entry-le-
vel mobile-broadband plan represents
between 1.2-2.2% of monthly GNI p.c. in
developed countries and between 11.3-
24.7% in developing countries, depen-
ding on the type of service.
However,indevelopingcountries,mobile-
broadbandservicescostconsiderablyless
than fixed-broadband services: 18.8% of
monthly GNI p.c. for a 1 GB postpaid
computer-based mobile-broadband plan
compared to 30.1% of monthly GNI p.c.
for a postpaid fixed-broadband plan with
1 GB of data volume.
Among the four typical mobile-broad-
band plans offered in the market, post-
paid handset-based services are the
cheapest and prepaid computer-based
services are the most expensive, across
all regions.
A regional comparison highlights that mobile-broadband services remain largely unaffordable in Africa, where
the price of a computer-based plan with 1GB of data volume represents on average more than 50% of GNI p.c.
Services are most affordable in Europe, where they represent on average less than 2% of GNI p.c.
In the Arab States and Asia and the Pacific region, postpaid handset-based services are relatively affordable,
accounting for 2.2% and 3.5% of monthly GNI per capita, respectively; prices in the Americas and CIS remain
relatively high (5% or above of monthly GNI p.c.) for all mobile-broadband services.
	 Price of mobile-broadband services by region, early 2013†
Mobile broadband much more expensive
in developing countries
But considerably cheaper than fixed-broadband services
Price of mobile-broadband services, early 2013†
Postpaid
handset-based
(500 MB)
Prepaid
handset-based
(500 MB)
Postpaid
computer-based
(1 GB)
Prepaid
computer-based
(1 GB)
0	 5	 10	15	20	25
1.2
7.5
11.3
1.3
11.4
15.7
1.4
2.2
12.7
18.8
17.7
24.7
Price of service as a % of GNI per capita†
Source: ITU World Telecommunication /ICT Indicators database
Note: Simple averages. † Preliminary result
Europe Arab States CIS
The
Americas
Asia &
the Pacific
Africa
Prepaid handset-based (500 MB) 1.1 5.7 5.7 5.9 5.9 38.8
Postpaid handset-based (500 MB) 1.1 2.2 5.6 5.0 3.5 36.2
Prepaid computer-based (1 GB) 1.9 7.4 7.6 11.1 12.6 58.3
Postpaid computer-based (1 GB) 1.2 2.5 7.4 8.0 10.6 54.6
Developed
World
Developing
Source: ITU World Telecommunication /ICT Indicators database
Note: Simple averages. † Preliminary result
% of GNI per capita
Bangkok, Thailand
25-27September 2012
10th
World Telecommunication/
ICTi n d i c a t o r s
MEETING
www.itu.int/ict/wtim12
Hosted by
Organized by
YEARBOOK
Telecommunication/ICT Indicators2002–2011
STATISTICS
OF
I n t e r n a t i o n a l T e l e c o m m u n i c a t i o n U n i o n
2012
YEARBOOKOFSTATISTICS2002–2011
ITU-D
Printed in SwitzerlandGeneva – December 2012
ISBN 92-61-00000-0
*00000*
Handbookfor the collection of administrative data on
Telecommunications/ICT
2011
Printed in Switzerland
International Telecommunication Union
Telecommunication development Bureau
Place des Nations
cH-1211 Geneva 20
Switzerland
www.itu.int
I n t e r n a t i o n a l T e l e c o m m u n i c a t i o n U n i o n
HandbookforthecollectionofadministrativedataonTelecommunications/IcT
2011
I n t e r n a t i o n a l T e l e c o m m u n i c a t i o n U n i o n
Measuring
the
Information
Society
2012
MeasuringtheInformationSociety
2012
Printed in Switzerland
Geneva, 2012
ISBN 978-92-61-14071-7
Photo credits: Shutterstock
*37354*
For more information:
ICT Data and Statistics Division
Telecommunication Development Bureau
International Telecommunication Union
Place des Nations
1211 Geneva 20 - Switzerland
indicators@itu.int
www.itu.int/ict
Printed in Switzerland
Geneva, February 2013
© International Telecommunication Union
Printed in Switzerland
Geneva - April 2011
ISBN 00-00-00000-0
P A R T N E R S H I P O N M E A S U R I N G I C T F O R D E V E L O P M E N T

More Related Content

What's hot

Ericsson Mobility Report, June 2016 - Regional report North America
Ericsson Mobility Report, June 2016 - Regional report North AmericaEricsson Mobility Report, June 2016 - Regional report North America
Ericsson Mobility Report, June 2016 - Regional report North AmericaEricsson
 
Internet trends 2016
Internet trends 2016Internet trends 2016
Internet trends 2016Chris Ellis
 
Ericsson Mobility Report - June 2015 - Europe appendix
Ericsson Mobility Report - June 2015 - Europe appendixEricsson Mobility Report - June 2015 - Europe appendix
Ericsson Mobility Report - June 2015 - Europe appendixEricsson
 
Jumptap screen jumping_study
Jumptap screen jumping_studyJumptap screen jumping_study
Jumptap screen jumping_studyFrançois Avril
 
Vietnam internet user’s behaviour 2016
Vietnam internet user’s behaviour 2016Vietnam internet user’s behaviour 2016
Vietnam internet user’s behaviour 2016Xuân Lan Nguyễn
 
We are YRoam. Connecting you for less.
We are YRoam. Connecting you for less. We are YRoam. Connecting you for less.
We are YRoam. Connecting you for less. Caterina Luckhurst
 
How audiences use technology and its impact on their lives
How audiences use technology and its impact on their livesHow audiences use technology and its impact on their lives
How audiences use technology and its impact on their livesRR Digital Marketing
 
Cisco Visual Networking Index (VNI) Global Mobile Data Traffic Forecast Update
Cisco Visual Networking Index (VNI) Global Mobile Data Traffic Forecast UpdateCisco Visual Networking Index (VNI) Global Mobile Data Traffic Forecast Update
Cisco Visual Networking Index (VNI) Global Mobile Data Traffic Forecast UpdateMr Nyak
 
Ericsson Traffic and Market Report- June 2012
Ericsson Traffic and Market Report- June 2012Ericsson Traffic and Market Report- June 2012
Ericsson Traffic and Market Report- June 2012Ericsson Slides
 
Ericsson Mobility Report, November 2015 - Regional report North America
Ericsson Mobility Report, November 2015 - Regional report North AmericaEricsson Mobility Report, November 2015 - Regional report North America
Ericsson Mobility Report, November 2015 - Regional report North AmericaEricsson
 
Ericsson Mobility Report, November 2015 - Regional report North East Asia
Ericsson Mobility Report, November 2015 - Regional report North East AsiaEricsson Mobility Report, November 2015 - Regional report North East Asia
Ericsson Mobility Report, November 2015 - Regional report North East AsiaEricsson
 
2019 q4 emr-november-2019
2019 q4 emr-november-20192019 q4 emr-november-2019
2019 q4 emr-november-2019MohamadSinger
 
Reuters digital news report 2013
Reuters digital news report 2013Reuters digital news report 2013
Reuters digital news report 2013Nic Newman
 
Gsma data-demand-explained-june-2015
Gsma data-demand-explained-june-2015Gsma data-demand-explained-june-2015
Gsma data-demand-explained-june-2015Ketut Widya
 
Turkish Digital Landscape in a Nutshell
Turkish Digital Landscape in a NutshellTurkish Digital Landscape in a Nutshell
Turkish Digital Landscape in a NutshellIAB Turkey
 

What's hot (20)

Ericsson Mobility Report, June 2016 - Regional report North America
Ericsson Mobility Report, June 2016 - Regional report North AmericaEricsson Mobility Report, June 2016 - Regional report North America
Ericsson Mobility Report, June 2016 - Regional report North America
 
Mobile Broadband Growth - Reports from HSPA Operators Worldwide August 2010
Mobile Broadband Growth - Reports from HSPA Operators Worldwide August 2010Mobile Broadband Growth - Reports from HSPA Operators Worldwide August 2010
Mobile Broadband Growth - Reports from HSPA Operators Worldwide August 2010
 
Internet trends 2016
Internet trends 2016Internet trends 2016
Internet trends 2016
 
Ericsson Mobility Report - June 2015 - Europe appendix
Ericsson Mobility Report - June 2015 - Europe appendixEricsson Mobility Report - June 2015 - Europe appendix
Ericsson Mobility Report - June 2015 - Europe appendix
 
Jumptap screen jumping_study
Jumptap screen jumping_studyJumptap screen jumping_study
Jumptap screen jumping_study
 
Vietnam internet user’s behaviour 2016
Vietnam internet user’s behaviour 2016Vietnam internet user’s behaviour 2016
Vietnam internet user’s behaviour 2016
 
We are YRoam. Connecting you for less.
We are YRoam. Connecting you for less. We are YRoam. Connecting you for less.
We are YRoam. Connecting you for less.
 
Abhinav presettation
Abhinav presettationAbhinav presettation
Abhinav presettation
 
How audiences use technology and its impact on their lives
How audiences use technology and its impact on their livesHow audiences use technology and its impact on their lives
How audiences use technology and its impact on their lives
 
Cisco Visual Networking Index (VNI) Global Mobile Data Traffic Forecast Update
Cisco Visual Networking Index (VNI) Global Mobile Data Traffic Forecast UpdateCisco Visual Networking Index (VNI) Global Mobile Data Traffic Forecast Update
Cisco Visual Networking Index (VNI) Global Mobile Data Traffic Forecast Update
 
Ericsson Traffic and Market Report- June 2012
Ericsson Traffic and Market Report- June 2012Ericsson Traffic and Market Report- June 2012
Ericsson Traffic and Market Report- June 2012
 
Digital News Report 2019
Digital News Report 2019Digital News Report 2019
Digital News Report 2019
 
Ericsson Mobility Report, November 2015 - Regional report North America
Ericsson Mobility Report, November 2015 - Regional report North AmericaEricsson Mobility Report, November 2015 - Regional report North America
Ericsson Mobility Report, November 2015 - Regional report North America
 
Ericsson Mobility Report, November 2015 - Regional report North East Asia
Ericsson Mobility Report, November 2015 - Regional report North East AsiaEricsson Mobility Report, November 2015 - Regional report North East Asia
Ericsson Mobility Report, November 2015 - Regional report North East Asia
 
Digital News Report 2018
Digital News Report 2018Digital News Report 2018
Digital News Report 2018
 
2019 q4 emr-november-2019
2019 q4 emr-november-20192019 q4 emr-november-2019
2019 q4 emr-november-2019
 
The mobile economy_2013
The mobile economy_2013The mobile economy_2013
The mobile economy_2013
 
Reuters digital news report 2013
Reuters digital news report 2013Reuters digital news report 2013
Reuters digital news report 2013
 
Gsma data-demand-explained-june-2015
Gsma data-demand-explained-june-2015Gsma data-demand-explained-june-2015
Gsma data-demand-explained-june-2015
 
Turkish Digital Landscape in a Nutshell
Turkish Digital Landscape in a NutshellTurkish Digital Landscape in a Nutshell
Turkish Digital Landscape in a Nutshell
 

Viewers also liked

Présentation barometre mobile marketing association france
Présentation barometre mobile marketing association francePrésentation barometre mobile marketing association france
Présentation barometre mobile marketing association franceThierry Pires
 
4th Generation Regulation: driving digital communications ahead
4th Generation Regulation: driving digital communications ahead4th Generation Regulation: driving digital communications ahead
4th Generation Regulation: driving digital communications aheadITU
 
Les usages observés du smartphone - Enquête
Les usages observés du smartphone - EnquêteLes usages observés du smartphone - Enquête
Les usages observés du smartphone - EnquêteUXD Meetup
 
Les Gagnants LesAppAwards_2016
Les Gagnants LesAppAwards_2016Les Gagnants LesAppAwards_2016
Les Gagnants LesAppAwards_2016servicesmobiles.fr
 
Stihl catalogo promocoes
Stihl catalogo promocoesStihl catalogo promocoes
Stihl catalogo promocoessonia_marga
 
ピクト図解 Bmキャンバス v2.1
ピクト図解 Bmキャンバス v2.1ピクト図解 Bmキャンバス v2.1
ピクト図解 Bmキャンバス v2.1Hidehiko Akasaka
 
157 Mobile App Stats You Should Know About
157 Mobile App Stats You Should Know About157 Mobile App Stats You Should Know About
157 Mobile App Stats You Should Know AboutStuart Dredge
 
Le Retargeting, promesses et réalité
Le Retargeting, promesses et réalitéLe Retargeting, promesses et réalité
Le Retargeting, promesses et réalitéJerome Sutter
 
Atelier Start'UP : Les clés d'un bon prévisionnel financier
Atelier Start'UP : Les clés d'un bon prévisionnel financierAtelier Start'UP : Les clés d'un bon prévisionnel financier
Atelier Start'UP : Les clés d'un bon prévisionnel financierConnecting Startups
 

Viewers also liked (16)

Présentation barometre mobile marketing association france
Présentation barometre mobile marketing association francePrésentation barometre mobile marketing association france
Présentation barometre mobile marketing association france
 
Session 5 Les AppAwards 2016
Session 5 Les AppAwards 2016Session 5 Les AppAwards 2016
Session 5 Les AppAwards 2016
 
Session 4 Les AppAwards 2016
Session 4 Les AppAwards 2016Session 4 Les AppAwards 2016
Session 4 Les AppAwards 2016
 
Session 7 Les AppAwards 2016
Session 7 Les AppAwards 2016Session 7 Les AppAwards 2016
Session 7 Les AppAwards 2016
 
Session 6 Les AppAwards 2016
Session 6 Les AppAwards 2016Session 6 Les AppAwards 2016
Session 6 Les AppAwards 2016
 
Session 8 Les AppAwards 2016
Session 8 Les AppAwards 2016Session 8 Les AppAwards 2016
Session 8 Les AppAwards 2016
 
4th Generation Regulation: driving digital communications ahead
4th Generation Regulation: driving digital communications ahead4th Generation Regulation: driving digital communications ahead
4th Generation Regulation: driving digital communications ahead
 
Les usages observés du smartphone - Enquête
Les usages observés du smartphone - EnquêteLes usages observés du smartphone - Enquête
Les usages observés du smartphone - Enquête
 
Les Gagnants LesAppAwards_2016
Les Gagnants LesAppAwards_2016Les Gagnants LesAppAwards_2016
Les Gagnants LesAppAwards_2016
 
Stihl catalogo promocoes
Stihl catalogo promocoesStihl catalogo promocoes
Stihl catalogo promocoes
 
ピクト図解 Bmキャンバス v2.1
ピクト図解 Bmキャンバス v2.1ピクト図解 Bmキャンバス v2.1
ピクト図解 Bmキャンバス v2.1
 
157 Mobile App Stats You Should Know About
157 Mobile App Stats You Should Know About157 Mobile App Stats You Should Know About
157 Mobile App Stats You Should Know About
 
Le Retargeting, promesses et réalité
Le Retargeting, promesses et réalitéLe Retargeting, promesses et réalité
Le Retargeting, promesses et réalité
 
Atelier Start'UP : Les clés d'un bon prévisionnel financier
Atelier Start'UP : Les clés d'un bon prévisionnel financierAtelier Start'UP : Les clés d'un bon prévisionnel financier
Atelier Start'UP : Les clés d'un bon prévisionnel financier
 
Digital, Social & Mobile in 2015
Digital, Social & Mobile in 2015Digital, Social & Mobile in 2015
Digital, Social & Mobile in 2015
 
Digital in 2016
Digital in 2016Digital in 2016
Digital in 2016
 

Similar to The World in 2013 : ICTFacts and Figures

Ict facts figures2013-e
Ict facts figures2013-eIct facts figures2013-e
Ict facts figures2013-ecrc.gov.mn crc
 
ICT Facts and Figures - 2013
ICT Facts and Figures - 2013ICT Facts and Figures - 2013
ICT Facts and Figures - 2013Prayukth K V
 
Global Partnerships, Target 8F
Global Partnerships, Target 8FGlobal Partnerships, Target 8F
Global Partnerships, Target 8FGrace Dopico
 
World telecommunication ict indicators database facts figures 2019
World telecommunication ict indicators database facts figures 2019World telecommunication ict indicators database facts figures 2019
World telecommunication ict indicators database facts figures 2019Tống Bảo Hoàng
 
Speeding-up the Broadband Ubiquity in Europe
Speeding-up the Broadband Ubiquity in EuropeSpeeding-up the Broadband Ubiquity in Europe
Speeding-up the Broadband Ubiquity in EuropeJaroslaw Ponder
 
Consumer barriers to mobile internet adoption in Asia
Consumer barriers to mobile internet adoption in AsiaConsumer barriers to mobile internet adoption in Asia
Consumer barriers to mobile internet adoption in AsiaTuan Anh Nguyen
 
Who´s connected Who´s not - worldwide in 2016
Who´s connected Who´s not - worldwide in 2016Who´s connected Who´s not - worldwide in 2016
Who´s connected Who´s not - worldwide in 2016Amalist Client Services
 
Opportunities together: public private partnerships in M-Agriculture
Opportunities together: public private partnerships in M-AgricultureOpportunities together: public private partnerships in M-Agriculture
Opportunities together: public private partnerships in M-Agricultureiaaldafrika
 
ITU Global developments 2003 2013
ITU Global developments 2003 2013ITU Global developments 2003 2013
ITU Global developments 2003 2013Nigel Telesford
 
O. kahiya opportunity of mobile broadband - techzim
O. kahiya   opportunity of mobile broadband - techzimO. kahiya   opportunity of mobile broadband - techzim
O. kahiya opportunity of mobile broadband - techzimtechzimslides
 
The Indian Perspectives on ICT Policy
The Indian Perspectives on ICT PolicyThe Indian Perspectives on ICT Policy
The Indian Perspectives on ICT Policybagchinirmalya
 
The Mobile Economy Europe 2015
The Mobile Economy Europe 2015The Mobile Economy Europe 2015
The Mobile Economy Europe 2015OptimediaSpain
 
SparkLabs Global Wireless Industry Overview 2014
SparkLabs Global Wireless Industry Overview 2014SparkLabs Global Wireless Industry Overview 2014
SparkLabs Global Wireless Industry Overview 2014Bernard Moon
 

Similar to The World in 2013 : ICTFacts and Figures (20)

Ict facts figures2013-e
Ict facts figures2013-eIct facts figures2013-e
Ict facts figures2013-e
 
ICT Facts and Figures - 2013
ICT Facts and Figures - 2013ICT Facts and Figures - 2013
ICT Facts and Figures - 2013
 
Global Partnerships, Target 8F
Global Partnerships, Target 8FGlobal Partnerships, Target 8F
Global Partnerships, Target 8F
 
World telecommunication ict indicators database facts figures 2019
World telecommunication ict indicators database facts figures 2019World telecommunication ict indicators database facts figures 2019
World telecommunication ict indicators database facts figures 2019
 
LTE Market in Africa
LTE Market in Africa LTE Market in Africa
LTE Market in Africa
 
Global Internet Penetration
Global Internet PenetrationGlobal Internet Penetration
Global Internet Penetration
 
Speeding-up the Broadband Ubiquity in Europe
Speeding-up the Broadband Ubiquity in EuropeSpeeding-up the Broadband Ubiquity in Europe
Speeding-up the Broadband Ubiquity in Europe
 
2015 ReSAKSS Conference – Day 2 - Maximo Torero
2015 ReSAKSS Conference – Day 2 - Maximo Torero2015 ReSAKSS Conference – Day 2 - Maximo Torero
2015 ReSAKSS Conference – Day 2 - Maximo Torero
 
Consumer barriers to mobile internet adoption in Asia
Consumer barriers to mobile internet adoption in AsiaConsumer barriers to mobile internet adoption in Asia
Consumer barriers to mobile internet adoption in Asia
 
State of Internet 2015
State of Internet 2015State of Internet 2015
State of Internet 2015
 
Who´s connected Who´s not - worldwide in 2016
Who´s connected Who´s not - worldwide in 2016Who´s connected Who´s not - worldwide in 2016
Who´s connected Who´s not - worldwide in 2016
 
Opportunities together: public private partnerships in M-Agriculture
Opportunities together: public private partnerships in M-AgricultureOpportunities together: public private partnerships in M-Agriculture
Opportunities together: public private partnerships in M-Agriculture
 
MTBiz May-June 2014
MTBiz May-June 2014MTBiz May-June 2014
MTBiz May-June 2014
 
ITU Global developments 2003 2013
ITU Global developments 2003 2013ITU Global developments 2003 2013
ITU Global developments 2003 2013
 
O. kahiya opportunity of mobile broadband - techzim
O. kahiya   opportunity of mobile broadband - techzimO. kahiya   opportunity of mobile broadband - techzim
O. kahiya opportunity of mobile broadband - techzim
 
The Indian Perspectives on ICT Policy
The Indian Perspectives on ICT PolicyThe Indian Perspectives on ICT Policy
The Indian Perspectives on ICT Policy
 
The Mobile Economy Europe 2015
The Mobile Economy Europe 2015The Mobile Economy Europe 2015
The Mobile Economy Europe 2015
 
Pricing Benchmark 4^Edition 2015
Pricing Benchmark 4^Edition 2015Pricing Benchmark 4^Edition 2015
Pricing Benchmark 4^Edition 2015
 
Mobility and Media in Africa
Mobility and Media in Africa Mobility and Media in Africa
Mobility and Media in Africa
 
SparkLabs Global Wireless Industry Overview 2014
SparkLabs Global Wireless Industry Overview 2014SparkLabs Global Wireless Industry Overview 2014
SparkLabs Global Wireless Industry Overview 2014
 

More from Thierry Pires

MForum20 Digital Wallonie M-commerce - @thierry pires
MForum20 Digital Wallonie M-commerce - @thierry piresMForum20 Digital Wallonie M-commerce - @thierry pires
MForum20 Digital Wallonie M-commerce - @thierry piresThierry Pires
 
14ème édition de l’Observatoire de l’e‐pub
14ème édition de l’Observatoire de l’e‐pub14ème édition de l’Observatoire de l’e‐pub
14ème édition de l’Observatoire de l’e‐pubThierry Pires
 
Les grands enjeux b2 b du marketing mobile - 2 juillet
Les grands enjeux b2 b du marketing mobile - 2 juilletLes grands enjeux b2 b du marketing mobile - 2 juillet
Les grands enjeux b2 b du marketing mobile - 2 juilletThierry Pires
 
Livre blanc stratégies marketing les dessous de la performance web
Livre blanc stratégies marketing les dessous de la performance webLivre blanc stratégies marketing les dessous de la performance web
Livre blanc stratégies marketing les dessous de la performance webThierry Pires
 
Soirée psoriasis 2.0 1er décembre 2014 - Présentation Marketing mobile - Thie...
Soirée psoriasis 2.0 1er décembre 2014 - Présentation Marketing mobile - Thie...Soirée psoriasis 2.0 1er décembre 2014 - Présentation Marketing mobile - Thie...
Soirée psoriasis 2.0 1er décembre 2014 - Présentation Marketing mobile - Thie...Thierry Pires
 
Multi screen-moblie-whitepaper research-studies
Multi screen-moblie-whitepaper research-studiesMulti screen-moblie-whitepaper research-studies
Multi screen-moblie-whitepaper research-studiesThierry Pires
 
Deloitte mobile consumer_2014 (UK)
Deloitte mobile consumer_2014 (UK)Deloitte mobile consumer_2014 (UK)
Deloitte mobile consumer_2014 (UK)Thierry Pires
 
Sociomantic : étude power to the screens
Sociomantic : étude power to the screensSociomantic : étude power to the screens
Sociomantic : étude power to the screensThierry Pires
 
Etude sur les acheteurs en ligne idealo
Etude sur les acheteurs en ligne idealoEtude sur les acheteurs en ligne idealo
Etude sur les acheteurs en ligne idealoThierry Pires
 
Keynote marketing mobile : Mobile is mainstream, it’s now or never !
Keynote marketing mobile : Mobile is mainstream, it’s now or never !Keynote marketing mobile : Mobile is mainstream, it’s now or never !
Keynote marketing mobile : Mobile is mainstream, it’s now or never !Thierry Pires
 
Baromètre mobile marketing association france 3ème trimestre 2013
Baromètre mobile marketing association france  3ème trimestre 2013Baromètre mobile marketing association france  3ème trimestre 2013
Baromètre mobile marketing association france 3ème trimestre 2013Thierry Pires
 
Mma location-terminology guide final
Mma location-terminology guide finalMma location-terminology guide final
Mma location-terminology guide finalThierry Pires
 
Webinar MMA LOCATION TERMINOLOGY GUIDE - THE LANGUAGE OF LOCATION
Webinar MMA LOCATION TERMINOLOGY GUIDE - THE LANGUAGE OF LOCATIONWebinar MMA LOCATION TERMINOLOGY GUIDE - THE LANGUAGE OF LOCATION
Webinar MMA LOCATION TERMINOLOGY GUIDE - THE LANGUAGE OF LOCATIONThierry Pires
 
Baromètre mobile marketing association france : 2ème trimestre 2013
Baromètre mobile marketing association france : 2ème trimestre 2013Baromètre mobile marketing association france : 2ème trimestre 2013
Baromètre mobile marketing association france : 2ème trimestre 2013Thierry Pires
 
Les dix commandements du QR Code selon Unitag
Les dix commandements du QR Code selon UnitagLes dix commandements du QR Code selon Unitag
Les dix commandements du QR Code selon UnitagThierry Pires
 
Slow steady apppromo-whitepaper2013
Slow steady apppromo-whitepaper2013Slow steady apppromo-whitepaper2013
Slow steady apppromo-whitepaper2013Thierry Pires
 
FEVAD chiffres clés 2013
FEVAD chiffres clés 2013FEVAD chiffres clés 2013
FEVAD chiffres clés 2013Thierry Pires
 
Baromètre mobile marketing association France mai 2013
Baromètre mobile marketing association France mai 2013Baromètre mobile marketing association France mai 2013
Baromètre mobile marketing association France mai 2013Thierry Pires
 
Livre Blanc : l’importance de la maintenance d’une application mobile selon H...
Livre Blanc : l’importance de la maintenance d’une application mobile selon H...Livre Blanc : l’importance de la maintenance d’une application mobile selon H...
Livre Blanc : l’importance de la maintenance d’une application mobile selon H...Thierry Pires
 
Nielsen Research: Mobile consumer report 2013
Nielsen Research: Mobile consumer report 2013Nielsen Research: Mobile consumer report 2013
Nielsen Research: Mobile consumer report 2013Thierry Pires
 

More from Thierry Pires (20)

MForum20 Digital Wallonie M-commerce - @thierry pires
MForum20 Digital Wallonie M-commerce - @thierry piresMForum20 Digital Wallonie M-commerce - @thierry pires
MForum20 Digital Wallonie M-commerce - @thierry pires
 
14ème édition de l’Observatoire de l’e‐pub
14ème édition de l’Observatoire de l’e‐pub14ème édition de l’Observatoire de l’e‐pub
14ème édition de l’Observatoire de l’e‐pub
 
Les grands enjeux b2 b du marketing mobile - 2 juillet
Les grands enjeux b2 b du marketing mobile - 2 juilletLes grands enjeux b2 b du marketing mobile - 2 juillet
Les grands enjeux b2 b du marketing mobile - 2 juillet
 
Livre blanc stratégies marketing les dessous de la performance web
Livre blanc stratégies marketing les dessous de la performance webLivre blanc stratégies marketing les dessous de la performance web
Livre blanc stratégies marketing les dessous de la performance web
 
Soirée psoriasis 2.0 1er décembre 2014 - Présentation Marketing mobile - Thie...
Soirée psoriasis 2.0 1er décembre 2014 - Présentation Marketing mobile - Thie...Soirée psoriasis 2.0 1er décembre 2014 - Présentation Marketing mobile - Thie...
Soirée psoriasis 2.0 1er décembre 2014 - Présentation Marketing mobile - Thie...
 
Multi screen-moblie-whitepaper research-studies
Multi screen-moblie-whitepaper research-studiesMulti screen-moblie-whitepaper research-studies
Multi screen-moblie-whitepaper research-studies
 
Deloitte mobile consumer_2014 (UK)
Deloitte mobile consumer_2014 (UK)Deloitte mobile consumer_2014 (UK)
Deloitte mobile consumer_2014 (UK)
 
Sociomantic : étude power to the screens
Sociomantic : étude power to the screensSociomantic : étude power to the screens
Sociomantic : étude power to the screens
 
Etude sur les acheteurs en ligne idealo
Etude sur les acheteurs en ligne idealoEtude sur les acheteurs en ligne idealo
Etude sur les acheteurs en ligne idealo
 
Keynote marketing mobile : Mobile is mainstream, it’s now or never !
Keynote marketing mobile : Mobile is mainstream, it’s now or never !Keynote marketing mobile : Mobile is mainstream, it’s now or never !
Keynote marketing mobile : Mobile is mainstream, it’s now or never !
 
Baromètre mobile marketing association france 3ème trimestre 2013
Baromètre mobile marketing association france  3ème trimestre 2013Baromètre mobile marketing association france  3ème trimestre 2013
Baromètre mobile marketing association france 3ème trimestre 2013
 
Mma location-terminology guide final
Mma location-terminology guide finalMma location-terminology guide final
Mma location-terminology guide final
 
Webinar MMA LOCATION TERMINOLOGY GUIDE - THE LANGUAGE OF LOCATION
Webinar MMA LOCATION TERMINOLOGY GUIDE - THE LANGUAGE OF LOCATIONWebinar MMA LOCATION TERMINOLOGY GUIDE - THE LANGUAGE OF LOCATION
Webinar MMA LOCATION TERMINOLOGY GUIDE - THE LANGUAGE OF LOCATION
 
Baromètre mobile marketing association france : 2ème trimestre 2013
Baromètre mobile marketing association france : 2ème trimestre 2013Baromètre mobile marketing association france : 2ème trimestre 2013
Baromètre mobile marketing association france : 2ème trimestre 2013
 
Les dix commandements du QR Code selon Unitag
Les dix commandements du QR Code selon UnitagLes dix commandements du QR Code selon Unitag
Les dix commandements du QR Code selon Unitag
 
Slow steady apppromo-whitepaper2013
Slow steady apppromo-whitepaper2013Slow steady apppromo-whitepaper2013
Slow steady apppromo-whitepaper2013
 
FEVAD chiffres clés 2013
FEVAD chiffres clés 2013FEVAD chiffres clés 2013
FEVAD chiffres clés 2013
 
Baromètre mobile marketing association France mai 2013
Baromètre mobile marketing association France mai 2013Baromètre mobile marketing association France mai 2013
Baromètre mobile marketing association France mai 2013
 
Livre Blanc : l’importance de la maintenance d’une application mobile selon H...
Livre Blanc : l’importance de la maintenance d’une application mobile selon H...Livre Blanc : l’importance de la maintenance d’une application mobile selon H...
Livre Blanc : l’importance de la maintenance d’une application mobile selon H...
 
Nielsen Research: Mobile consumer report 2013
Nielsen Research: Mobile consumer report 2013Nielsen Research: Mobile consumer report 2013
Nielsen Research: Mobile consumer report 2013
 

Recently uploaded

Kenya’s Coconut Value Chain by Gatsby Africa
Kenya’s Coconut Value Chain by Gatsby AfricaKenya’s Coconut Value Chain by Gatsby Africa
Kenya’s Coconut Value Chain by Gatsby Africaictsugar
 
Pitch Deck Teardown: Geodesic.Life's $500k Pre-seed deck
Pitch Deck Teardown: Geodesic.Life's $500k Pre-seed deckPitch Deck Teardown: Geodesic.Life's $500k Pre-seed deck
Pitch Deck Teardown: Geodesic.Life's $500k Pre-seed deckHajeJanKamps
 
8447779800, Low rate Call girls in Rohini Delhi NCR
8447779800, Low rate Call girls in Rohini Delhi NCR8447779800, Low rate Call girls in Rohini Delhi NCR
8447779800, Low rate Call girls in Rohini Delhi NCRashishs7044
 
Contemporary Economic Issues Facing the Filipino Entrepreneur (1).pptx
Contemporary Economic Issues Facing the Filipino Entrepreneur (1).pptxContemporary Economic Issues Facing the Filipino Entrepreneur (1).pptx
Contemporary Economic Issues Facing the Filipino Entrepreneur (1).pptxMarkAnthonyAurellano
 
Youth Involvement in an Innovative Coconut Value Chain by Mwalimu Menza
Youth Involvement in an Innovative Coconut Value Chain by Mwalimu MenzaYouth Involvement in an Innovative Coconut Value Chain by Mwalimu Menza
Youth Involvement in an Innovative Coconut Value Chain by Mwalimu Menzaictsugar
 
FULL ENJOY Call girls in Paharganj Delhi | 8377087607
FULL ENJOY Call girls in Paharganj Delhi | 8377087607FULL ENJOY Call girls in Paharganj Delhi | 8377087607
FULL ENJOY Call girls in Paharganj Delhi | 8377087607dollysharma2066
 
Innovation Conference 5th March 2024.pdf
Innovation Conference 5th March 2024.pdfInnovation Conference 5th March 2024.pdf
Innovation Conference 5th March 2024.pdfrichard876048
 
8447779800, Low rate Call girls in Kotla Mubarakpur Delhi NCR
8447779800, Low rate Call girls in Kotla Mubarakpur Delhi NCR8447779800, Low rate Call girls in Kotla Mubarakpur Delhi NCR
8447779800, Low rate Call girls in Kotla Mubarakpur Delhi NCRashishs7044
 
8447779800, Low rate Call girls in Saket Delhi NCR
8447779800, Low rate Call girls in Saket Delhi NCR8447779800, Low rate Call girls in Saket Delhi NCR
8447779800, Low rate Call girls in Saket Delhi NCRashishs7044
 
PSCC - Capability Statement Presentation
PSCC - Capability Statement PresentationPSCC - Capability Statement Presentation
PSCC - Capability Statement PresentationAnamaria Contreras
 
Traction part 2 - EOS Model JAX Bridges.
Traction part 2 - EOS Model JAX Bridges.Traction part 2 - EOS Model JAX Bridges.
Traction part 2 - EOS Model JAX Bridges.Anamaria Contreras
 
IoT Insurance Observatory: summary 2024
IoT Insurance Observatory:  summary 2024IoT Insurance Observatory:  summary 2024
IoT Insurance Observatory: summary 2024Matteo Carbone
 
Case study on tata clothing brand zudio in detail
Case study on tata clothing brand zudio in detailCase study on tata clothing brand zudio in detail
Case study on tata clothing brand zudio in detailAriel592675
 
Future Of Sample Report 2024 | Redacted Version
Future Of Sample Report 2024 | Redacted VersionFuture Of Sample Report 2024 | Redacted Version
Future Of Sample Report 2024 | Redacted VersionMintel Group
 
Islamabad Escorts | Call 03070433345 | Escort Service in Islamabad
Islamabad Escorts | Call 03070433345 | Escort Service in IslamabadIslamabad Escorts | Call 03070433345 | Escort Service in Islamabad
Islamabad Escorts | Call 03070433345 | Escort Service in IslamabadAyesha Khan
 
Intro to BCG's Carbon Emissions Benchmark_vF.pdf
Intro to BCG's Carbon Emissions Benchmark_vF.pdfIntro to BCG's Carbon Emissions Benchmark_vF.pdf
Intro to BCG's Carbon Emissions Benchmark_vF.pdfpollardmorgan
 
MAHA Global and IPR: Do Actions Speak Louder Than Words?
MAHA Global and IPR: Do Actions Speak Louder Than Words?MAHA Global and IPR: Do Actions Speak Louder Than Words?
MAHA Global and IPR: Do Actions Speak Louder Than Words?Olivia Kresic
 

Recently uploaded (20)

Kenya’s Coconut Value Chain by Gatsby Africa
Kenya’s Coconut Value Chain by Gatsby AfricaKenya’s Coconut Value Chain by Gatsby Africa
Kenya’s Coconut Value Chain by Gatsby Africa
 
Pitch Deck Teardown: Geodesic.Life's $500k Pre-seed deck
Pitch Deck Teardown: Geodesic.Life's $500k Pre-seed deckPitch Deck Teardown: Geodesic.Life's $500k Pre-seed deck
Pitch Deck Teardown: Geodesic.Life's $500k Pre-seed deck
 
8447779800, Low rate Call girls in Rohini Delhi NCR
8447779800, Low rate Call girls in Rohini Delhi NCR8447779800, Low rate Call girls in Rohini Delhi NCR
8447779800, Low rate Call girls in Rohini Delhi NCR
 
Contemporary Economic Issues Facing the Filipino Entrepreneur (1).pptx
Contemporary Economic Issues Facing the Filipino Entrepreneur (1).pptxContemporary Economic Issues Facing the Filipino Entrepreneur (1).pptx
Contemporary Economic Issues Facing the Filipino Entrepreneur (1).pptx
 
Youth Involvement in an Innovative Coconut Value Chain by Mwalimu Menza
Youth Involvement in an Innovative Coconut Value Chain by Mwalimu MenzaYouth Involvement in an Innovative Coconut Value Chain by Mwalimu Menza
Youth Involvement in an Innovative Coconut Value Chain by Mwalimu Menza
 
FULL ENJOY Call girls in Paharganj Delhi | 8377087607
FULL ENJOY Call girls in Paharganj Delhi | 8377087607FULL ENJOY Call girls in Paharganj Delhi | 8377087607
FULL ENJOY Call girls in Paharganj Delhi | 8377087607
 
Innovation Conference 5th March 2024.pdf
Innovation Conference 5th March 2024.pdfInnovation Conference 5th March 2024.pdf
Innovation Conference 5th March 2024.pdf
 
8447779800, Low rate Call girls in Kotla Mubarakpur Delhi NCR
8447779800, Low rate Call girls in Kotla Mubarakpur Delhi NCR8447779800, Low rate Call girls in Kotla Mubarakpur Delhi NCR
8447779800, Low rate Call girls in Kotla Mubarakpur Delhi NCR
 
8447779800, Low rate Call girls in Saket Delhi NCR
8447779800, Low rate Call girls in Saket Delhi NCR8447779800, Low rate Call girls in Saket Delhi NCR
8447779800, Low rate Call girls in Saket Delhi NCR
 
Call Us ➥9319373153▻Call Girls In North Goa
Call Us ➥9319373153▻Call Girls In North GoaCall Us ➥9319373153▻Call Girls In North Goa
Call Us ➥9319373153▻Call Girls In North Goa
 
No-1 Call Girls In Goa 93193 VIP 73153 Escort service In North Goa Panaji, Ca...
No-1 Call Girls In Goa 93193 VIP 73153 Escort service In North Goa Panaji, Ca...No-1 Call Girls In Goa 93193 VIP 73153 Escort service In North Goa Panaji, Ca...
No-1 Call Girls In Goa 93193 VIP 73153 Escort service In North Goa Panaji, Ca...
 
PSCC - Capability Statement Presentation
PSCC - Capability Statement PresentationPSCC - Capability Statement Presentation
PSCC - Capability Statement Presentation
 
Traction part 2 - EOS Model JAX Bridges.
Traction part 2 - EOS Model JAX Bridges.Traction part 2 - EOS Model JAX Bridges.
Traction part 2 - EOS Model JAX Bridges.
 
IoT Insurance Observatory: summary 2024
IoT Insurance Observatory:  summary 2024IoT Insurance Observatory:  summary 2024
IoT Insurance Observatory: summary 2024
 
Case study on tata clothing brand zudio in detail
Case study on tata clothing brand zudio in detailCase study on tata clothing brand zudio in detail
Case study on tata clothing brand zudio in detail
 
Future Of Sample Report 2024 | Redacted Version
Future Of Sample Report 2024 | Redacted VersionFuture Of Sample Report 2024 | Redacted Version
Future Of Sample Report 2024 | Redacted Version
 
Islamabad Escorts | Call 03070433345 | Escort Service in Islamabad
Islamabad Escorts | Call 03070433345 | Escort Service in IslamabadIslamabad Escorts | Call 03070433345 | Escort Service in Islamabad
Islamabad Escorts | Call 03070433345 | Escort Service in Islamabad
 
Intro to BCG's Carbon Emissions Benchmark_vF.pdf
Intro to BCG's Carbon Emissions Benchmark_vF.pdfIntro to BCG's Carbon Emissions Benchmark_vF.pdf
Intro to BCG's Carbon Emissions Benchmark_vF.pdf
 
MAHA Global and IPR: Do Actions Speak Louder Than Words?
MAHA Global and IPR: Do Actions Speak Louder Than Words?MAHA Global and IPR: Do Actions Speak Louder Than Words?
MAHA Global and IPR: Do Actions Speak Louder Than Words?
 
Japan IT Week 2024 Brochure by 47Billion (English)
Japan IT Week 2024 Brochure by 47Billion (English)Japan IT Week 2024 Brochure by 47Billion (English)
Japan IT Week 2024 Brochure by 47Billion (English)
 

The World in 2013 : ICTFacts and Figures

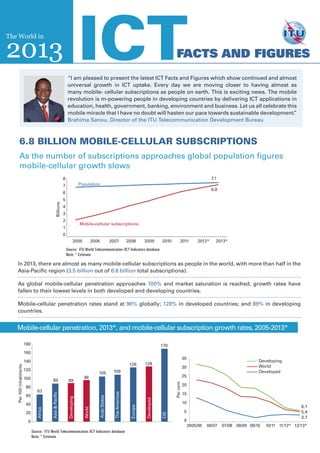
  • 1. 6.8 billion mobile-cellular subscriptions As the number of subscriptions approaches global population figures mobile-cellular growth slows The World in 2013 ICTFacts and Figures In 2013, there are almost as many mobile-cellular subscriptions as people in the world, with more than half in the Asia-Pacific region (3.5 billion out of 6.8 billion total subscriptions). As global mobile-cellular penetration approaches 100% and market saturation is reached, growth rates have fallen to their lowest levels in both developed and developing countries. Mobile-cellular penetration rates stand at 96% globally; 128% in developed countries; and 89% in developing countries. Source: ITU World Telecommunication /ICT Indicators database Note: * Estimate Billions 7.1 6.8 8 7 6 5 4 3 2 1 0 2005 2006 2007 2008 2009 2010 2011 2012* 2013* Population Mobile-cellular subscriptions Mobile-cellular penetration, 2013*, and mobile-cellular subscription growth rates, 2005-2013* 180 160 140 120 100 80 60 40 20 0 63 89 89 96 105 109 126 128 Source: ITU World Telecommunication /ICT Indicators database Note: * Estimate 2005/06 06/07 07/08 08/09 09/10 10/11 11/12* 12/13* 35 30 25 20 15 10 5 0 6.1 5.4 3.7 __ Developing __ World __ Developed 170 Africa Asia&Pacific Developing World ArabStates TheAmericas Europe Developed CIS Percent Per100inhabitants “I am pleased to present the latest ICT Facts and Figures which show continued and almost universal growth in ICT uptake. Every day we are moving closer to having almost as many mobile- cellular subscriptions as people on earth. This is exciting news. The mobile revolution is m-powering people in developing countries by delivering ICT applications in education, health, government, banking, environment and business. Let us all celebrate this mobile miracle that I have no doubt will hasten our pace towards sustainable development.” Brahima Sanou, Director of the ITU Telecommunication Development Bureau
  • 2. 2.7 billion people – almost 40% of the world’s population – are online In developing countries, 16% fewer women than men use the Internet Internet users by development level, 2003-2013*, and by region, 2013* The gender gap: men and women online, totals and penetration rates, 2013* In 2013, over 2.7 billion people are using the Internet, which corresponds to 39% of the world’s population. In the developing world, 31% of the population is online, compared with 77% in the developed world. Europe is the region with the highest Internet penetration rate in the world (75%), followed by the Americas (61%). In Africa, 16% of people are using the Internet – only half the penetration rate of Asia and the Pacific. Source: ITU World Telecommunication /ICT Indicators database Note: * Estimate Source: ITU World Telecommunication /ICT Indicators database Note: * Estimate Per100inhabitants Africa Asia Arab CIS The Europe & Pacific States Americas 16 32 52 38 61 75 80 70 60 50 40 30 20 10 0 80 70 60 50 40 30 20 10 0 Per100inhabitants __ Developed __ World __ Developing 2003 04 05 06 07 08 09 10 11 12* 13* 74% 80% 29% 37% 41% 33% Women Men Women Men Women Men Developed Developing World 1.4 1.2 1.0 0.8 0.6 0.4 0.2 0.0 Billionsofpeople Internet users % all of men/women More men than women use the Internet: globally, 37% of all women are online, compared with 41% of all men. This corresponds to 1.3 billion women and 1.5 billion men. The developing world is home to about 826 million female Internet users and 980 million male Internet users. The developed world is home to about 475 million female Internet users and 483 million male Internet users. The gender gap is more pronounced in the developing world, where 16% fewer women than men use the Internet, compared with only 2% fewer women than men in the developed world. 77 39 31
  • 3. Households with Internet access, 2013* Households with Internet access, by region 750 million households – 41% globally – connected to the Internet In 2013, 41% of the world’s households are connected to the Internet. Half of them are in the developing world, where household Internet penetration has reached 28%. In the developed world, 78% of all households are connected to the Internet. 90% of the 1.1 billion households not connected to the Internet are in the developing world. Europe and Africa are the regions with the highest and the lowest levels of household Internet penetration respectively: 77% in Europe, compared with 7% in Africa. The majority of households in the Americas are online (61%), compared with around one third of households in the Arab States and Asia and the Pacific. Between 2009 and 2013, Internet penetration in households has grown fastest in Africa, with annual growth of 27%, followed by 15% annual growth in Asia and the Pacific, the Arab States and the CIS. C 10Y 100 M 75 K 15 C 74Y 45 M 0 K 27 C 70Y 15 M 0 K 12 C 50Y 10 M 100 K 0 C 0Y 50 M 100 K 0 MAIN COLOURS SECONDARY COLOURS Developing countries Developed countries Source: ITU World Telecommunication /ICT Indicators database Note: * Estimate Source: ITU World Telecommunication /ICT Indicators database Note: * Estimate __Europe __The Americas __CIS __Arab States __Asia & Pacific __Africa 2005 2006 2007 2008 2009 2010 2011 2012* 2013* PercentageofhouseholdswithInternetaccess 77 61 46 34 33 7 90 80 70 60 50 40 30 20 10 0 Households without Internet 960 million 108 million 376 million Households with Internet 373 million
  • 4. Fixed-broadband prices drop by 82% between 2008 and 2012 Over the past five years, fixed-broadband prices as a share of GNI per capita dropped by 82%. By 2012, fixed- broadband prices represented 1.7% of monthly GNI p.c. in developed countries. In developing countries, fixed- broadband services remain expensive, accounting for 30.1% of average monthly incomes. In 95 countries – including 48 developing countries – the price of a monthly fixed-broadband subscription represented 5% or less of monthly GNI p.c. in 2012. As services are becoming more affordable, fixed-broadband uptake has shown strong growth and by 2013, there are almost 700 million fixed-broadband subscriptions, corresponding to a global penetration rate of 9.8%. In 2013, the total number of fixed-broadband subscriptions in developing countries surpasses those in developed countries. But there is still a wide gap when it comes to fixed-broadband penetration rates, with 6.1% in developing countries (and less than 1% in Sub-Saharan Africa), compared with 27.2% in developed countries. Fixed-broadbandsub-basket as%ofGNIp.c. Fixed-broadbandpenetration Source: ITU World Telecommunication /ICT Indicators database Note: Simple averages. † Preliminary result. * Estimate 2008 2009 2010 2011 2012† 2008 2009 2010 2011 2012* 2013* 2.5 2.0 1.7 1.7 1.7 120 100 80 60 40 20 0 30 25 20 15 10 5 0 115.1 164.6 85.1 59.4 40.359.7 41.8 28.5 21.5 30.1 __ Developing __ World __ Developed __ Developed __ World __ Developing 26 11 1 18 6 19 4 4 7 19 36 Developed Developing 60 50 40 30 20 10 0 22 As fixed-broadband services become more affordable, penetration increases Source: ITU World Telecommunication /ICT Indicators database Note: † Preliminary result, based on 173 countries Fixed-broadband sub-basket value 2012† Numberofcountries By 2012, the majority of countries have reached the Broadband Commission target of offering basic fixed-broadband services at below 5% of monthly GNI p.c. 0-2 2-5 5-8 8-10 10-20 20-30 30-40 40-50 >50 27 10 6
  • 5. High-speed access to the internet Differences in broadband speed persist Uptake of high-speed broadband (at least 10 Mbit/s) is highest in some Asian economies, including the Republic of Korea, Hong Kong (China) and Japan, and in several European countries, such as Bulgaria, Iceland and Portugal. In Africa, less than 10% of fixed (wired) broadband subscriptions offer speeds of at least 2 Mbit/s. This is also the case of several countries in Asia and the Pacific, the Americas and some Arab States. CIS Asia & Pacific Americas Africa Arab States 0% 10% 20% 30% 40% 50% 60% 70% 80% 90% 100% ≥10 Mbit/s ≥2 to <10 Mbit/s ≥256 kbit/s to <2 Mbit/s Source: ITU World Telecommunication/ICT Indicators database Note: Refers to advertised speeds. * Data correspond to speed intervals slightly different from the ones defined by ITU. ** Breakdown by speed available only for a part of the total fixed (wired)-broadband subscriptions. † Data include fixed wireless broadband subscriptions Europe Fixed-broadband subscriptions, by speed, early 2012 Korea (Rep.) Hong Kong, China Japan Singapore Macao, China Bangladesh Iran (I.R.) Bhutan Bulgaria Iceland** Portugal United Kingdom Belgium Andorra Denmark Romania Netherlands France Greece Spain Hungary Switzerland Czech Republic Norway*† Israel Finland† Slovenia Slovak Republic Ireland Germany Austria Malta Poland** Estonia Croatia Cyprus† Italy Turkey Bosnia and Herzegovina United States*† Canada*† Brazil Trinidad & Tobago Chile Colombia Ecuador Belize Venezuela Guyana Georgia Russia Azerbaijan Armenia United Arab Emirates Saudi Arabia* Oman Morocco Jordan Tunisia Qatar Egypt Uganda Senegal Namibia Côte d’Ivoire Mauritius Kenya Benin
  • 6. Mobile-broadband subscriptions have climbed from 268 million in 2007 to 2.1 billion in 2013. This reflects an average annual growth rate of 40%, making mobile broadband the most dynamic ICT market. In developing countries, the number of mobile- broadband subscriptions more than doubled from 2011 to 2013 (from 472 million to 1.16 billion) and surpassed those in developed countries in 2013. Africa is the region with the highest growth rates over the past three years and mobile-broadband penetration has increased from 2% in 2010 to 11% in 2013. Active mobile-broadband subscriptions, 2007-2013* Continuous high growth of mobile broadband More than 2 billion subscriptions worldwide by end 2013* Denom and classifications employed in these maps do not imply any opinion on the part of the ITU concerning the legal or other status of any territory or any endorsement or acceptance of any boundary. Americas 460 million subscriptions 48% penetration 28% CAGR (2010-2013) CIS 129 million subscriptions 46% penetration 27% CAGR (2010-2013) Europe 422 million subscriptions 68% penetration 33% CAGR (2010-2013) Arab States 71 million subscriptions 19% penetration 55% CAGR (2010-2013) Africa 93 million subscriptions 11% penetration 82% CAGR (2010-2013) Asia-Pacific 895 million subscriptions 22% penetration 45% CAGR (2010-2013) Per100inhabitants Source: ITU World Telecommunication /ICT Indicators database Note: * Estimate Source: ITU World Telecommunication /ICT Indicators database Note: * Estimate 80 70 60 50 40 30 20 10 0 __ Developed __ World __ Developing 20 75 30 2007 2008 2009 2010 2011 2012* 2013*
  • 7. By early 2013, the price of an entry-le- vel mobile-broadband plan represents between 1.2-2.2% of monthly GNI p.c. in developed countries and between 11.3- 24.7% in developing countries, depen- ding on the type of service. However,indevelopingcountries,mobile- broadbandservicescostconsiderablyless than fixed-broadband services: 18.8% of monthly GNI p.c. for a 1 GB postpaid computer-based mobile-broadband plan compared to 30.1% of monthly GNI p.c. for a postpaid fixed-broadband plan with 1 GB of data volume. Among the four typical mobile-broad- band plans offered in the market, post- paid handset-based services are the cheapest and prepaid computer-based services are the most expensive, across all regions. A regional comparison highlights that mobile-broadband services remain largely unaffordable in Africa, where the price of a computer-based plan with 1GB of data volume represents on average more than 50% of GNI p.c. Services are most affordable in Europe, where they represent on average less than 2% of GNI p.c. In the Arab States and Asia and the Pacific region, postpaid handset-based services are relatively affordable, accounting for 2.2% and 3.5% of monthly GNI per capita, respectively; prices in the Americas and CIS remain relatively high (5% or above of monthly GNI p.c.) for all mobile-broadband services. Price of mobile-broadband services by region, early 2013† Mobile broadband much more expensive in developing countries But considerably cheaper than fixed-broadband services Price of mobile-broadband services, early 2013† Postpaid handset-based (500 MB) Prepaid handset-based (500 MB) Postpaid computer-based (1 GB) Prepaid computer-based (1 GB) 0 5 10 15 20 25 1.2 7.5 11.3 1.3 11.4 15.7 1.4 2.2 12.7 18.8 17.7 24.7 Price of service as a % of GNI per capita† Source: ITU World Telecommunication /ICT Indicators database Note: Simple averages. † Preliminary result Europe Arab States CIS The Americas Asia & the Pacific Africa Prepaid handset-based (500 MB) 1.1 5.7 5.7 5.9 5.9 38.8 Postpaid handset-based (500 MB) 1.1 2.2 5.6 5.0 3.5 36.2 Prepaid computer-based (1 GB) 1.9 7.4 7.6 11.1 12.6 58.3 Postpaid computer-based (1 GB) 1.2 2.5 7.4 8.0 10.6 54.6 Developed World Developing Source: ITU World Telecommunication /ICT Indicators database Note: Simple averages. † Preliminary result % of GNI per capita
  • 8. Bangkok, Thailand 25-27September 2012 10th World Telecommunication/ ICTi n d i c a t o r s MEETING www.itu.int/ict/wtim12 Hosted by Organized by YEARBOOK Telecommunication/ICT Indicators2002–2011 STATISTICS OF I n t e r n a t i o n a l T e l e c o m m u n i c a t i o n U n i o n 2012 YEARBOOKOFSTATISTICS2002–2011 ITU-D Printed in SwitzerlandGeneva – December 2012 ISBN 92-61-00000-0 *00000* Handbookfor the collection of administrative data on Telecommunications/ICT 2011 Printed in Switzerland International Telecommunication Union Telecommunication development Bureau Place des Nations cH-1211 Geneva 20 Switzerland www.itu.int I n t e r n a t i o n a l T e l e c o m m u n i c a t i o n U n i o n HandbookforthecollectionofadministrativedataonTelecommunications/IcT 2011 I n t e r n a t i o n a l T e l e c o m m u n i c a t i o n U n i o n Measuring the Information Society 2012 MeasuringtheInformationSociety 2012 Printed in Switzerland Geneva, 2012 ISBN 978-92-61-14071-7 Photo credits: Shutterstock *37354* For more information: ICT Data and Statistics Division Telecommunication Development Bureau International Telecommunication Union Place des Nations 1211 Geneva 20 - Switzerland indicators@itu.int www.itu.int/ict Printed in Switzerland Geneva, February 2013 © International Telecommunication Union Printed in Switzerland Geneva - April 2011 ISBN 00-00-00000-0 P A R T N E R S H I P O N M E A S U R I N G I C T F O R D E V E L O P M E N T