Auto Finance International Benchmarking
•
1 like•634 views

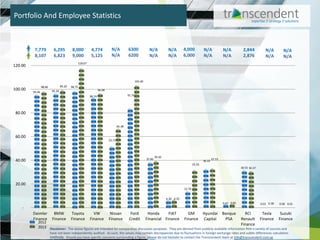
This graphic explores the performance of major captive auto finance companies based on available data. Their performance is examined in terms of contract volume and the number of employees.

Recommended
Recommended
More Related Content
Similar to Auto Finance International Benchmarking
Similar to Auto Finance International Benchmarking (20)
More from Transcendent Financial Services
More from Transcendent Financial Services (13)
Recently uploaded
Recently uploaded (20)
Auto Finance International Benchmarking
- 1. 94.46 95.24 98.75 90.74 53.71 91.70 37.83 4.30 12.70 36.33 0.47 30.55 0.01 0.00 98.66 99.20 118.67 96.08 65.38 103.40 39.50 4.35 33.33 37.73 0.82 30.37 0.38 0.01 - 20.00 40.00 60.00 80.00 100.00 120.00 Daimler Finance BMW Finance Toyota Finance VW Finance Nissan Finance Ford Credit Honda Financial FIAT Finance GM Finance Hyundai Capital Banque PSA RCI Renault Finance Tesla Finance Suzuki Finance Portfolio And Employee Statistics 2012 2013 Disclaimer: The above figures are intended for comparative discussion purposes. They are derived from publicly available information from a variety of sources and have not been independently audited. As such, the values may contain discrepancies due to fluctuations in foreign exchange rates and subtle differences calculation methods. Should you have specific concerns surrounding a figure, please do not hesitate to contact the Transcendent team at info@transcendent.com.sg 7,779 8,107 6,295 6,823 8,000 9,000 4,774 5,125 N/A N/A 6300 6200 4,000 6,000 2,844 2,876 N/A N/A N/A N/A N/A N/A N/A N/A N/A N/A N/A N/A
- 2. 2 Reference Company Item Location Link Daimler Finance Contract Volume Section D.09 http://ar2013.daimler.com/divisions/daimler-financial-services Employees BMW Finance Contract Volume Page 91 (Leased Asset + Receivables from Sales Financing + Receivables from Sales Financing (Non Current Assets) http://www.bmwgroup.com/e/0_0_www_bmwgroup_com/investor_relations/finanzberichte/ges chaeftsberichte/2013/_pdf/report2013.pdf Employees Page 43 Toyota Finance Contract Volume Page 48: Total finance receivables, net + Operating Lease (Contract Volume and Employee) 2013: http://www.toyota- global.com/investors/ir_library/annual/pdf/2013/ar13_e.pdf Employees 2012: Page 26 2013: Page 28 2012: http://www.toyota-global.com/investors/ir_library/annual/pdf/2012/ar12_e.pdf 2013: http://www.toyota-global.com/investors/ir_library/annual/pdf/2013/ar13_e.pdf VW Finance Contract Volume Page 97 (Receivables from customer in total + Leased asset) http://www.volkswagenag.com/content/vwcorp/info_center/en/publications/2014/03/FS_AG_AR _2013.bin.html/binarystorageitem/file/ar_2013_vwfsag_e2_f_sec.pdfEmployees Page 63 Nissan Finance Contract Volume Page 28 (Sales Finance - fiscal year 2012 and fiscal year 2013) http://www.nissan-global.com/EN/DOCUMENT/PDF/AR/2014/AR2014_E_All.pdf Employees Ford Credit Contract Volume Page 28 Annual Filing: 02/18/2014 Form 10-K - http://credit.ford.com/investor-center/company-reports Employees Page 7 Honda Financial Contract Volume Page 24: (as of March 2014, March 2013, March 2012) http://www.hondafinancialservices.com/INVESTOR- RELATIONS/IR_DCTM/quarterly_reports/AHFC_-_Final_Review_Draft_69.pdfEmployees Page 13: (as of March 13, 2014) FIAT Finance Contract Volume Page 60 http://www.fcagroup.com/en- US/investor_relations/financial_reports/FiatDocuments/Bilanci/2013/2013_annual_report.pdf Employees GM Finance Contract Volume 2012 (2009 - 2012 Historical Financials): Sheet Balance Sheet --> AB11 + AB12 + AB16 2013 (2013 - 2014 Historical Financials ): Sheet Originations Portfolio --> N11 (Consumer Finance Receivables + Commercial Finance Receivables + Leased Vehicle) http://www.gmfinancial.com/investors-information/financial-information/historic-financials.aspx Employees Page 18 : Employees - GM Financial© http://www.gm.com/content/dam/gmcom/COMPANY/Investors/Corporate_Governance/PDFs/Inv estorContactsPDFs/10-K.pdf Hyundai Capital Contract Volume Page 36 (Financial services receivables (Assets) + Financial services receivables (Non-current Assets) ) http://worldwide.hyundai.com/wcm/idc/groups/sggeneralcontent/@hmc/documents/sitecontent /mdaw/mdg1/~edisp/hw085130.pdf Employees Banque PSA Contract Volume Page 6 (Total Receivables (Short-term loans to group companies +Accrued interest and amounts receivable) http://www.banquepsafinance.com/docs/rapports/fr/rapports206.pdf Employees NA RCI Renault Finance Contract Volume Page 20 (NET LOANS OUTSTANDINGS AT YEAR-END) http://www.rcibanque.com/assets/RA-2013-GB-RCI-Banque.pdf Employee Page 85 Tesla Finance Contract Volume Page 91 (Operating Lease Vehicles, net) http://ir.teslamotors.com/secfiling.cfm?filingID=1193125-14-69681&CIK=1318605 Employee Suzuki Finance Contract Volume Page 9 (Long Term Loan Receivable (april 2012-march 2013 and april 2013-march 2014) http://www.globalsuzuki.com/ir/library/financialresults/pdf/2013/financial_summary.pdf Employees NA © Transcendent Research