3. Background
● Type: Public
● Traded as: NYSE: GS, Dow Jones Industrial Average Component S&P 500 Component
● Founded: 1869
● Founder: Marcus Goldman, Samuel Sachs
● Headquarters: 200 West Street, New York, New York, U.S.
● Industry: Banking, Financial services
● Area Served: Worldwide
● Number of employees: 34,000 (2014)
● Market Value of Stock: 189.16 (Nov. 2015)
● Assets: $856.24 Billion (2014)
4. Operation Segment
Segment Net Revenues
(End of June 2015, $ in Millions)
Segment Revenue
Percentage
Investment Management 9,070 55%
Institutional Client Services 3,600 21%
Investment Banking 2,020 12%
Investing & Lending 1,800 10%
6. Leadership
LLOYD C. BLANKFEIN
Chairman and Chief Executive Officer
1994, 21 years
Harvard University
GARY D. COHN
President and Chief Operating Officer
1990, 25 years
American University
MICHAEL SHERWOOD
Vice Chairman
1986, 29 years
Manchester University
MARK SCHWARTZ
Vice Chairman and Chairman of
Goldman Sachs Asia Pacific
1979, 36 years
Appalachian State University
HARVEY M. SCHWARTZ
Executive Vice President and Chief
Financial Officer
2005, 10 years
Rutgers University
EDITH W. COOPER
Executive Vice President and Global
Head of Human Capital Management
1996, 19 years
Northwestern University
7. S.W.O.T Analysis
Strength
● Strong brand name and good financial position
● Geographically present across various countries
● Diverse operations and advanced technology
Weakness
● Legal issues
● Fluctuating markets create variable revenues
● Controversies like underwriting bonds, European
debt crisis, insider trading have affected image
Opportunity
● Expansion in emerging economies
● Diversifying portfolios for customers
● Investment banking is growing
Threats
● Changing government regulations and financial
crisis like recessions
● Variable interest rates
● Declining stock markets
8. Bank Ranking
Rank Institution Name Total Asset($T)
1 JPMorgan Chase 2.58T
2 Bank of America 2.14T
3 Citigroup 1.83T
4 Well Fargo 1.74T
5 Goldman Sachs 865B
9. Financial Conditions
Sources: Morningstar
Financial Ratios
Goldman
Sachs
J.P.
Morgan Wells Fargo
Bank of
America Peer group
Industry
Average Condition
Profitability (%)
ROA 0.9 0.8 1.3 0.5 8.7 0.8 Good
ROE 10.5 9.8 13.1 4.5 9.1 8.9 Good
Leverage/Liquidity
Profit Margin 34.1 32.0 25.4 20.4 26.0 7.1 Good
Debt to Equity 2.5x 1.5x 1.1x 1.1x 1.2x 2.0x Good
Interest Coverage 2.5x 4.2x 7.7x 2.6x 4.8x 3.2x Below
Overall Good
10. Financial Conditions
Sources: Morningstar
Financial Ratio
Goldman
Sachs J.P. Morgan Wells Fargo
Bank of
America Peer group
Industry
Average Condition
Equity
Forward P/E 9.7x 9.9x 12.1x 10.3x 10.7x 10x Average
Dividend Yield% 1.2 2.6 2.6 1.2 2.1 1.2 Average
Growth Rate
Revenue Growth% 6.2 -1.1 1.4 -3.4 -1 0.3 Good
Net Income
Growth%
24.0 4.7 13.3 49.5 22.5 33.6 Below
Overall Average
11. Technical Analysis
Goldman Sachs
● Upward trend
line
(Momentum)
● Big change in
volume coming
● Trending
towards $240
Target Price $ 240 > $190 Current Price
Support
Resistance
Trend Line
12. Valuation: Perpetuity Model
Year 2014 Estimated 2015 Estimated 2016
EPS $17.07 $18.84 $20.54
G 10% 10% 9%
Discount Rate Stock Value Range
ERM: 8% $257 High
WACC: 9% $228 Medium
CAPM: 10% $205 Low
CAPM
Risk-Free Rate 3%
Beta 1.4
ERM 8%
R 10%
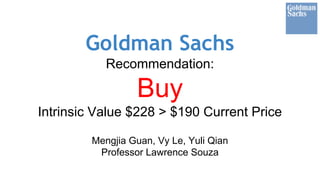
Intrinsic Value $205 > $190 Current Price Premium 8%
13. Valuation: Gordon Growth Model
i g 1% 2% 3%
i ERM: 8% $ 293 $ 342 $ 411
i WACC: 9% $ 257 $ 342 $ 342
i CAPM: 10% $ 228 $ 257 $ 293
Intrinsic Value $257 > $190 Current Price Premium 35%
CAPM
Risk-Free Rate 3%
Beta 1.4
ERM 8%
R 10%
Year 2014 Estimated 2015 Estimated 2016
EPS $17.07 $18.84 $20.54
G 10% 10% 9%
14. Valuation: Multiple Model
P/E Multiple U.S. Bank BOA JPMorgan Wells Fargo Citigroup
Estimated
2015
13.8x 12.2x 11.4x 13.3x 9.7x
P/E Ratio Stock Value Range
13x $ 267 High
12x $ 246 Medium
11x $ 226 Low
Intrinsic Value $226 > $190 Current Price Premium 19%
15. Valuation: DCF Model
Year 2016 2017 2018 2019 2020 2021-TV
EPS 20.54 21.77 23.07 24.23 25.20 25.70
Growth Rate 9% 6% 6% 5% 4% 2%
PV $19 18 18 17 156 240
Corporate Value $228
Weighted Debt 70%
Weighted Equity 30%
R Debt 10%
R Equity 7.5%
WACC 9%
WACC Stock Value Range
8% $237 High
9% $228 Medium
10% $221 Low
Intrinsic Value $228 > $190 Current Price Premium 20%