More Related Content
Similar to Tablas, estadistica
Similar to Tablas, estadistica (20)
Tablas, estadistica
- 1. Probabilidad
z
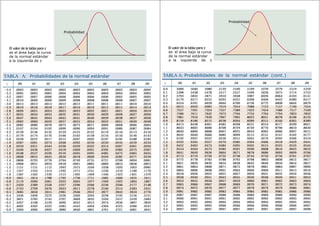
TABLA A: Probabilidades de la normal estándar
.00 .01 .02 .03 .04 .05 .06 .07 .08 .09
3.4 .0003 .0003 .0003 .0003 .0003 .0003 .0003 .0003 .0003 .0002
3.3 .0005 .0005 .0005 .0004 .0004 .0004 .0004 .0004 .0004 .0003
3.2 .0007 .0007 .0006 .0006 .0006 .0006 .0006 .0005 .0005 .0005
3.1 .0010 .0009 .0009 .0009 .0008 .0008 .0008 .0008 .0007 .0007
3.0 .0013 .0013 .0013 .0012 .0012 .0011 .0011 .0011 .0010 .0010
2.9 .0019 .0018 .0018 .0017 .0016 .0016 .0015 .0015 .0014 .0014
2.8 .0026 .0025 .0024 .0023 .0023 .0022 .0021 .0021 .0020 .0019
2.7 .0035 .0034 .0033 .0032 .0031 .0030 .0029 .0028 .0027 .0026
2.6 .0047 .0045 .0044 .0043 .0041 .0040 .0039 .0038 .0037 .0036
2.5 .0062 .0060 .0059 .0057 .0055 .0054 .0052 .0051 .0049 .0048
2.4 .0082 .0080 .0078 .0075 .0073 .0071 .0069 .0068 .0066 .0064
2.3 .0107 .0104 .0102 .0099 .0096 .0094 .0091 .0089 .0087 .0084
2.2 .0139 .0136 .0132 .0129 .0125 .0122 .0119 .0116 .0113 .0110
2.1 .0179 .0174 .0170 .0166 .0162 .0158 .0154 .0150 .0146 .0143
2.0 .0228 .0222 .0217 .0212 .0207 .0202 .0197 .0192 .0188 .0183
1.9 .0287 .0281 .0274 .0268 .0262 .0256 .0250 .0244 .0239 .0233
1.8 .0359 .0351 .0344 .0336 .0329 .0322 .0314 .0307 .0301 .0294
1.7 .0446 .0436 .0427 .0418 .0409 .0401 .0392 .0384 .0375 .0367
1.6 .0548 .0537 .0526 .0516 .0505 .0495 .0485 .0475 .0465 .0455
1.5 .0668 .0655 .0643 .0630 .0618 .0606 .0594 .0582 .0571 .0559
1.4 .0808 .0793 .0778 .0764 .0749 .0735 .0721 .0708 .0694 .0681
1.3 .0968 .0951 .0934 .0918 .0901 .0885 .0869 .0853 .0838 .0823
1.2 .1151 .1131 .1112 .1093 .1075 .1056 .1038 .1020 .1003 .0985
1.1 .1357 .1335 .1314 .1292 .1271 .1251 .1230 .1210 .1190 .1170
1.0 .1587 .1562 .1539 .1515 .1492 .1469 .1446 .1423 .1401 .1379
0.9 .1841 .1814 .1788 .1762 .1736 .1711 .1685 .1660 .1635 .1611
0.8 .2119 .2090 .2061 .2033 .2005 .1977 .1949 .1922 .1894 .1867
0.7 .2420 .2389 .2358 .2327 .2296 .2266 .2236 .2206 .2177 .2148
0.6 .2743 .2709 .2676 .2643 .2611 .2578 .2546 .2514 .2483 .2451
0.5 .3085 .3050 .3015 .2981 .2946 .2912 .2877 .2843 .2810 .2776
0.4 .3446 .3409 .3372 .3336 .3300 .3264 .3228 .3192 .3156 .3121
0.3 .3821 .3783 .3745 .3707 .3669 .3632 .3594 .3557 .3520 .3483
0.2 .4207 .4168 .4129 .4090 .4052 .4013 .3974 .3936 .3897 .3859
0.1 .4602 .4562 .4522 .4483 .4443 .4404 .4364 .4325 .4286 .4247
0.0 .5000 .4960 .4920 .4880 .4840 .4801 .4761 .4721 .4681 .4641
z
El valor de la tabla para z
es el área bajo la curva
de la normal estándar
a la izquierda de z
Ϫ
Ϫ
Ϫ
Ϫ
Ϫ
Ϫ
Ϫ
Ϫ
Ϫ
Ϫ
Ϫ
Ϫ
Ϫ
Ϫ
Ϫ
Ϫ
Ϫ
Ϫ
Ϫ
Ϫ
Ϫ
Ϫ
Ϫ
Ϫ
Ϫ
Ϫ
Ϫ
Ϫ
Ϫ
Ϫ
Ϫ
Ϫ
Ϫ
Ϫ
Ϫ
Probabilidad
z
TABLA A: Probabilidades de la normal estándar (cont.)
.00 .01 .02 .03 .04 .05 .06 .07 .08 .09
0.0 .5000 .5040 .5080 .5120 .5160 .5199 .5239 .5279 .5319 .5359
0.1 .5398 .5438 .5478 .5517 .5557 .5596 .5636 .5675 .5714 .5753
0.2 .5793 .5832 .5871 .5910 .5948 .5987 .6026 .6064 .6103 .6141
0.3 .6179 .6217 .6255 .6293 .6331 .6368 .6406 .6443 .6480 .6517
0.4 .6554 .6591 .6628 .6664 .6700 .6736 .6772 .6808 .6844 .6879
0.5 .6915 .6950 .6985 .7019 .7054 .7088 .7123 .7157 .7190 .7224
0.6 .7257 .7291 .7324 .7357 .7389 .7422 .7454 .7486 .7517 .7549
0.7 .7580 .7611 .7642 .7673 .7704 .7734 .7764 .7794 .7823 .7852
0.8 .7881 .7910 .7939 .7967 .7995 .8023 .8051 .8078 .8106 .8133
0.9 .8159 .8186 .8212 .8238 .8264 .8289 .8315 .8340 .8365 .8389
1.0 .8413 .8438 .8461 .8485 .8508 .8531 .8554 .8577 .8599 .8621
1.1 .8643 .8665 .8686 .8708 .8729 .8749 .8770 .8790 .8810 .8830
1.2 .8849 .8869 .8888 .8907 .8925 .8944 .8962 .8980 .8997 .9015
1.3 .9032 .9049 .9066 .9082 .9099 .9115 .9131 .9147 .9162 .9177
1.4 .9192 .9207 .9222 .9236 .9251 .9265 .9279 .9292 .9306 .9319
1.5 .9332 .9345 .9357 .9370 .9382 .9394 .9406 .9418 .9429 .9441
1.6 .9452 .9463 .9474 .9484 .9495 .9505 .9515 .9525 .9535 .9545
1.7 .9554 .9564 .9573 .9582 .9591 .9599 .9608 .9616 .9625 .9633
1.8 .9641 .9649 .9656 .9664 .9671 .9678 .9686 .9693 .9699 .9706
1.9 .9713 .9719 .9726 .9732 .9738 .9744 .9750 .9756 .9761 .9767
2.0 .9772 .9778 .9783 .9788 .9793 .9798 .9803 .9808 .9812 .9817
2.1 .9821 .9826 .9830 .9834 .9838 .9842 .9846 .9850 .9854 .9857
2.2 .9861 .9864 .9868 .9871 .9875 .9878 .9881 .9884 .9887 .9890
2.3 .9893 .9896 .9898 .9901 .9904 .9906 .9909 .9911 .9913 .9916
2.4 .9918 .9920 .9922 .9925 .9927 .9929 .9931 .9932 .9934 .9936
2.5 .9938 .9940 .9941 .9943 .9945 .9946 .9948 .9949 .9951 .9952
2.6 .9953 .9955 .9956 .9957 .9959 .9960 .9961 .9962 .9963 .9964
2.7 .9965 .9966 .9967 .9968 .9969 .9970 .9971 .9972 .9973 .9974
2.8 .9974 .9975 .9976 .9977 .9977 .9978 .9979 .9979 .9980 .9981
2.9 .9981 .9982 .9982 .9983 .9984 .9984 .9985 .9985 .9986 .9986
3.0 .9987 .9987 .9987 .9988 .9988 .9989 .9989 .9989 .9990 .9990
3.1 .9990 .9991 .9991 .9991 .9992 .9992 .9992 .9992 .9993 .9993
3.2 .9993 .9993 .9994 .9994 .9994 .9994 .9994 .9995 .9995 .9995
3.3 .9995 .9995 .9995 .9996 .9996 .9996 .9996 .9996 .9996 .9997
3.4 .9997 .9997 .9997 .9997 .9997 .9997 .9997 .9997 .9997 .9998
z
El valor de la tabla para z
es el área bajo la curva
de la normal estándar
a la izquierda de z
- 2. Probabilidad p
t*
TABLA B Valores críticos de la distribución t de Student
Probabilidad de la cola
gl .25 .20 .15 .10 .05 .025 .02 .01 .005 .0025 .001 .0005
1 1.000 1.376 1.963 3.078 6.314 12.71 15.89 31.82 63.66 127.3 318.3 636.6
2 0.816 1.061 1.386 1.886 2.920 4.303 4.849 6.965 9.925 14.09 22.33 31.60
3 0.765 0.978 1.250 1.638 2.353 3.182 3.482 4.541 5.841 7.453 10.21 12.92
4 0.741 0.941 1.190 1.533 2.132 2.776 2.999 3.747 4.604 5.598 7.173 8.610
5 0.727 0.920 1.156 1.476 2.015 2.571 2.757 3.365 4.032 4.773 5.893 6.869
6 0.718 0.906 1.134 1.440 1.943 2.447 2.612 3.143 3.707 4.317 5.208 5.959
7 0.711 0.896 1.119 1.415 1.895 2.365 2.517 2.998 3.499 4.029 4.785 5.408
8 0.706 0.889 1.108 1.397 1.860 2.306 2.449 2.896 3.355 3.833 4.501 5.041
9 0.703 0.883 1.100 1.383 1.833 2.262 2.398 2.821 3.250 3.690 4.297 4.781
10 0.700 0.879 1.093 1.372 1.812 2.228 2.359 2.764 3.169 3.581 4.144 4.587
11 0.697 0.876 1.088 1.363 1.796 2.201 2.328 2.718 3.106 3.497 4.025 4.437
12 0.695 0.873 1.083 1.356 1.782 2.179 2.303 2.681 3.055 3.428 3.930 4.318
13 0.694 0.870 1.079 1.350 1.771 2.160 2.282 2.650 3.012 3.372 3.852 4.221
14 0.692 0.868 1.076 1.345 1.761 2.145 2.264 2.624 2.977 3.326 3.787 4.140
15 0.691 0.866 1.074 1.341 1.753 2.131 2.249 2.602 2.947 3.286 3.733 4.073
16 0.690 0.865 1.071 1.337 1.746 2.120 2.235 2.583 2.921 3.252 3.686 4.015
17 0.689 0.863 1.069 1.333 1.740 2.110 2.224 2.567 2.898 3.222 3.646 3.965
18 0.688 0.862 1.067 1.330 1.734 2.101 2.214 2.552 2.878 3.197 3.611 3.922
19 0.688 0.861 1.066 1.328 1.729 2.093 2.205 2.539 2.861 3.174 3.579 3.883
20 0.687 0.860 1.064 1.325 1.725 2.086 2.197 2.528 2.845 3.153 3.552 3.850
21 0.686 0.859 1.063 1.323 1.721 2.080 2.189 2.518 2.831 3.135 3.527 3.819
22 0.686 0.858 1.061 1.321 1.717 2.074 2.183 2.508 2.819 3.119 3.505 3.792
23 0.685 0.858 1.060 1.319 1.714 2.069 2.177 2.500 2.807 3.104 3.485 3.768
24 0.685 0.857 1.059 1.318 1.711 2.064 2.172 2.492 2.797 3.091 3.467 3.745
25 0.684 0.856 1.058 1.316 1.708 2.060 2.167 2.485 2.787 3.078 3.450 3.725
26 0.684 0.856 1.058 1.315 1.706 2.056 2.162 2.479 2.779 3.067 3.435 3.707
27 0.684 0.855 1.057 1.314 1.703 2.052 2.158 2.473 2.771 3.057 3.421 3.690
28 0.683 0.855 1.056 1.313 1.701 2.048 2.154 2.467 2.763 3.047 3.408 3.674
29 0.683 0.854 1.055 1.311 1.699 2.045 2.150 2.462 2.756 3.038 3.396 3.659
30 0.683 0.854 1.055 1.310 1.697 2.042 2.147 2.457 2.750 3.030 3.385 3.646
40 0.681 0.851 1.050 1.303 1.684 2.021 2.123 2.423 2.704 2.971 3.307 3.551
50 0.679 0.849 1.047 1.299 1.676 2.009 2.109 2.403 2.678 2.937 3.261 3.496
60 0.679 0.848 1.045 1.296 1.671 2.000 2.099 2.390 2.660 2.915 3.232 3.460
80 0.678 0.846 1.043 1.292 1.664 1.990 2.088 2.374 2.639 2.887 3.195 3.416
100 0.677 0.845 1.042 1.290 1.660 1.984 2.081 2.364 2.626 2.871 3.174 3.390
1000 0.675 0.842 1.037 1.282 1.646 1.962 2.056 2.330 2.581 2.813 3.098 3.300
0.674 0.841 1.036 1.282 1.645 1.960 2.054 2.326 2.576 2.807 3.091 3.291
50% 60% 70% 80% 90% 95% 96% 98% 99% 99.5% 99.8% 99.9%
Nivel de confianza
p
z
C
ء
El valor de la tabla para p y C
es el valor crítico t* que deja
una probabilidad p a la derecha
y una probabilidad C
entre -t* y t*
Probabilidad p
2*X
2
2
TABLA C: Valores críticos de la distribución de Pearson
Probabilidad de la cola p
gl .25 .20 .15 .10 .05 .025 .02 .01 .005 .0025 .001 .0005
1 1.32 1.64 2.07 2.71 3.84 5.02 5.41 6.63 7.88 9.14 10.83 12.12
2 2.77 3.22 3.79 4.61 5.99 7.38 7.82 9.21 10.60 11.98 13.82 15.20
3 4.11 4.64 5.32 6.25 7.81 9.35 9.84 11.34 12.84 14.32 16.27 17.73
4 5.39 5.99 6.74 7.78 9.49 11.14 11.67 13.28 14.86 16.42 18.47 20.00
5 6.63 7.29 8.12 9.24 11.07 12.83 13.39 15.09 16.75 18.39 20.51 22.11
6 7.84 8.56 9.45 10.64 12.59 14.45 15.03 16.81 18.55 20.25 22.46 24.10
7 9.04 9.80 10.75 12.02 14.07 16.01 16.62 18.48 20.28 22.04 24.32 26.02
8 10.22 11.03 12.03 13.36 15.51 17.53 18.17 20.09 21.95 23.77 26.12 27.87
9 11.39 12.24 13.29 14.68 16.92 19.02 19.68 21.67 23.59 25.46 27.88 29.67
10 12.55 13.44 14.53 15.99 18.31 20.48 21.16 23.21 25.19 27.11 29.59 31.42
11 13.70 14.63 15.77 17.28 19.68 21.92 22.62 24.72 26.76 28.73 31.26 33.14
12 14.85 15.81 16.99 18.55 21.03 23.34 24.05 26.22 28.30 30.32 32.91 34.82
13 15.98 16.98 18.20 19.81 22.36 24.74 25.47 27.69 29.82 31.88 34.53 36.48
14 17.12 18.15 19.41 21.06 23.68 26.12 26.87 29.14 31.32 33.43 36.12 38.11
15 18.25 19.31 20.60 22.31 25.00 27.49 28.26 30.58 32.80 34.95 37.70 39.72
16 19.37 20.47 21.79 23.54 26.30 28.85 29.63 32.00 34.27 36.46 39.25 41.31
17 20.49 21.61 22.98 24.77 27.59 30.19 31.00 33.41 35.72 37.95 40.79 42.88
18 21.60 22.76 24.16 25.99 28.87 31.53 32.35 34.81 37.16 39.42 42.31 44.43
19 22.72 23.90 25.33 27.20 30.14 32.85 33.69 36.19 38.58 40.88 43.82 45.97
20 23.83 25.04 26.50 28.41 31.41 34.17 35.02 37.57 40.00 42.34 45.31 47.50
21 24.93 26.17 27.66 29.62 32.67 35.48 36.34 38.93 41.40 43.78 46.80 49.01
22 26.04 27.30 28.82 30.81 33.92 36.78 37.66 40.29 42.80 45.20 48.27 50.51
23 27.14 28.43 29.98 32.01 35.17 38.08 38.97 41.64 44.18 46.62 49.73 52.00
24 28.24 29.55 31.13 33.20 36.42 39.36 40.27 42.98 45.56 48.03 51.18 53.48
25 29.34 30.68 32.28 34.38 37.65 40.65 41.57 44.31 46.93 49.44 52.62 54.95
26 30.43 31.79 33.43 35.56 38.89 41.92 42.86 45.64 48.29 50.83 54.05 56.41
27 31.53 32.91 34.57 36.74 40.11 43.19 44.14 46.96 49.64 52.22 55.48 57.86
28 32.62 34.03 35.71 37.92 41.34 44.46 45.42 48.28 50.99 53.59 56.89 59.30
29 33.71 35.14 36.85 39.09 42.56 45.72 46.69 49.59 52.34 54.97 58.30 60.73
30 34.80 36.25 37.99 40.26 43.77 46.98 47.96 50.89 53.67 56.33 59.70 62.16
40 45.62 47.27 49.24 51.81 55.76 59.34 60.44 63.69 66.77 69.70 73.40 76.09
50 56.33 58.16 60.35 63.17 67.50 71.42 72.61 76.15 79.49 82.66 86.66 89.56
60 66.98 68.97 71.34 74.40 79.08 83.30 84.58 88.38 91.95 95.34 99.61 102.7
80 88.13 90.41 93.11 96.58 101.9 106.6 108.1 112.3 116.3 120.1 124.8 128.3
100 109.1 111.7 114.7 118.5 124.3 129.6 131.1 135.8 140.2 144.3 149.4 153.2
X ءEl valor de la tabla para p es el valor crítico que deja la probabilidad p a la derecha
- 3. F*
Probabilidad p
TABLA D
Grados de libertad en el numerador
1 2 3 4 5 6 7 8 9
.100 39.86 49.50 53.59 55.83 57.24 58.20 58.91 59.44 59.86
.050 161.45 199.50 215.71 224.58 230.16 233.99 236.77 238.88 240.54
1 .025 647.79 799.50 864.16 899.58 921.85 937.11 948.22 956.66 963.28
.010 4052.2 4999.5 5403.4 5624.6 5763.6 5859.0 5928.4 5981.1 6022.5
.001 405284 500000 540379 562500 576405 585937 592873 598144 602284
.100 8.53 9.00 9.16 9.24 9.29 9.33 9.35 9.37 9.38
.050 18.51 19.00 19.16 19.25 19.30 19.33 19.35 19.37 19.38
2 .025 38.51 39.00 39.17 39.25 39.30 39.33 39.36 39.37 39.39
.010 98.50 99.00 99.17 99.25 99.30 99.33 99.36 99.37 99.39
.001 998.50 999.00 999.17 999.25 999.30 999.33 999.36 999.37 999.39
.100 5.54 5.46 5.39 5.34 5.31 5.28 5.27 5.25 5.24
.050 10.13 9.55 9.28 9.12 9.01 8.94 8.89 8.85 8.81
3 .025 17.44 16.04 15.44 15.10 14.88 14.73 14.62 14.54 14.47
.010 34.12 30.82 29.46 28.71 28.24 27.91 27.67 27.49 27.35
.001 167.03 148.50 141.11 137.10 134.58 132.85 131.58 130.62 129.86
.100 4.54 4.32 4.19 4.11 4.05 4.01 3.98 3.95 3.94
.050 7.71 6.94 6.59 6.39 6.26 6.16 6.09 6.04 6.00
4 .025 12.22 10.65 9.98 9.60 9.36 9.20 9.07 8.98 8.90
.010 21.20 18.00 16.69 15.98 15.52 15.21 14.98 14.80 14.66
.001 74.14 61.25 56.18 53.44 51.71 50.53 49.66 49.00 48.47
.100 4.06 3.78 3.62 3.52 3.45 3.40 3.37 3.34 3.32
.050 6.61 5.79 5.41 5.19 5.05 4.95 4.88 4.82 4.77
5 .025 10.01 8.43 7.76 7.39 7.15 6.98 6.85 6.76 6.68
.010 16.26 13.27 12.06 11.39 10.97 10.67 10.46 10.29 10.16
.001 47.18 37.12 33.20 31.09 29.75 28.83 28.16 27.65 27.24
.100 3.78 3.46 3.29 3.18 3.11 3.05 3.01 2.98 2.96
.050 5.99 5.14 4.76 4.53 4.39 4.28 4.21 4.15 4.10
6 .025 8.81 7.26 6.60 6.23 5.99 5.82 5.70 5.60 5.52
.010 13.75 10.92 9.78 9.15 8.75 8.47 8.26 8.10 7.98
.001 35.51 27.00 23.70 21.92 20.80 20.03 19.46 19.03 18.69
.100 3.59 3.26 3.07 2.96 2.88 2.83 2.78 2.75 2.72
.050 5.59 4.74 4.35 4.12 3.97 3.87 3.79 3.73 3.68
7 .025 8.07 6.54 5.89 5.52 5.29 5.12 4.99 4.90 4.82
.010 12.25 9.55 8.45 7.85 7.46 7.19 6.99 6.84 6.72
.001 29.25 21.69 18.77 17.20 16.21 15.52 15.02 14.63 14.33
p
Valores críticos de la distribución F de Fisher
El valor de la tabla para p es el valor crítico F* que deja la probabilidad p a la derecha
Gradosdelibertadeneldenominador
F*
Probabilidad p
TABLAD Valores críticos de la distribución F de Fisher (cont.)
Grados de libertad del numerador
10 12 15 20 25 30 40 50 60 120 1000
60.19 60.71 61.22 61.74 62.05 62.26 62.53 62.69 62.79 63.06 63.30
241.88 243.91 245.95 248.01 249.26 250.10 251.14 251.77 252.20 253.25 254.19
968.63 976.71 984.87 993.10 998.08 1001.4 1005.6 1008.1 1009.8 1014.0 1017.7
6055.8 6106.3 6157.3 6208.7 6239.8 6260.6 6286.8 6302.5 6313.0 6339.4 6362.7
605621 610668 615764 620908 624017 626099 628712 630285 631337 633972 636301
9.39 9.41 9.42 9.44 9.45 9.46 9.47 9.47 9.47 9.48 9.49
19.40 19.41 19.43 19.45 19.46 19.46 19.47 19.48 19.48 19.49 19.49
39.40 39.41 39.43 39.45 39.46 39.46 39.47 39.48 39.48 39.49 39.50
99.40 99.42 99.43 99.45 99.46 99.47 99.47 99.48 99.48 99.49 99.50
999.40 999.42 999.43 999.45 999.46 999.47 999.47 999.48 999.48 999.49 999.50
5.23 5.22 5.20 5.18 5.17 5.17 5.16 5.15 5.15 5.14 5.13
8.79 8.74 8.70 8.66 8.63 8.62 8.59 8.58 8.57 8.55 8.53
14.42 14.34 14.25 14.17 14.12 14.08 14.04 14.01 13.99 13.95 13.91
27.23 27.05 26.87 26.69 26.58 26.50 26.41 26.35 26.32 26.22 26.14
129.25 128.32 127.37 126.42 125.84 125.45 124.96 124.66 124.47 123.97 123.53
3.92 3.90 3.87 3.84 3.83 3.82 3.80 3.80 3.79 3.78 3.76
5.96 5.91 5.86 5.80 5.77 5.75 5.72 5.70 5.69 5.66 5.63
8.84 8.75 8.66 8.56 8.50 8.46 8.41 8.38 8.36 8.31 8.26
14.55 14.37 14.20 14.02 13.91 13.84 13.75 13.69 13.65 13.56 13.47
48.05 47.41 46.76 46.10 45.70 45.43 45.09 44.88 44.75 44.40 44.09
3.30 3.27 3.24 3.21 3.19 3.17 3.16 3.15 3.14 3.12 3.11
4.74 4.68 4.62 4.56 4.52 4.50 4.46 4.44 4.43 4.40 4.37
6.62 6.52 6.43 6.33 6.27 6.23 6.18 6.14 6.12 6.07 6.02
10.05 9.89 9.72 9.55 9.45 9.38 9.29 9.24 9.20 9.11 9.03
26.92 26.42 25.91 25.39 25.08 24.87 24.60 24.44 24.33 24.06 23.82
2.94 2.90 2.87 2.84 2.81 2.80 2.78 2.77 2.76 2.74 2.72
4.06 4.00 3.94 3.87 3.83 3.81 3.77 3.75 3.74 3.70 3.67
5.46 5.37 5.27 5.17 5.11 5.07 5.01 4.98 4.96 4.90 4.86
7.87 7.72 7.56 7.40 7.30 7.23 7.14 7.09 7.06 6.97 6.89
18.41 17.99 17.56 17.12 16.85 16.67 16.44 16.31 16.21 15.98 15.77
2.70 2.67 2.63 2.59 2.57 2.56 2.54 2.52 2.51 2.49 2.47
3.64 3.57 3.51 3.44 3.40 3.38 3.34 3.32 3.30 3.27 3.23
4.76 4.67 4.57 4.47 4.40 4.36 4.31 4.28 4.25 4.20 4.15
6.62 6.47 6.31 6.16 6.06 5.99 5.91 5.86 5.82 5.74 5.66
14.08 13.71 13.32 12.93 12.69 12.53 12.33 12.20 12.12 11.91 11.72
El valor de la tabla para p es el valor crítico F* que deja la probabilidad p a la derecha
- 4. TABLA D Valores críticos de la distribución F de Fisher (cont.)
Grados de libertad en el numerador
1 2 3 4 5 6 7 8 9
.100 3.46 3.11 2.92 2.81 2.73 2.67 2.62 2.59 2.56
.050 5.32 4.46 4.07 3.84 3.69 3.58 3.50 3.44 3.39
8 .025 7.57 6.06 5.42 5.05 4.82 4.65 4.53 4.43 4.36
.010 11.26 8.65 7.59 7.01 6.63 6.37 6.18 6.03 5.91
.001 25.41 18.49 15.83 14.39 13.48 12.86 12.40 12.05 11.77
.100 3.36 3.01 2.81 2.69 2.61 2.55 2.51 2.47 2.44
.050 5.12 4.26 3.86 3.63 3.48 3.37 3.29 3.23 3.18
9 .025 7.21 5.71 5.08 4.72 4.48 4.32 4.20 4.10 4.03
.010 10.56 8.02 6.99 6.42 6.06 5.80 5.61 5.47 5.35
.001 22.86 16.39 13.90 12.56 11.71 11.13 10.70 10.37 10.11
.100 3.29 2.92 2.73 2.61 2.52 2.46 2.41 2.38 2.35
.050 4.96 4.10 3.71 3.48 3.33 3.22 3.14 3.07 3.02
10 .025 6.94 5.46 4.83 4.47 4.24 4.07 3.95 3.85 3.78
.010 10.04 7.56 6.55 5.99 5.64 5.39 5.20 5.06 4.94
.001 21.04 14.91 12.55 11.28 10.48 9.93 9.52 9.20 8.96
.100 3.23 2.86 2.66 2.54 2.45 2.39 2.34 2.30 2.27
.050 4.84 3.98 3.59 3.36 3.20 3.09 3.01 2.95 2.90
11 .025 6.72 5.26 4.63 4.28 4.04 3.88 3.76 3.66 3.59
.010 9.65 7.21 6.22 5.67 5.32 5.07 4.89 4.74 4.63
.001 19.69 13.81 11.56 10.35 9.58 9.05 8.66 8.35 8.12
.100 3.18 2.81 2.61 2.48 2.39 2.33 2.28 2.24 2.21
.050 4.75 3.89 3.49 3.26 3.11 3.00 2.91 2.85 2.80
12 .025 6.55 5.10 4.47 4.12 3.89 3.73 3.61 3.51 3.44
.010 9.33 6.93 5.95 5.41 5.06 4.82 4.64 4.50 4.39
.001 18.64 12.97 10.80 9.63 8.89 8.38 8.00 7.71 7.48
.100 3.14 2.76 2.56 2.43 2.35 2.28 2.23 2.20 2.16
.050 4.67 3.81 3.41 3.18 3.03 2.92 2.83 2.77 2.71
13 .025 6.41 4.97 4.35 4.00 3.77 3.60 3.48 3.39 3.31
.010 9.07 6.70 5.74 5.21 4.86 4.62 4.44 4.30 4.19
.001 17.82 12.31 10.21 9.07 8.35 7.86 7.49 7.21 6.98
.100 3.10 2.73 2.52 2.39 2.31 2.24 2.19 2.15 2.12
.050 4.60 3.74 3.34 3.11 2.96 2.85 2.76 2.70 2.65
14 .025 6.30 4.86 4.24 3.89 3.66 3.50 3.38 3.29 3.21
.010 8.86 6.51 5.56 5.04 4.69 4.46 4.28 4.14 4.03
.001 17.14 11.78 9.73 8.62 7.92 7.44 7.08 6.80 6.58
.100 3.07 2.70 2.49 2.36 2.27 2.21 2.16 2.12 2.09
.050 4.54 3.68 3.29 3.06 2.90 2.79 2.71 2.64 2.59
15 .025 6.20 4.77 4.15 3.80 3.58 3.41 3.29 3.20 3.12
.010 8.68 6.36 5.42 4.89 4.56 4.32 4.14 4.00 3.89
.001 16.59 11.34 9.34 8.25 7.57 7.09 6.74 6.47 6.26
.100 3.05 2.67 2.46 2.33 2.24 2.18 2.13 2.09 2.06
.050 4.49 3.63 3.24 3.01 2.85 2.74 2.66 2.59 2.54
16 .025 6.12 4.69 4.08 3.73 3.50 3.34 3.22 3.12 3.05
.010 8.53 6.23 5.29 4.77 4.44 4.20 4.03 3.89 3.78
.001 16.12 10.97 9.01 7.94 7.27 6.80 6.46 6.19 5.98
.100 3.03 2.64 2.44 2.31 2.22 2.15 2.10 2.06 2.03
.050 4.45 3.59 3.20 2.96 2.81 2.70 2.61 2.55 2.49
17 .025 6.04 4.62 4.01 3.66 3.44 3.28 3.16 3.06 2.98
.010 8.40 6.11 5.19 4.67 4.34 4.10 3.93 3.79 3.68
.001 15.72 10.66 8.73 7.68 7.02 6.56 6.22 5.96 5.75
p
Gradosdelibertadeneldenominador
TABLA D Valores críticos de la distribución F de Fisher (cont.)
Grados de libertad en el numerador
10 12 15 20 25 30 40 50 60 120 1000
2.54 2.50 2.46 2.42 2.40 2.38 2.36 2.35 2.34 2.32 2.30
3.35 3.28 3.22 3.15 3.11 3.08 3.04 3.02 3.01 2.97 2.93
4.30 4.20 4.10 4.00 3.94 3.89 3.84 3.81 3.78 3.73 3.68
5.81 5.67 5.52 5.36 5.26 5.20 5.12 5.07 5.03 4.95 4.87
11.54 11.19 10.84 10.48 10.26 10.11 9.92 9.80 9.73 9.53 9.36
2.42 2.38 2.34 2.30 2.27 2.25 2.23 2.22 2.21 2.18 2.16
3.14 3.07 3.01 2.94 2.89 2.86 2.83 2.80 2.79 2.75 2.71
3.96 3.87 3.77 3.67 3.60 3.56 3.51 3.47 3.45 3.39 3.34
5.26 5.11 4.96 4.81 4.71 4.65 4.57 4.52 4.48 4.40 4.32
9.89 9.57 9.24 8.90 8.69 8.55 8.37 8.26 8.19 8.00 7.84
2.32 2.28 2.24 2.20 2.17 2.16 2.13 2.12 2.11 2.08 2.06
2.98 2.91 2.85 2.77 2.73 2.70 2.66 2.64 2.62 2.58 2.54
3.72 3.62 3.52 3.42 3.35 3.31 3.26 3.22 3.20 3.14 3.09
4.85 4.71 4.56 4.41 4.31 4.25 4.17 4.12 4.08 4.00 3.92
8.75 8.45 8.13 7.80 7.60 7.47 7.30 7.19 7.12 6.94 6.78
2.25 2.21 2.17 2.12 2.10 2.08 2.05 2.04 2.03 2.00 1.98
2.85 2.79 2.72 2.65 2.60 2.57 2.53 2.51 2.49 2.45 2.41
3.53 3.43 3.33 3.23 3.16 3.12 3.06 3.03 3.00 2.94 2.89
4.54 4.40 4.25 4.10 4.01 3.94 3.86 3.81 3.78 3.69 3.61
7.92 7.63 7.32 7.01 6.81 6.68 6.52 6.42 6.35 6.18 6.02
2.19 2.15 2.10 2.06 2.03 2.01 1.99 1.97 1.96 1.93 1.91
2.75 2.69 2.62 2.54 2.50 2.47 2.43 2.40 2.38 2.34 2.30
3.37 3.28 3.18 3.07 3.01 2.96 2.91 2.87 2.85 2.79 2.73
4.30 4.16 4.01 3.86 3.76 3.70 3.62 3.57 3.54 3.45 3.37
7.29 7.00 6.71 6.40 6.22 6.09 5.93 5.83 5.76 5.59 5.44
2.14 2.10 2.05 2.01 1.98 1.96 1.93 1.92 1.90 1.88 1.85
2.67 2.60 2.53 2.46 2.41 2.38 2.34 2.31 2.30 2.25 2.21
3.25 3.15 3.05 2.95 2.88 2.84 2.78 2.74 2.72 2.66 2.60
4.10 3.96 3.82 3.66 3.57 3.51 3.43 3.38 3.34 3.25 3.18
6.80 6.52 6.23 5.93 5.75 5.63 5.47 5.37 5.30 5.14 4.99
2.10 2.05 2.01 1.96 1.93 1.91 1.89 1.87 1.86 1.83 1.80
2.60 2.53 2.46 2.39 2.34 2.31 2.27 2.24 2.22 2.18 2.14
3.15 3.05 2.95 2.84 2.78 2.73 2.67 2.64 2.61 2.55 2.50
3.94 3.80 3.66 3.51 3.41 3.35 3.27 3.22 3.18 3.09 3.02
6.40 6.13 5.85 5.56 5.38 5.25 5.10 5.00 4.94 4.77 4.62
2.06 2.02 1.97 1.92 1.89 1.87 1.85 1.83 1.82 1.79 1.76
2.54 2.48 2.40 2.33 2.28 2.25 2.20 2.18 2.16 2.11 2.07
3.06 2.96 2.86 2.76 2.69 2.64 2.59 2.55 2.52 2.46 2.40
3.80 3.67 3.52 3.37 3.28 3.21 3.13 3.08 3.05 2.96 2.88
6.08 5.81 5.54 5.25 5.07 4.95 4.80 4.70 4.64 4.47 4.33
2.03 1.99 1.94 1.89 1.86 1.84 1.81 1.79 1.78 1.75 1.72
2.49 2.42 2.35 2.28 2.23 2.19 2.15 2.12 2.11 2.06 2.02
2.99 2.89 2.79 2.68 2.61 2.57 2.51 2.47 2.45 2.38 2.32
3.69 3.55 3.41 3.26 3.16 3.10 3.02 2.97 2.93 2.84 2.76
5.81 5.55 5.27 4.99 4.82 4.70 4.54 4.45 4.39 4.23 4.08
2.00 1.96 1.91 1.86 1.83 1.81 1.78 1.76 1.75 1.72 1.69
2.45 2.38 2.31 2.23 2.18 2.15 2.10 2.08 2.06 2.01 1.97
2.92 2.82 2.72 2.62 2.55 2.50 2.44 2.41 2.38 2.32 2.26
3.59 3.46 3.31 3.16 3.07 3.00 2.92 2.87 2.83 2.75 2.66
5.58 5.32 5.05 4.78 4.60 4.48 4.33 4.24 4.18 4.02 3.87
- 5. TABLA D Valores críticos de la distribución F de Fisher (cont.)
Grados de libertad en el numerador
1 2 3 4 5 6 7 8 9
.100 3.01 2.62 2.42 2.29 2.20 2.13 2.08 2.04 2.00
.050 4.41 3.55 3.16 2.93 2.77 2.66 2.58 2.51 2.46
18 .025 5.98 4.56 3.95 3.61 3.38 3.22 3.10 3.01 2.93
.010 8.29 6.01 5.09 4.58 4.25 4.01 3.84 3.71 3.60
.001 15.38 10.39 8.49 7.46 6.81 6.35 6.02 5.76 5.56
.100 2.99 2.61 2.40 2.27 2.18 2.11 2.06 2.02 1.98
.050 4.38 3.52 3.13 2.90 2.74 2.63 2.54 2.48 2.42
19 .025 5.92 4.51 3.90 3.56 3.33 3.17 3.05 2.96 2.88
.010 8.18 5.93 5.01 4.50 4.17 3.94 3.77 3.63 3.52
.001 15.08 10.16 8.28 7.27 6.62 6.18 5.85 5.59 5.39
.100 2.97 2.59 2.38 2.25 2.16 2.09 2.04 2.00 1.96
.050 4.35 3.49 3.10 2.87 2.71 2.60 2.51 2.45 2.39
20 .025 5.87 4.46 3.86 3.51 3.29 3.13 3.01 2.91 2.84
.010 8.10 5.85 4.94 4.43 4.10 3.87 3.70 3.56 3.46
.001 14.82 9.95 8.10 7.10 6.46 6.02 5.69 5.44 5.24
.100 2.96 2.57 2.36 2.23 2.14 2.08 2.02 1.98 1.95
.050 4.32 3.47 3.07 2.84 2.68 2.57 2.49 2.42 2.37
21 .025 5.83 4.42 3.82 3.48 3.25 3.09 2.97 2.87 2.80
.010 8.02 5.78 4.87 4.37 4.04 3.81 3.64 3.51 3.40
.001 14.59 9.77 7.94 6.95 6.32 5.88 5.56 5.31 5.11
.100 2.95 2.56 2.35 2.22 2.13 2.06 2.01 1.97 1.93
.050 4.30 3.44 3.05 2.82 2.66 2.55 2.46 2.40 2.34
22 .025 5.79 4.38 3.78 3.44 3.22 3.05 2.93 2.84 2.76
.010 7.95 5.72 4.82 4.31 3.99 3.76 3.59 3.45 3.35
.001 14.38 9.61 7.80 6.81 6.19 5.76 5.44 5.19 4.99
.100 2.94 2.55 2.34 2.21 2.11 2.05 1.99 1.95 1.92
.050 4.28 3.42 3.03 2.80 2.64 2.53 2.44 2.37 2.32
23 .025 5.75 4.35 3.75 3.41 3.18 3.02 2.90 2.81 2.73
.010 7.88 5.66 4.76 4.26 3.94 3.71 3.54 3.41 3.30
.001 14.20 9.47 7.67 6.70 6.08 5.65 5.33 5.09 4.89
.100 2.93 2.54 2.33 2.19 2.10 2.04 1.98 1.94 1.91
.050 4.26 3.40 3.01 2.78 2.62 2.51 2.42 2.36 2.30
24 .025 5.72 4.32 3.72 3.38 3.15 2.99 2.87 2.78 2.70
.010 7.82 5.61 4.72 4.22 3.90 3.67 3.50 3.36 3.26
.001 14.03 9.34 7.55 6.59 5.98 5.55 5.23 4.99 4.80
.100 2.92 2.53 2.32 2.18 2.09 2.02 1.97 1.93 1.89
.050 4.24 3.39 2.99 2.76 2.60 2.49 2.40 2.34 2.28
25 .025 5.69 4.29 3.69 3.35 3.13 2.97 2.85 2.75 2.68
.010 7.77 5.57 4.68 4.18 3.85 3.63 3.46 3.32 3.22
.001 13.88 9.22 7.45 6.49 5.89 5.46 5.15 4.91 4.71
.100 2.91 2.52 2.31 2.17 2.08 2.01 1.96 1.92 1.88
.050 4.23 3.37 2.98 2.74 2.59 2.47 2.39 2.32 2.27
26 .025 5.66 4.27 3.67 3.33 3.10 2.94 2.82 2.73 2.65
.010 7.72 5.53 4.64 4.14 3.82 3.59 3.42 3.29 3.18
.001 13.74 9.12 7.36 6.41 5.80 5.38 5.07 4.83 4.64
.100 2.90 2.51 2.30 2.17 2.07 2.00 1.95 1.91 1.87
.050 4.21 3.35 2.96 2.73 2.57 2.46 2.37 2.31 2.25
27 .025 5.63 4.24 3.65 3.31 3.08 2.92 2.80 2.71 2.63
.010 7.68 5.49 4.60 4.11 3.78 3.56 3.39 3.26 3.15
.001 13.61 9.02 7.27 6.33 5.73 5.31 5.00 4.76 4.57
p
Gradosdelibertadeneldenominador
TABLA D Valores críticos de la distribución F de Fisher (cont.)
Grados de libertad en el numerador
10 12 15 20 25 30 40 50 60 120 1000
1.98 1.93 1.89 1.84 1.80 1.78 1.75 1.74 1.72 1.69 1.66
2.41 2.34 2.27 2.19 2.14 2.11 2.06 2.04 2.02 1.97 1.92
2.87 2.77 2.67 2.56 2.49 2.44 2.38 2.35 2.32 2.26 2.20
3.51 3.37 3.23 3.08 2.98 2.92 2.84 2.78 2.75 2.66 2.58
5.39 5.13 4.87 4.59 4.42 4.30 4.15 4.06 4.00 3.84 3.69
1.96 1.91 1.86 1.81 1.78 1.76 1.73 1.71 1.70 1.67 1.64
2.38 2.31 2.23 2.16 2.11 2.07 2.03 2.00 1.98 1.93 1.88
2.82 2.72 2.62 2.51 2.44 2.39 2.33 2.30 2.27 2.20 2.14
3.43 3.30 3.15 3.00 2.91 2.84 2.76 2.71 2.67 2.58 2.50
5.22 4.97 4.70 4.43 4.26 4.14 3.99 3.90 3.84 3.68 3.53
1.94 1.89 1.84 1.79 1.76 1.74 1.71 1.69 1.68 1.64 1.61
2.35 2.28 2.20 2.12 2.07 2.04 1.99 1.97 1.95 1.90 1.85
2.77 2.68 2.57 2.46 2.40 2.35 2.29 2.25 2.22 2.16 2.09
3.37 3.23 3.09 2.94 2.84 2.78 2.69 2.64 2.61 2.52 2.43
5.08 4.82 4.56 4.29 4.12 4.00 3.86 3.77 3.70 3.54 3.40
1.92 1.87 1.83 1.78 1.74 1.72 1.69 1.67 1.66 1.62 1.59
2.32 2.25 2.18 2.10 2.05 2.01 1.96 1.94 1.92 1.87 1.82
2.73 2.64 2.53 2.42 2.36 2.31 2.25 2.21 2.18 2.11 2.05
3.31 3.17 3.03 2.88 2.79 2.72 2.64 2.58 2.55 2.46 2.37
4.95 4.70 4.44 4.17 4.00 3.88 3.74 3.64 3.58 3.42 3.28
1.90 1.86 1.81 1.76 1.73 1.70 1.67 1.65 1.64 1.60 1.57
2.30 2.23 2.15 2.07 2.02 1.98 1.94 1.91 1.89 1.84 1.79
2.70 2.60 2.50 2.39 2.32 2.27 2.21 2.17 2.14 2.08 2.01
3.26 3.12 2.98 2.83 2.73 2.67 2.58 2.53 2.50 2.40 2.32
4.83 4.58 4.33 4.06 3.89 3.78 3.63 3.54 3.48 3.32 3.17
1.89 1.84 1.80 1.74 1.71 1.69 1.66 1.64 1.62 1.59 1.55
2.27 2.20 2.13 2.05 2.00 1.96 1.91 1.88 1.86 1.81 1.76
2.67 2.57 2.47 2.36 2.29 2.24 2.18 2.14 2.11 2.04 1.98
3.21 3.07 2.93 2.78 2.69 2.62 2.54 2.48 2.45 2.35 2.27
4.73 4.48 4.23 3.96 3.79 3.68 3.53 3.44 3.38 3.22 3.08
1.88 1.83 1.78 1.73 1.70 1.67 1.64 1.62 1.61 1.57 1.54
2.25 2.18 2.11 2.03 1.97 1.94 1.89 1.86 1.84 1.79 1.74
2.64 2.54 2.44 2.33 2.26 2.21 2.15 2.11 2.08 2.01 1.94
3.17 3.03 2.89 2.74 2.64 2.58 2.49 2.44 2.40 2.31 2.22
4.64 4.39 4.14 3.87 3.71 3.59 3.45 3.36 3.29 3.14 2.99
1.87 1.82 1.77 1.72 1.68 1.66 1.63 1.61 1.59 1.56 1.52
2.24 2.16 2.09 2.01 1.96 1.92 1.87 1.84 1.82 1.77 1.72
2.61 2.51 2.41 2.30 2.23 2.18 2.12 2.08 2.05 1.98 1.91
3.13 2.99 2.85 2.70 2.60 2.54 2.45 2.40 2.36 2.27 2.18
4.56 4.31 4.06 3.79 3.63 3.52 3.37 3.28 3.22 3.06 2.91
1.86 1.81 1.76 1.71 1.67 1.65 1.61 1.59 1.58 1.54 1.51
2.22 2.15 2.07 1.99 1.94 1.90 1.85 1.82 1.80 1.75 1.70
2.59 2.49 2.39 2.28 2.21 2.16 2.09 2.05 2.03 1.95 1.89
3.09 2.96 2.81 2.66 2.57 2.50 2.42 2.36 2.33 2.23 2.14
4.48 4.24 3.99 3.72 3.56 3.44 3.30 3.21 3.15 2.99 2.84
1.85 1.80 1.75 1.70 1.66 1.64 1.60 1.58 1.57 1.53 1.50
2.20 2.13 2.06 1.97 1.92 1.88 1.84 1.81 1.79 1.73 1.68
2.57 2.47 2.36 2.25 2.18 2.13 2.07 2.03 2.00 1.93 1.86
3.06 2.93 2.78 2.63 2.54 2.47 2.38 2.33 2.29 2.20 2.11
4.41 4.17 3.92 3.66 3.49 3.38 3.23 3.14 3.08 2.92 2.78
- 6. TABLA D Valores críticos de la distribución F de Fisher (cont.)
Grados de libertad en el numerador
1 2 3 4 5 6 7 8 9
.100 2.89 2.50 2.29 2.16 2.06 2.00 1.94 1.90 1.87
.050 4.20 3.34 2.95 2.71 2.56 2.45 2.36 2.29 2.24
28 .025 5.61 4.22 3.63 3.29 3.06 2.90 2.78 2.69 2.61
.010 7.64 5.45 4.57 4.07 3.75 3.53 3.36 3.23 3.12
.001 13.50 8.93 7.19 6.25 5.66 5.24 4.93 4.69 4.50
.100 2.89 2.50 2.28 2.15 2.06 1.99 1.93 1.89 1.86
.050 4.18 3.33 2.93 2.70 2.55 2.43 2.35 2.28 2.22
29 .025 5.59 4.20 3.61 3.27 3.04 2.88 2.76 2.67 2.59
.010 7.60 5.42 4.54 4.04 3.73 3.50 3.33 3.20 3.09
.001 13.39 8.85 7.12 6.19 5.59 5.18 4.87 4.64 4.45
.100 2.88 2.49 2.28 2.14 2.05 1.98 1.93 1.88 1.85
.050 4.17 3.32 2.92 2.69 2.53 2.42 2.33 2.27 2.21
30 .025 5.57 4.18 3.59 3.25 3.03 2.87 2.75 2.65 2.57
.010 7.56 5.39 4.51 4.02 3.70 3.47 3.30 3.17 3.07
.001 13.29 8.77 7.05 6.12 5.53 5.12 4.82 4.58 4.39
.100 2.84 2.44 2.23 2.09 2.00 1.93 1.87 1.83 1.79
.050 4.08 3.23 2.84 2.61 2.45 2.34 2.25 2.18 2.12
40 .025 5.42 4.05 3.46 3.13 2.90 2.74 2.62 2.53 2.45
.010 7.31 5.18 4.31 3.83 3.51 3.29 3.12 2.99 2.89
.001 12.61 8.25 6.59 5.70 5.13 4.73 4.44 4.21 4.02
.100 2.81 2.41 2.20 2.06 1.97 1.90 1.84 1.80 1.76
.050 4.03 3.18 2.79 2.56 2.40 2.29 2.20 2.13 2.07
50 .025 5.34 3.97 3.39 3.05 2.83 2.67 2.55 2.46 2.38
.010 7.17 5.06 4.20 3.72 3.41 3.19 3.02 2.89 2.78
.001 12.22 7.96 6.34 5.46 4.90 4.51 4.22 4.00 3.82
.100 2.79 2.39 2.18 2.04 1.95 1.87 1.82 1.77 1.74
.050 4.00 3.15 2.76 2.53 2.37 2.25 2.17 2.10 2.04
60 .025 5.29 3.93 3.34 3.01 2.79 2.63 2.51 2.41 2.33
.010 7.08 4.98 4.13 3.65 3.34 3.12 2.95 2.82 2.72
.001 11.97 7.77 6.17 5.31 4.76 4.37 4.09 3.86 3.69
.100 2.76 2.36 2.14 2.00 1.91 1.83 1.78 1.73 1.69
.050 3.94 3.09 2.70 2.46 2.31 2.19 2.10 2.03 1.97
100 .025 5.18 3.83 3.25 2.92 2.70 2.54 2.42 2.32 2.24
.010 6.90 4.82 3.98 3.51 3.21 2.99 2.82 2.69 2.59
.001 11.50 7.41 5.86 5.02 4.48 4.11 3.83 3.61 3.44
.100 2.73 2.33 2.11 1.97 1.88 1.80 1.75 1.70 1.66
.050 3.89 3.04 2.65 2.42 2.26 2.14 2.06 1.98 1.93
200 .025 5.10 3.76 3.18 2.85 2.63 2.47 2.35 2.26 2.18
.010 6.76 4.71 3.88 3.41 3.11 2.89 2.73 2.60 2.50
.001 11.15 7.15 5.63 4.81 4.29 3.92 3.65 3.43 3.26
.100 2.71 2.31 2.09 1.95 1.85 1.78 1.72 1.68 1.64
.050 3.85 3.00 2.61 2.38 2.22 2.11 2.02 1.95 1.89
1000 .025 5.04 3.70 3.13 2.80 2.58 2.42 2.30 2.20 2.13
.010 6.66 4.63 3.80 3.34 3.04 2.82 2.66 2.53 2.43
.001 10.89 6.96 5.46 4.65 4.14 3.78 3.51 3.30 3.13
p
Gradosdelibertadeneldenominador
TABLA D Valores críticos de la distribución F de Fisher (cont.)
Grados de libertad en el numerador
10 12 15 20 25 30 40 50 60 120 1000
1.84 1.79 1.74 1.69 1.65 1.63 1.59 1.57 1.56 1.52 1.48
2.19 2.12 2.04 1.96 1.91 1.87 1.82 1.79 1.77 1.71 1.66
2.55 2.45 2.34 2.23 2.16 2.11 2.05 2.01 1.98 1.91 1.84
3.03 2.90 2.75 2.60 2.51 2.44 2.35 2.30 2.26 2.17 2.08
4.35 4.11 3.86 3.60 3.43 3.32 3.18 3.09 3.02 2.86 2.72
1.83 1.78 1.73 1.68 1.64 1.62 1.58 1.56 1.55 1.51 1.47
2.18 2.10 2.03 1.94 1.89 1.85 1.81 1.77 1.75 1.70 1.65
2.53 2.43 2.32 2.21 2.14 2.09 2.03 1.99 1.96 1.89 1.82
3.00 2.87 2.73 2.57 2.48 2.41 2.33 2.27 2.23 2.14 2.05
4.29 4.05 3.80 3.54 3.38 3.27 3.12 3.03 2.97 2.81 2.66
1.82 1.77 1.72 1.67 1.63 1.61 1.57 1.55 1.54 1.50 1.46
2.16 2.09 2.01 1.93 1.88 1.84 1.79 1.76 1.74 1.68 1.63
2.51 2.41 2.31 2.20 2.12 2.07 2.01 1.97 1.94 1.87 1.80
2.98 2.84 2.70 2.55 2.45 2.39 2.30 2.25 2.21 2.11 2.02
4.24 4.00 3.75 3.49 3.33 3.22 3.07 2.98 2.92 2.76 2.61
1.76 1.71 1.66 1.61 1.57 1.54 1.51 1.48 1.47 1.42 1.38
2.08 2.00 1.92 1.84 1.78 1.74 1.69 1.66 1.64 1.58 1.52
2.39 2.29 2.18 2.07 1.99 1.94 1.88 1.83 1.80 1.72 1.65
2.80 2.66 2.52 2.37 2.27 2.20 2.11 2.06 2.02 1.92 1.82
3.87 3.64 3.40 3.14 2.98 2.87 2.73 2.64 2.57 2.41 2.25
1.73 1.68 1.63 1.57 1.53 1.50 1.46 1.44 1.42 1.38 1.33
2.03 1.95 1.87 1.78 1.73 1.69 1.63 1.60 1.58 1.51 1.45
2.32 2.22 2.11 1.99 1.92 1.87 1.80 1.75 1.72 1.64 1.56
2.70 2.56 2.42 2.27 2.17 2.10 2.01 1.95 1.91 1.80 1.70
3.67 3.44 3.20 2.95 2.79 2.68 2.53 2.44 2.38 2.21 2.05
1.71 1.66 1.60 1.54 1.50 1.48 1.44 1.41 1.40 1.35 1.30
1.99 1.92 1.84 1.75 1.69 1.65 1.59 1.56 1.53 1.47 1.40
2.27 2.17 2.06 1.94 1.87 1.82 1.74 1.70 1.67 1.58 1.49
2.63 2.50 2.35 2.20 2.10 2.03 1.94 1.88 1.84 1.73 1.62
3.54 3.32 3.08 2.83 2.67 2.55 2.41 2.32 2.25 2.08 1.92
1.66 1.61 1.56 1.49 1.45 1.42 1.38 1.35 1.34 1.28 1.22
1.93 1.85 1.77 1.68 1.62 1.57 1.52 1.48 1.45 1.38 1.30
2.18 2.08 1.97 1.85 1.77 1.71 1.64 1.59 1.56 1.46 1.36
2.50 2.37 2.22 2.07 1.97 1.89 1.80 1.74 1.69 1.57 1.45
3.30 3.07 2.84 2.59 2.43 2.32 2.17 2.08 2.01 1.83 1.64
1.63 1.58 1.52 1.46 1.41 1.38 1.34 1.31 1.29 1.23 1.16
1.88 1.80 1.72 1.62 1.56 1.52 1.46 1.41 1.39 1.30 1.21
2.11 2.01 1.90 1.78 1.70 1.64 1.56 1.51 1.47 1.37 1.25
2.41 2.27 2.13 1.97 1.87 1.79 1.69 1.63 1.58 1.45 1.30
3.12 2.90 2.67 2.42 2.26 2.15 2.00 1.90 1.83 1.64 1.43
1.61 1.55 1.49 1.43 1.38 1.35 1.30 1.27 1.25 1.18 1.08
1.84 1.76 1.68 1.58 1.52 1.47 1.41 1.36 1.33 1.24 1.11
2.06 1.96 1.85 1.72 1.64 1.58 1.50 1.45 1.41 1.29 1.13
2.34 2.20 2.06 1.90 1.79 1.72 1.61 1.54 1.50 1.35 1.16
2.99 2.77 2.54 2.30 2.14 2.02 1.87 1.77 1.69 1.49 1.22