Chromarogaphy system suitability ppt
•
30 likes•12,878 views

This presentation contains system suitability parameters of chromatographic system

Recommended
More Related Content
What's hot
What's hot (20)
Similar to Chromarogaphy system suitability ppt
Similar to Chromarogaphy system suitability ppt (20)
More from kiranreddy munnangi
Recently uploaded
Recently uploaded (20)
Chromarogaphy system suitability ppt
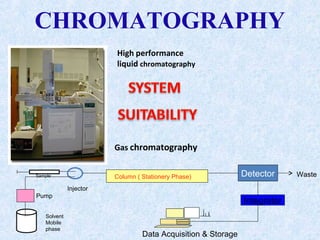
- 1. CHROMATOGRAPHY Gas chromatography High performance liquid chromatography Sample Data Acquisition & Storage Solvent Mobile phase Pump Injector Detector Integrator Column ( Stationery Phase) Waste
- 2. What is system suitability test? It is used to verify that the chromatographic system is suitable for the intended analysis. That is to ensure that the complete testing system including instruments,electronics,reagents,column & analyst is suitable for intended application. System suitability test is an essential part of HPLC & GC methods
- 3. WHEN IS SYSTEM SUITABILITY TEST? At the beginning of analysis & At the end of analysis it is better to inject after every six injections. No sample analysis is acceptable unless the requirements of system suitability have been met. When ever there is a significant change in equipment or in a critical reagent, suitability testing should be performed before the injection of samples.
- 4. HOW TO VARIFY CHROMATOGRAPHIC SYSTEM BY SYSTEM SUITABILITY TEST? By injecting system suitability test solution and by checking SST parameters whether they are in the specification limit or not. If they are in the specification limit then chromatographic system is suitable for analysis. If they are not in the specification limit then chromatographic system is not suitable for analysis
- 5. WHAT ARE THE SST PARAMETERS? 1.PRECISION 2.CAPACITY FACTOR 4.RESOLUTION 5.THEORETICAL PLATE 6.TAILING FACTOR 3.SELECTIVITY FACTOR
- 6. PRECISION (OR INJECTION REPETABILITY) Precision useually expressed in terms of Relative Standard Deviation (RSD) RSD indicates the performance of equipment which includes Plumbing, Column & Environmental condition at the time of analysis. It should be note that sample preparation & manufacturing variations not considered. Precision is the closeness with which results of replicate analyses of a sample agree
- 7. HOW TO CALCULATE %RSD: %RSD = Standard Deviation*100/Mean Standard deviation Arithmetic Mean Inject working standard at specified concentration for six times and calculate %RSD Note : %RSD of six replicate injections is not more than 1% is desirable and up to 2.0% and more than 2.0% are also acceptable.
- 8. CAPACITY FACTOR or RETENTION FACTOR(k’) It is the migration rate of analyte on a column. It is a measure of where the peak of interest is located w.r.to void volume. A measure of the time the sample component resides in the stationary phase relative to the time it resides in the mobile phase. It is the ratio of the adjusted retention volume (time) and the hold-up or Void volume (time). K¹ = VR¹/Vo = tR¹/ to
- 9. tR -Retention time of analyte. to-Retention time of Mobile phase. VR: Retention volume: volume of mobile phase required to elute a solute Retention time of analyte(tR): The time between sample injection and an analyte peak reaching a detector at the end of the column. Retention time of Mobile phase(tM): The time taken for the mobile phase to pass through the column. K¹ = VR¹/VM = tR¹/ to =(tR-to)/tM
- 10. NOTE: 1.The analyte peak should be well resolved from the void volume & other peaks. 2.Generally the ideal valve of K¹ is 2-5.But the valve acceptable between 1-20 If less than one means elution takes very fast accurate determination of Rt is very difficult. If greater than 20 means elution takes very long time.
- 11. SELECTIVITY FACTOR OR RELATIVE RETENTION(α) It describes the separation of two species on the column. The relative retention of a two peaks in a chromatogram is called SELECTIVITY . Selectivity (α ) = K2/K1 = (tR2-tM)/(tR1-tM) Note: 1.Selectivity factor always greater than 1.
- 12. RESOLUTION (R) Although the selectivity factor describes the separation of band centers it does not take account into the base widths. Another measure of how well species have been separated is provided by measurement of the Resolution. “The ratio of separation of band maxima to their average base width”. Resolution is “The distance between the peaks centers of two component peaks divided by the average base width of the peaks” “The ability of a chromatographic column to separate peaks. It is usually expressed in terms of the separation between two adjacent peaks”
- 13. 2 ( tr2-tr1) R = ------------- Wb2+Wb1 Note: 1.Base line resolution achieved at R=1.5. But more than two is desirable. 2.We can relate the resolution to the number of plates in the column, the selectivity factor and the retention factors of the two solutes.
- 14. N: is the average column plate number for the two bands of interest k: is the average k value for the two bands α: separation factor of the two peaks k and α are in practice controlled by changing the column packing and by varying the composition of the mobile phase solvent (solvent parameters) N is controlled by changing the mobile phase flow rate, packing particle size and column dimensions
- 15. EFFICIENCY (or )THEORITICAL PLATE NUMBER(N) Theoretical plate number is a (theoretical) “measure of the efficiency per unit length of the column”. Martine & Synge used a chromatographic model involving a hypothetical division of column in to no.of plates (known as theoretical plate). And the volume of one plate was such that “the solute concentration in mobile phase leaving the plate was in equilibrium with average solute concentration in the stationary phase in that plate”(If the equilibration constant of solute is 1) After sufficient equilibrations, The compound distributed through out the whole column but maximally concentrated at the center of the column. i.e. Greater the no.of equilibrations that occur on a column the greater becomes the concentration of compound on a certain part of the column. column Theoretical plate
- 16. M.P 500 Solute 1000 S.P 500 M.P 250 250 Solute 500 500 S.P 250 250 M.P 125 250 125 Solute 250 250+250=500 250 S.P 125 250 125 M.P 62.5 187.5 187.5 62.5 Solute 125 125+250=375 250+125=375 125 S.P 62.5 187.5 187.5 62.5 M.P 31.25 125 187.5 125 31.25 Solute 62.5 62.5+187.5=250 187.5+187.5=375 187.5+62.5=250 62.5 S.P 31.25 125 187.5 125 31.25 PROCESS AT COLUMN
- 17. tR tR = Retention time of analyte. N = 16 (---------)² Wb =Width of peak at base. Wb Calculation of number of theoretical plate(N): tR tR = Retention time of analyte. N = 5.545 (---------)² W0.5 = Width of peak at half height W0.5 of the peak. tR N = σ (---------)² W There are different methods for calculation of N : W σ Method Wi 4 Inflection ( 2σ ) Wh 5.54 half peak height W3σ 9 3σ W4σ 16 4σ W5σ 25 5σ Wtan 16 tangent No of theoretical plates is more then the column is more efficient. N= More than 2000 is desirable
- 18. HETP : Gidding pointed out that equilibrium is attained only at band maxima and non equilibrium takes place at all other points .which contradict to Martin & Synge. The height at which band maxima is appeared(or equilibrium is attained) is known as Height Equivalent To Theoretical Plate(HETP). L Length of the column H = HETP = ---- = --------------------------- N No of theoretical plates Smaller the valve of HETP more efficient is the column.
- 19. TAILING FACTOR or ASYMETRIC FACTOR It is a factor describing shape of a chromatographic peak. And it is a measure of peak tailing. Theory assumes a ideal symmetric peak which is known as Gaussian peak. The front side deviation from the Gaussian peak is known as peak fronting & rear side deviation is known as peak tailing. Peak fronting is very rare in regular analysis so every one look on tailing mainly.
- 20. TAILING FACTOR or ASYMETRIC FACTOR
- 21. Tailing factor is defined as “the distance from the front slope of the peak to the back slope divided by twice the distance from the center line of the peak to the front slope, with all measurements made at 5% of the maximum peak height”. Asymmetric factor is defined as “the distance from front slope of the peak to the center of line divided by the distance from the center line to the back slope of the peak, with all measurements made at 10% of the maximum peak height”. Tailing factor less than 1.5 is desirable and more than 1.5 is also acceptable.
- 22. Plate height = H = A + B/u + u [CM +CS] Van Deemter model u = L/ tM A: Eddy diffusion random movement through stationary phase B: Longitudinal diffusion diffusion from high concentration to low concentration CS: Stationary mass transfer CM: Mobile phase mass transfer u: average linear velocity of mobile phase
- 23. Term A - molecules may travel unequal distances - independent of u - depends on size of stationary particles or coating (TLC) H = A + B/u + u [CM +CS] Van Deemter model time Eddy diffusion MP moves through the column which is packed with stationary phase. Solute molecules will take different paths through the stationary phase at random. This will cause broadening of the solute band, because different paths are of different lengths.
- 24. Term B H = A + B/u + u [CM +CS] Van Deemter model Longitudinal diffusion B = 2γ DM γ: Impedance factor due to packing DM: molecular diffusion coefficient B term dominates at low u and is more important in GC than LC since DM(gas) > 104 DM(liquid) One of the main causes of band spreading is DIFFUSION The diffusion coefficient measures the ratio at which a substance moves randomly from a region of high concentration to a region of lower concentration
- 25. Term B H = A + B/u + u [CM +CS] Van Deemter model Longitudinal diffusion B = 2γ DM γ: Impedance factor due to packing DM: molecular diffusion coefficient B term dominates at low u and is more important in GC than LC since DM(gas) > 104 DM(liquid) B - Longitudinal diffusion The concentration of analyte is less at the edges of the band than at the centre. Analyte diffuses out from the centre to the edges. This causes band broadening. If the velocity of the mobile phase is high then the analyte spends less time on the column, which decreases the effects of longitudinal diffusion.
- 26. Cs: stationary phase mass transfer Cs = [(df)2 ]/Ds df: stationary phase film thickness Ds: diffusion coefficient of analyte in SP CM: mobile phase – mass transfer CM = [(dP)2 ]/DM packed columns CM = [(dC)2 ]/DM open columns H = A + B/u + u [CM +CS] Van Deemter model Term C dP: particle diameter dC: column diameter Bandwidth Stationary phase Mobile phase Elution Broadened bandwidth Slow equilibration
- 27. Cs: stationary phase mass transfer CM: mobile phase – mass transfer H = A + B/u + u [CM +CS] Van Deemter model Term C Bandwidth Stationary phase Mobile phase Elution Broadened bandwidth Slow equilibration C - Resistance to mass transfer The analyte takes a certain amount of time to equilibrate between the stationary and mobile phase. If the velocity of the mobile phase is high, and the analyte has a strong affinity for the stationary phase, then the analyte in the mobile phase will move ahead of the analyte in the stationary phase. The band of analyte is broadened. The higher the velocity of mobile phase, the worse the broadening becomes.