Pmp chap 11 - project risk management - Part 2
•
127 likes•13,030 views

project risk management

Recommended
More Related Content
What's hot
What's hot (20)
Viewers also liked
Viewers also liked (19)
Similar to Pmp chap 11 - project risk management - Part 2
Similar to Pmp chap 11 - project risk management - Part 2 (20)
More from Anand Bobade
More from Anand Bobade (17)
Recently uploaded
Recently uploaded (20)
Pmp chap 11 - project risk management - Part 2
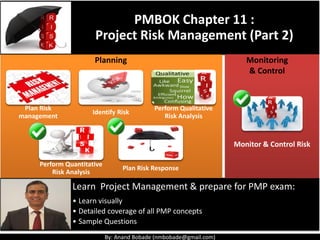
- 1. By: Anand Bobade (nmbobade@gmail.com) Learn Project Management & prepare for PMP exam: • Learn visually • Detailed coverage of all PMP concepts • Sample Questions PMBOK Chapter 11 : Project Risk Management (Part 2) Monitor & Control Risk Monitoring & Control Planning Plan Risk management Identify Risk Perform Qualitative Risk Analysis Perform Quantitative Risk Analysis Plan Risk Response
- 2. By: Anand Bobade (nmbobade@gmail.com) Learning Objectives – 11.4 Perform Quantitative Risk Analysis Definition Diff. between Qualitative & Quantitative risk Analysis Why Quantitative Risk Analysis? Perform Quantitative Risk Analysis: ITTO Summary Guidelines for exam questions
- 3. By: Anand Bobade (nmbobade@gmail.com) Introduction – Risk Management Processes 11.1 Plan Risk Management • Define how to conduct risk management activities 11.2 Identify Risks • Determine & document which risks may affect the project 11.3 Perform Qualitative Risk Analysis • Prioritize risks by analyzing their probability & impact.
- 4. By: Anand Bobade (nmbobade@gmail.com) Introduction – Risk Management Processes 11.4 Perform Quantitative Risk Analysis • Numerically analyze the effect of identified risks. 11.5 Plan Risk Responses • How to respond to enhance opportunities & to reduce threats 11.6 Control Risk • Track risk, monitor residual risks, identify new risks, & evaluate effectiveness of risk planning.
- 5. By: Anand Bobade (nmbobade@gmail.com) Numerically analyzing the effect of identified risks on overall project objectives. It produces quantitative risk information to support decision making. Prioritized Risk (Qualitative Analysis) Quantitative Analysis Impact on project objectives 11.4 Perform Quantitative Risk Analysis
- 6. By: Anand Bobade (nmbobade@gmail.com) Purpose of this process: Determine which risk events warrant a response. Determine overall project risk (risk exposure). Determine quantified probability of meeting proj. objectives. Determine cost and schedule reserves. Identify risks requiring the most attention. Create realistic & achievable cost, schedule, or scope targets. 11.4 Perform Quantitative Risk Analysis
- 7. By: Anand Bobade (nmbobade@gmail.com) This process can be skipped if Risks doesn’t require this approach PM may not consider this process due to insufficient data to develop analysis models There is no need to perform in depth Risk analysis for every project. PM should exercise expert judgment to decide on the need. Availability of Time & budget should be consider to decide 11.4 Perform Quantitative Risk Analysis
- 8. By: Anand Bobade (nmbobade@gmail.com) 11.4 Perform Quantitative Risk Analysis->ITTO Inputs (6) • Risk management plan • Cost management plan • Schedule management plan • Risk register • EEF • OPA Tools & Techniques(3) • Data gathering and representation techniques • Quantitative risk analysis & modeling techniques • Expert judgment Outputs • Project document updates By: Anand Bobade (nmbobade@gmail.com)
- 9. By: Anand Bobade (nmbobade@gmail.com) Risk Management Plan Cost Management Plan Schedule Management Plan Risk Register EEF OPA 11.4 Perform Quantitative Risk Analysis->Inputs
- 10. By: Anand Bobade (nmbobade@gmail.com) Risk Management Plan Defines projects Risk Management Roadmap Proposed processes & Methods Resource, Schedule & Budget requirements Stakeholder - Roles & Responsibilities Risk Categorization 11.4 Perform Quantitative RA->Inputs->RMP
- 11. By: Anand Bobade (nmbobade@gmail.com) Risk Register List of Identified Risks Potential Response Root Cause Risk Ranking (from Qualitative analysis) 11.4 Perform Quantitative RA->Inputs->Risk Register
- 12. By: Anand Bobade (nmbobade@gmail.com) Cost Management Plan Both plans are crucial part of Project Management Plan. It contains direction on Cost & schedule, and how to manage it. They are crucial inputs to perform numerical analysis .}} Schedule Management Plan 11.4 Perform Quantitative RA->Inputs->CMP & SMP
- 13. By: Anand Bobade (nmbobade@gmail.com) EEF Commercial Databases Academic studies Published checklists Benchmarking Industry studies Risk attitudes 11.4 Perform Quantitative RA->Inputs->EEF
- 14. By: Anand Bobade (nmbobade@gmail.com) OPA Categories Common Definitions & terms Risk statement format Templates Lesson learned 11.4 Perform Quantitative RA->Inputs->EEF & OPA
- 15. By: Anand Bobade (nmbobade@gmail.com) Data gathering & Representation Techniques Quantitative Risk analysis & Modeling Techniques Expert Judgment 11.4 Perform Quantitative Risk Analysis->T&T
- 16. By: Anand Bobade (nmbobade@gmail.com) Data gathering & Representation Techniques Key Techniques: Interviewing Probability Distribution Sensitivity analysis Expected Monetary Value (EMV): 11.4 Perform Quantitative Risk Analysis->T&T->DG&RT
- 17. By: Anand Bobade (nmbobade@gmail.com) Data gathering & Representation Techniques Interviewing: • Experience & Historical data • Quantify probability & impact of Risk Data based on Expert Opinion Likelihood of completing the project 11.4 Perform Quantitative Risk Analysis->T&T->DG&RT
- 18. By: Anand Bobade (nmbobade@gmail.com) Data gathering & Representation Techniques What is Probability? • Probability is measurement of likelihood of occurrence of any event. Example: • If you toss a coin, it will either show heads or the tails. • 50% chance of showing heads & 50% chance of showing tails. What is probability? • The probability of showing heads or tails is 50% (or 1/2). 11.4 Perform Quantitative Risk Analysis->T&T->DG&RT
- 19. By: Anand Bobade (nmbobade@gmail.com) Data gathering & Representation Techniques Probability Formula & Example: • = “Number of favourable events that can occur” / “Total number of events” Probability of an event happening • = 2 [Coin can either show heads or tail ] Total number of events • = 1 Total number of favourable events • = (Number of favourable events)/(Total number of events) Probability of showing heads • = ½ = 50% Probability of showing heads 11.4 Perform Quantitative Risk Analysis->T&T->DG&RT
- 20. By: Anand Bobade (nmbobade@gmail.com) Data gathering & Representation Techniques Probability Example2: If you throw a dice, what is the probability of the number 3 coming up. • = “Number of favourable events that can occur” / “Total number of events” Probability of an event happening • = 6 [dice can show 1 or 2 or 3 or 4 or 5 or 6] Total number of events • = 1 [You want dice to show no 3] Total number of favourable events • = 1/6 = 16.67% Probability of showing heads 11.4 Perform Quantitative Risk Analysis->T&T->DG&RT
- 21. By: Anand Bobade (nmbobade@gmail.com) Data gathering & Representation Techniques Probability Example3: For given project, Probability of completing one Task on time is 90%. What is probability of completing all scheduled task on time? 11.4 Perform Quantitative Risk Analysis->T&T->DG&RT =100*0.90 = 90% =90*0.90 =81% =81*0.90 =72% =72*0.90 =65% Task 1 Task 2 Task 3 Task 4 Probability of Individual Tasks 90% 90% 90% 90% One Task (90%) Two Tasks (90% of prev.) Three tasks (90% of prev.) All tasks (90% of prev.)
- 22. By: Anand Bobade (nmbobade@gmail.com) Data gathering & Representation Techniques What is Impact? • The amount that will have to spend if any identified risk occurs. Example: • During execution, PM identified Software licenses cost are increased & will need additional 100 thousand. • The impact of risk = 100 thousand. 11.4 Perform Quantitative Risk Analysis->T&T->DG&RT
- 23. By: Anand Bobade (nmbobade@gmail.com) Data gathering & Representation Techniques Probability distribution • Used to plot range of cost & schedule associated with a risk. • Used extensively in modelling & simulations • Represent uncertainty in values such as duration of schedule activities & cost of project components Continuous Distribution: • Used to represent uncertain event, such as a outcome of a test or a possible scenarios in the decision tree. • E.g., Flipping a coin Discrete Distribution: 11.4 Perform Quantitative Risk Analysis->T&T->DG&RT
- 24. By: Anand Bobade (nmbobade@gmail.com) Data gathering & Representation Techniques Continuos distribution Beta Triangular Normal Uniform Beta distribution • Describe uncertainty about probability of occurrence of an event • Is based on two shaped parameters • Range from 0 to 1 & can take several types of shapes. Triangular distribution: • Uses estimate values based on the 3 point estimates • Use only 3 values • Is used to quantify risks for each of the WBS elements 11.4 Perform Quantitative Risk Analysis->T&T->DG&RT
- 25. By: Anand Bobade (nmbobade@gmail.com) Data gathering & Representation Techniques Normal distribution: • Is shaped like a bell curve • The peak of the bell is the Mean/Average • Used for variables that cluster around Mean • Used to show confidence level & variations 11.4 Perform Quantitative Risk Analysis->T&T->DG&RT
- 26. By: Anand Bobade (nmbobade@gmail.com) Data gathering & Representation Techniques Uniform distribution: • Simplest form of distributions • All values of same length (equal probability) • Need to know upper & lower limits (range) • Show scenarios where no obvious value is more likely to happen than the other 11.4 Perform Quantitative Risk Analysis->T&T->DG&RT
- 27. By: Anand Bobade (nmbobade@gmail.com) Data gathering & Representation Techniques Discrete distribution Discrete Uniform Binomial Hypergeometric Etc… Show uncertain events such as outcome of decisions or tests (Used in Decision Tree analysis) They represent several possible outcomes Each outcome is assigned a probability & each bar represents an outcome The sum of all these probabilities works out to 1 or 100% 11.4 Perform Quantitative Risk Analysis->T&T->DG&RT
- 28. By: Anand Bobade (nmbobade@gmail.com) Quantitative Risk analysis & Modeling Techniques Sensitivity analysis (Tornado Diagram ) Expected monetary value (EMV): 11.4 Perform Quantitative Risk Analysis->T&T->QRA&MT
- 29. By: Anand Bobade (nmbobade@gmail.com) Quantitative Risk analysis & Modeling Techniques Tornado Diagram (Sensitivity Analysis) Determine impact of risk on just one of project objectives, while assuming there is no impact on rest of them. Determine which risks have most potential impact to project. E.g., Risk1 Provide +ve & -ve impact of each risk & let you choose which risk to take. Positive Impact Negative Impact 11.4 Perform Quantitative Risk Analysis->T&T->QRA&MT
- 30. By: Anand Bobade (nmbobade@gmail.com) Quantitative Risk analysis & Modeling Techniques Expected Monetary Value: It calculates average outcomes when the future includes scenarios that may or may not happen. It is used to convert the risk into a number Assists PM calculate the contingency reserve Helps compare a risk with other risks It helps in selecting the choice which involves less money to manage the risks. In general, it can be used to select profitable business scenario or solution. 11.4 Perform Quantitative Risk Analysis->T&T->QRA&MT
- 31. By: Anand Bobade (nmbobade@gmail.com) 11.4 Perform Quantitative Risk Analysis->T&T->QRA&MT Quantitative Risk analysis & Modeling Techniques Below are 3 risks with Probabilities & Impact. What is the total cost of managing these risks? Risk Probability (P) Impact (I) EMV (P * I) Hardware may cost more 10 % - 10,000 - 1,000 Licenses cost may increase 20 % - 6,000 - 1,200 Resource cost may reduce 90 % + 2,000 + 1,800 Total Cost of all Risks: = (-1000)+(-1200)+(1800) - 400 Expected Monetary Value: = Probability X Impact
- 32. By: Anand Bobade (nmbobade@gmail.com) 11.4 Perform Quantitative Risk Analysis->T&T->QRA&MT Quantitative Risk analysis & Modeling Techniques Expected monetary value: Calculate amount based on percentage Calculate the Net node value Calculate value of each options by adding all chances Select the better value as preferred option: EMV For example, you have a risk and you have identified two risk response strategies to manage this risk. How will you select the best strategy?
- 33. By: Anand Bobade (nmbobade@gmail.com) 11.4 Perform Quantitative Risk Analysis->T&T->QRA&MT Quantitative Risk analysis & Modeling Techniques Decision Tree & EMV Example 2: Decide weather to build new CAR manufacturing plant or upgrade existing based on demand. 1 Cost of Building a new plant 120 M 2 Cost of Upgrading plant 50 M Chance of Strong Demand: 60% # Demand scenario Possible Profit A New plant - Strong Demand 200 M B New plant - Week Demand 90 M C Upgrade – Strong Demand 120 M D Upgrade – Week Demand 60 M Note: In first example Project costs are not given.
- 34. By: Anand Bobade (nmbobade@gmail.com) Build / Upgrade New Plant Strong Demand Week Demand Upgrade plant Strong Demand Week Demand 11.4 Perform Quantitative Risk Analysis->T&T->QRA&MT Quantitative Risk analysis & Modeling Techniques 60% 40% Decision Tree example 60% 40% Investment= 120M Investment= 50M
- 35. By: Anand Bobade (nmbobade@gmail.com) Build / Upgrade New Plant Strong Demand Profit: 200M Week Demand Profit: 90M Upgrade plant Strong Demand Profit: 120M Week Demand Profit: 60M 11.4 Perform Quantitative Risk Analysis->T&T->QRA&MT Quantitative Risk analysis & Modeling Techniques 60% 40% Decision Tree example 60% 40% Investment= 120M Investment= 50M
- 36. By: Anand Bobade (nmbobade@gmail.com) Build / Upgrade New Plant Strong Demand Profit: 200M Week Demand Profit: 90M Upgrade plant Strong Demand Profit: 120M Week Demand Profit: 60M 11.4 Perform Quantitative Risk Analysis->T&T->QRA&MT Quantitative Risk analysis & Modeling Techniques 60% 40% Decision Tree example 60% 40% Investment= 120M Investment= 50M Net path value = -120+200 = 80M Net path value = -120+90 = -30M Net path value = -50+120 = 70M Net path value = -50+60 = 10M
- 37. By: Anand Bobade (nmbobade@gmail.com) Build / Upgrade New Plant Strong Demand Profit: 200M Week Demand Profit: 90M Upgrade plant Strong Demand Profit: 120M Week Demand Profit: 60M 11.4 Perform Quantitative Risk Analysis->T&T->QRA&MT Quantitative Risk analysis & Modeling Techniques 60% 40% Decision Tree example 60% 40% Investment= 120M Investment= 50M Net path value = -120+200 = 80M Net path value = -120+90 = -30M Net path value = -50+120 = 70M Net path value = -50+60 = 10M EMV=0.60 ($80M) +0.40(-$30) = $36M EMV =0.60 ($70M) +0.40($10) =$46M Upgrade
- 38. By: Anand Bobade (nmbobade@gmail.com) Quantitative Risk analysis & Modeling Techniques Decision Tree Benefits Simple to understand & interpret Can be combined with other techniques Can include EMV information 11.4 Perform Quantitative Risk Analysis->T&T->QRA&MT
- 39. By: Anand Bobade (nmbobade@gmail.com) Quantitative Risk analysis & Modeling Techniques Modeling & simulation: Uses model that translates specified detailed uncertainties into their potential impact on project objectives. Performed using Monte carlo technique. A project model is computed many times with input values chosen at random for each iteration. 12% chance - project will complete in 41 million 75% chance - project will complete in 50 million 11.4 Perform Quantitative Risk Analysis->T&T->QRA&MT
- 40. By: Anand Bobade (nmbobade@gmail.com) Quantitative Risk analysis & Modeling Techniques Sensitivity analysis • Impact of risk on just one project objectives • Assume, there is no impact on rest of objectives. Expected monetary value (EMV): • Identify scenario to deal with a risk • Calculate how much each paths will cost. Modeling & simulation: • Developing a model that translates uncertainties into potential impact on project objectives. (E.g., Monte carlo technique) Review 11.4 Perform Quantitative Risk Analysis->T&T->QRA&MT
- 41. By: Anand Bobade (nmbobade@gmail.com) Project Document Update 11.4 Perform Quantitative RA->Outputs
- 42. By: Anand Bobade (nmbobade@gmail.com) Project Document Update Probabilistic analysis of the Project Probability of Achieving cost & time objectives Prioritized list of Quantified Risks Trends in Quantified Risks analysis results 11.4 Perform Quantitative RA->Output->Project Doc. updates
- 43. By: Anand Bobade (nmbobade@gmail.com) 11.4 Perform Quantitative Risk Analysis- > Process Flow
- 44. By: Anand Bobade (nmbobade@gmail.com) By: Anand Bobade (nmbobade@gmail.com)
- 45. By: Anand Bobade (nmbobade@gmail.com) Introduction – Risk Management Processes 11.1 Plan Risk Management • Define how to conduct risk management activities 11.2 Identify Risks • Determine & document which risks may affect the project 11.3 Perform Qualitative Risk Analysis • Prioritize risks by analyzing their probability & impact.
- 46. By: Anand Bobade (nmbobade@gmail.com) Introduction – Risk Management Processes 11.4 Perform Quantitative Risk Analysis • Numerically analyze the effect of identified risks. 11.5 Plan Risk Responses • How to respond to enhance opportunities & to reduce threats 11.6 Control Risk • Track risk, monitor residual risks, identify new risks, & evaluate effectiveness of risk planning.
- 47. By: Anand Bobade (nmbobade@gmail.com) Process of developing options & actions to enhance opportunities & to reduce threats to project objectives. It addresses the risks by their priority by updating budget, schedule & PMP as needed. 11.5 Plan Risk Responses -> Definition
- 48. By: Anand Bobade (nmbobade@gmail.com) Plan what to do about identified risks. Document individual plans. Assign risk Owner. Keep risk response appropriate based on the importance & significance of the risk. Minimize negative risks. Enhance positive risks. Negative Risk response Avoid Transfer Mitigate Accept Positive Risk response Exploit Enhance Share Accept 11.5 Plan Risk Responses -> Introduction
- 49. By: Anand Bobade (nmbobade@gmail.com) Inputs (2) • Risk management plan • Risk register Tools & Techniques(4) • Strategies for negative risks or threats • Strategies for positive risks or opportunities • Contingent response strategies • Expert judgment Outputs (2) • PMP update • Project document updates By: Anand Bobade (nmbobade@gmail.com) 11.5 Plan Risk Responses->ITTO
- 50. By: Anand Bobade (nmbobade@gmail.com) Risk Management Plan Risk Register 11.5 Plan Risk Responses->Inputs
- 51. By: Anand Bobade (nmbobade@gmail.com) Risk Management Plan Defines projects Risk Management Roadmap Proposed processes & Methods Resource, Schedule & Budget requirements Stakeholder - Roles & Responsibilities Risk Categorization 11.5 Plan Risk Responses->Inputs-> RMP
- 52. By: Anand Bobade (nmbobade@gmail.com) Risk Register All identified risks Root causes Potential Response Risk Owners Risk Categories Risk Ratings Risk with near-term response Trends in qualitative Risk analysis 11.5 Plan Risk Responses->Inputs->Risk Register
- 53. By: Anand Bobade (nmbobade@gmail.com) Strategies for Negative Risks or Threats Strategies for Positive Risk or Opportunities Contingent Response Strategies Expert Judgment 11.5 Plan Risk Responses->T&T
- 54. By: Anand Bobade (nmbobade@gmail.com) Strategies for Negative Risks or Threats Mitigate Transfer Avoid Accept Strategy to manage each Risk should be unique It should match Risk’s probability & overall impact on the project objectives It helps to manage Negative impact on Project Objectives: 11.5 Plan Risk Responses->T&T->Strategies for NR or Threats To deal with High Risks To deal with low Risks
- 55. By: Anand Bobade (nmbobade@gmail.com) Strategies for Negative Risks or Threats Mitigate • Reduce impact or probability of risk to an acceptable threshold • Take early actions to reduce impact/probability Project Staging More testing Prototyping Redundancy planning Use more qualified resources 11.5 Plan Risk Responses->T&T->Strategies for NR or Threats Examples:
- 56. By: Anand Bobade (nmbobade@gmail.com) Strategies for Negative Risks or Threats Transfer • Shift responsibility of risk consequence to another party. Does NOT eliminate risk. • Effective in dealing with financial exposure Buy/subcontract: move liabilities Selecting type of Procurement contracts: Fixed Price Insurance: liabilities + bonds + Warranties 11.5 Plan Risk Responses->T&T->Strategies for NR or Threats
- 57. By: Anand Bobade (nmbobade@gmail.com) Strategies for Negative Risks or Threats Avoid: • Changing the plan to eliminate a risk by avoiding the cause/source of risk • Protect project from impact of risk Change the implementation strategy In-house development (no subcontracting) Reduce scope to avoid high risk deliverables Clarify requirement Improve communication Acquiring expertise Examples: 11.5 Plan Risk Responses->T&T->Strategies for NR or Threats
- 58. By: Anand Bobade (nmbobade@gmail.com) Examples: Strategies for Negative Risks or Threats Accept: • Risk is acknowledged, response is planned • No action taken unless Risk occurs 11.5 Plan Risk Responses->T&T->Strategies for NR or Threats Commonly used - Contingency allowance/ reserve Established amount of reserve (time, money) Amount is decided based on probability & impact Active Acceptance - Develop a contingency plan to execute if the risk occur. Passive Acceptance - Deal with the risks as they occur (No Plan B prepared)
- 59. By: Anand Bobade (nmbobade@gmail.com) Strategies for Positive Risk or Opportunities Exploit Enhance Share Accept PM will seek ways to make positive risks or opportunities more likely to occur: 11.5 Plan Risk Responses->T&T->Strategies for PR or Oppor.
- 60. By: Anand Bobade (nmbobade@gmail.com) Strategies for Positive Risk or Opportunities Exploit: • Ensure opportunity is realized. • You do not try, but work hard & ensure opportunity is 100% realized. Example: Using new technology may result in saving 50% of the development leading organization to complete another initiative. To exploit: Staff will be trained on technology & relevant technology expert will be hired. 11.5 Plan Risk Responses->T&T->Strategies for PR or Oppor.
- 61. By: Anand Bobade (nmbobade@gmail.com) Strategies for Positive Risk or Opportunities Enhance • Increase chances of opportunity occurring. • Take proactive action to enhance opportunity. Example: Using new technology may result in saving 50% of the development leading organization to complete another initiative. To Enhance: PM will monitor work closely, Compress schedule by adding resources & doing parallel work etc. 11.5 Plan Risk Responses->T&T->Strategies for PR or Oppor.
- 62. By: Anand Bobade (nmbobade@gmail.com) Strategies for Positive Risk or Opportunities Share: • Not capable of realizing opportunity on your own. • Work with other parties to share Benefits Example: Lack of technical capability is not allowing you to bid for a contract, and you want to realize this opportunity. To Enhance: You will team up with other company expert in technology to apply for contract. 11.5 Plan Risk Responses->T&T->Strategies for PR or Oppor.
- 63. By: Anand Bobade (nmbobade@gmail.com) Strategies for Positive Risk or Opportunities Accept • Willing to take advantage of opportunity if it comes, but not actively pursuing it. 11.5 Plan Risk Responses->T&T->Strategies for PR or Oppor.
- 64. By: Anand Bobade (nmbobade@gmail.com) Contingent Response Strategies Reponses plans to the Risk occurrence. Plan that deals with events that may or may not occur. This is Risk response plan. Contingency plans Plan that gets Implemented when the contingency plan fails or is not fully effective. Fall back plans: 11.5 Plan Risk Responses->T&T->Contingent Response Strat.
- 65. By: Anand Bobade (nmbobade@gmail.com) Contingent Response Strategies Contingency plans: • Plan that deals with events that may or may not occur. Construction project Risk: There is a risk that rain may fall, which will damage your materials lying in the open. Plan: If there is an indication of rain, all materials will be covered with a plastic sheet. Also, after rain, you will bring a blower/vacuum pump to clean & dry wet materials. 11.5 Plan Risk Responses->T&T->Contingent Response Strat.
- 66. By: Anand Bobade (nmbobade@gmail.com) Contingent Response Strategies Fallback plan: • Plan that gets Implemented when the contingency plan fails or is not fully effective. Construction project Risk: There is a risk that rain may fall, which will damage your materials lying in the open. Suppose rain continued for a long time than anticipated, leading material to be useless. Plan B: If material is useless, you will reorder them from a pre- identified supplier & start the work immediately. 11.5 Plan Risk Responses->T&T->Contingent Response Strat.
- 67. By: Anand Bobade (nmbobade@gmail.com) Contingent Response Strategies Risk triggers: • These are indications that a risk has occurred or is about to occur. • Also, called as warning signs or risk symptoms • Engage your Legal team to monitor the status of this regulation. Inform PM is change happens. Risk: Change in government regulation • Establish monitoring mechanism for CPU & disk usage. Inform PM if limit is reached. Risk: Server capacity is insufficient to meet peak demand Events that trigger the response should be documented & tracked. 11.5 Plan Risk Responses->T&T->Contingent Response Strat.
- 68. By: Anand Bobade (nmbobade@gmail.com) Contingent Response Strategies Assigned the responsibility of ensuring that risk response is effective. Also, he may Plan additional risk response if required Risk Owner Risk owner depute a risk action owner in very large project where it will be difficult for risk owner to manage all risk on its own. Risk Action Owner 11.5 Plan Risk Responses->T&T->Contingent Response Strat.
- 69. By: Anand Bobade (nmbobade@gmail.com) Expert Judgment Input from knowledgeable parties Expertise can be provided by individual or groups Based on specialized education, knowledge, skills, experience or training 11.5 Plan Risk Responses->T&T->Expert Judgement
- 70. By: Anand Bobade (nmbobade@gmail.com) 11.5 Plan Risk Responses->Outputs PMP update Project Documents Updates
- 71. By: Anand Bobade (nmbobade@gmail.com) Following Plans may get updated: Schedule Management Plan Cost Management Plan Quality Management Plan Procurement Management Plan HR management Plan Scope Baseline Schedule Baseline Cost Baseline PMP update 11.5 Plan Risk Responses->Outputs->PMP update
- 72. By: Anand Bobade (nmbobade@gmail.com) Project Documents Updates Risk Register Assumptions log updates Technical Documentation Updates Change Requests Project document Updates Risk Register Updates: Risk Owner & responsibiliti es Agreed Response strategy Budge & schedule activities Trigger conditions Residual Risks Secondary Risks Contingency plans & Triggers Contingency reserves 11.5 Plan Risk Responses->Outputs->Proj. doc. updates
- 73. By: Anand Bobade (nmbobade@gmail.com) 11.5 Plan Risk Responses-> Process Flow
- 74. By: Anand Bobade (nmbobade@gmail.com)
- 75. By: Anand Bobade (nmbobade@gmail.com) Definition Controlling Risk Control Risk: ITTO Summary Guidelines for exam questions Learning Objectives – 11.6 Control Risk
- 76. By: Anand Bobade (nmbobade@gmail.com) Introduction – Risk Management Processes 11.1 Plan Risk Management • Define how to conduct risk management activities 11.2 Identify Risks • Determine & document which risks may affect the project 11.3 Perform Qualitative Risk Analysis • Prioritize risks by analyzing their probability & impact.
- 77. By: Anand Bobade (nmbobade@gmail.com) Introduction – Risk Management Processes 11.4 Perform Quantitative Risk Analysis • Numerically analyze the effect of identified risks. 11.5 Plan Risk Responses • How to respond to enhance opportunities & to reduce threats 11.6 Control Risk • Track risk, monitor residual risks, identify new risks, & evaluate effectiveness of risk planning.
- 78. By: Anand Bobade (nmbobade@gmail.com) Implementing risk response plans, tracking identified risks, monitoring residual risks, identifying new risks, & evaluating risk process effectiveness throughout the project. It improves efficiency of risk approach & continuously optimize risk responses. Risk Response Plans Tracking identified risks Monitoring residual risks Identifying new risks Implementing 11.6 Control Risks -> Definition
- 79. By: Anand Bobade (nmbobade@gmail.com) Identify Analyze Plan Monitor Key Activities Triggers Residuals Risk Secondary Risks Risk Effectiveness Other activities - Monitoring 11.6 Control Risks -> Introduction
- 80. By: Anand Bobade (nmbobade@gmail.com) Perform Variance & Trend analysis using performance information This process is not about managing or responding to risks. So, do nothing about the Risk. Determine If project assumptions are still valid If assessed risk has changed or can be retired If Risk management plan is followed Alignment of contingency reserves Choose alternative strategies (workarounds) Execute contingency or fallback plan Update PMP, OPA (Lesson learned) 11.6 Control Risks -> Introduction
- 81. By: Anand Bobade (nmbobade@gmail.com) Inputs (4) • Risk Management Plan • Risk register • Work Performance Data • Work Performance Reports Tools & Techniques(6) • Risk Reassessment • Risk Audits • Variance & Trend Analysis • Technical Performance Measurement • Reserve Analysis • Meetings Outputs (5) • Work Performance Information • Change Requests • PMP updates • Project Documents Updates • OPA updates By: Anand Bobade (nmbobade@gmail.com) 11.6 Control Risks->ITTO
- 82. By: Anand Bobade (nmbobade@gmail.com) Risk Management Plan Risk Register Work Performance data Work Performance reports 11.6 Control Risks->Inputs
- 83. By: Anand Bobade (nmbobade@gmail.com) Risk Re-assessment Risk Audits Variance & Trend Analysis Technical Performance Measurement Reserve Analysis Meetings 11.6 Control Risks->T&T
- 84. By: Anand Bobade (nmbobade@gmail.com) Risk Re-assessment Review Risk Register Add, Re-assess or close Risks Identify new Risks Register Risks Re-assess current Risks Close Risks 11.6 Control Risks->T&T->Risk Re-assessment & Audit
- 85. By: Anand Bobade (nmbobade@gmail.com) Risk Audits Examine & Document the effectiveness of Risk Response Ensure effectiveness of risk management process Focus is on Risk response & overall Risk Management 11.6 Control Risks->T&T->Risk Re-assessment & Audit
- 86. By: Anand Bobade (nmbobade@gmail.com) Review project execution trends using performance information Trend analysis (e.g., EVM) used for monitoring overall performance Analyzed outcome may forecast potential deviation Performance Data Baseline Variance & Trend Analysis 11.6 Control Risks->T&T->Variance & Trend Analysis
- 87. By: Anand Bobade (nmbobade@gmail.com) Reserve Analysis 11.6 Control Risks->T&T-> Reserve Analysis Planned Reserves Actual used reserves
- 88. By: Anand Bobade (nmbobade@gmail.com) Technical Performance Measurement Compare technical accomplishments of project milestones to technical milestones as per the project plan. (Trend analysis using run charts) To use this technique, we must have quantifiable objectives that can be measured on a technical level. If deviations are identified, they are documented & Risk Management team could suggest corrective actions. 11.6 Control Risks->T&T->Technical Perf. Measurement Q1 Q2 Q3 Design Build - Prototype Prototype Demo to Client Project Milestone Technical Milestone Technical Milestone
- 89. By: Anand Bobade (nmbobade@gmail.com) Work Performance Information Change Requests PMP Updates Project Documents Updates OPA Updates 11.6 Control Risks->Outputs
- 90. By: Anand Bobade (nmbobade@gmail.com) Work Performance Information Provide mechanism to communicate & support project decision making. 11.6 Control Risks->Outputs-> WPI
- 91. By: Anand Bobade (nmbobade@gmail.com) 11.6 Control Risks->Outputs->CR Change Requests Implementing contingency plan or workarounds sometime results in CR. • Recommended Corrective actions • Recommended preventive actions
- 92. By: Anand Bobade (nmbobade@gmail.com) Project Documents Updates Update Risk Register: Risk assessment Risk audit Periodic risk reviews Risk Response 11.6 Control Risks->Outputs->PDU
- 93. By: Anand Bobade (nmbobade@gmail.com) OPA Updates Template for Risk Management plan RBS Risk Categories Lesson Learned 11.6 Control Risks->Outputs->OPA
- 94. By: Anand Bobade (nmbobade@gmail.com) 11.6 Control Risks-> Miscellaneous Unplanned response (workaround): • It is a response to a threat that has occurred, for which a prior response had not been planned or was not effective.
- 95. By: Anand Bobade (nmbobade@gmail.com) 11.6 Control Risks-> Process Flow
- 96. By: Anand Bobade (nmbobade@gmail.com)
- 97. By: Anand Bobade (nmbobade@gmail.com) Thank You!! Visit Slide Share website & you will find other Knowledge area presentation… Please share!!