Marketing Management, business presentations

100 Marketing Management models and diagrams for your powerful business presentations. Content: Powerpoint, presentations, business, slides, diagrams, charts, Market Structure, Market Forces, Marketing Concepts, Customer Added Value, Relationship Marketing, Profitability Analysis, Stakeholder Analysis, Threat Matrix, Value Creation, Marketing Mix, Hierarchy of Needs, Demand Measurement, Market Definition, Segment Rivalry, Target Market, Product Development, Demand-Life-Cycle, Market-Space Diagram, Marketing Strategies, Market Entry, Promotions, Marketing Communication, Service Quality Model, 3 C’s Model, Hybrid Grid, Distribution Management, Consumer Brands, Control Chart Model, Multichannel Marketing, Demand Elasticity, Strategic Planning Gap, AIDA Model Download these diagrams on http://www.drawpack.com (try our free membership offer)

Recommended
Recommended
More Related Content
More from http://www.drawpack.com
More from http://www.drawpack.com (20)
Recently uploaded
Recently uploaded (20)
Marketing Management, business presentations
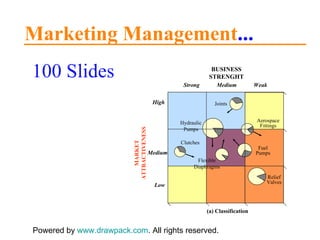
- 1. Marketing Management ... 100 Slides Powered by www.drawpack.com . All rights reserved. MARKET ATTRACTIVENESS Medium Weak Strong Joints Hydraulic Pumps Clutches BUSINESS STRENGHT Low Medium High (a) Classification Aerospace Fittings Relief Valves Fuel Pumps Flexible Diaphragms
- 2. Key Words ... Market Structure – Market Forces – Marketing Concepts – Customer Added Value – Relationship Marketing – Profitability Analysis – Stakeholder Analysis – Threat Matrix – Value Creation – Marketing Mix – Hierarchy of Needs – Demand Measurement – Market Definition – Segment Rivalry – Target Market – Product Development – Demand-Life-Cycle – Market-Space Diagram – Marketing Strategies – Market Entry – Promotions – Marketing Communication – Service Quality Model – 3 C’s Model – Hybrid Grid – Distribution Management – Consumer Brands – Control Chart Model – Multichannel Marketing – Demand Elasticity – Strategic Planning Gap – AIDA Model
- 3. Markets and Structure of Flow Government markets Middlemen markets Resource markets Manufacturer markets Services, money Resources Money Taxes, goods Goods and services Services, money Taxes, goods Money Consumer markets Services Resources Money Taxes Money Goods and services Taxes, goods Services, money
- 4. Main Actors and Forces in the Market Environment End user market Marketing intermediaries Competitors Company (marketer) Suppliers
- 5. The Selling and Marketing Concepts Factory Selling and promoting Products Profits through sales volume Target market Coordinated marketing Customer needs Profits through customer satisfaction (b) The marketing concept (a) The selling concept Starting point Means Ends Focus
- 6. The Chart Company Organization Customers Top management Customers Middle management Front-line people Customers
- 7. Marketing`s Role in the Company (a) Marketing as an equal function Personnel Finance Production Marketing (b) Marketing as a more important function Marketing Production Finance Personnel (d) The customer as the controlling function Customer Production Finance Personnel Marketing (e) The customer as the controlling function and marketing as the integrative function Customer Personnel Marketing Finance Production (c) Marketing as the major function Marketing Production Personnel Finance
- 8. Determinants of Customer Added Value Product value Services value Personnel value Image value Time cost Psychic cost Energy cost Monetary price Total customer value Total customer cost Customer delivered value
- 9. The Generic Value Chain Inbound logistics Outbound logistics Operations Marketing and sales Service Primary Activities Procurement Technology development Human resources management Firm infrastructure Margin Margin
- 10. Levels of Relationship Marketing HIGH MARGIN HIGH MARGIN MEDIUM MARGIN Many customers / distributors Medium number of customers / distributors Few customers / distributors Accountable Proactive Partnership Accountable Reactive Proactive Basic or reactive Accountable Reactive
- 11. Customer/Product Profitability Analysis Highly profitable product Profitable product Losing product Mixed-bag product Losing customer Mixed-bag customer + High profit customer _ _ _ + + + + + P 4 C 2 C 1 P 1 P 3 C 3 P 2 Products Customers
- 12. The Strategic Planning, Implementation and Control Process Corporate planning Division planning Business planning Product planning Measuring results Diagnosing results Taking corrective action Planning Controlling Implementing Organizing Implementing
- 13. Relationships Among Stakeholders Stockholder satisfaction Profits Growth Customer satisfaction Higher-quality products and services Continuous improvements Breakthrough innovations Higher-quality environment (employee satisfaction)
- 14. The BCG Growth-Share Matrix 7 3 2 1 4 8 6 Market Growth Rate Relative Market Share Dogs Stars Question Marks Cash Cows 0.3 x 0.1 x 0.2 x 0.5 x 1 x 10 x 2 x 1.5 x 0.4 x 4 x 2% 8% 6% 4% 12% 10% 20% 18% 16% 14% 22% 5
- 15. Market Attractiveness – Portfolio Classification and Strategies I MARKET ATTRACTIVENESS Medium Weak 5.00 3.67 2.33 1.00 Strong Joints Hydraulic Pumps Clutches BUSINESS STRENGHT Low Medium High (a) Classification Aerospace Fittings Relief Valves Fuel Pumps Flexible Diaphragms 2.33 3.67 5.00 1.00 Invest / grow Harvest / divest Selectivity / earnings
- 17. The Strategic-Planning Gap Diversification growth Integrative growth Intensive growth 0 5 10 Sales Projected sales Strategic-planning gap Desired sales Time (years)
- 18. Ansoff‘s Product/Market Expansion Grid Market penetration strategy Current Markets New Products Current Products New Markets Product development strategy Market development strategy Diversification strategy
- 19. The Business Strategic-Planning Process Business mission Goal formulation Implementation Program formulation Strategy formulation Feedback and control External environment analysis Internal environment analysis
- 22. McKinsey 7-S Framework Structure Style Strategy Systems Skills Staff Shared values
- 23. Two Views of Creating Value (b) The Value Creation and Delivery Sequence Customer segmentation Market selection / focus Salesforce Product develop- ment Value positioning Sourcing Pricing Sales promotion Distributing Advertising Provide the Value Communicate the Value Service develop- ment Choose the Value Servicing Making (a) Traditional Physical Process Sequence Design product Distribute Make Procure Price Service Sell the Product Make the Product Advertise / promote Sell
- 24. The Product-Positioning Map High quality High price Low quality Low price C D E A B
- 25. The Four P‘s of the Marketing Mix Low quality Target Market Product variety Quality Design Features Brand name Packaging Sizes Services Warranties Returns Product Channels Coverage Assortments Locations Inventory Transport Promotion Sales promotion Advertising Salesforce Public relations Direct marketing Place Price List price Discounts Allowances Payment period Credit terms Marketing Mix
- 26. Marketing-Mix Strategy Target customers Distribution channels Sales promotion Advertising Public relations Direct mail and telemarketing Salesforce Company Products Services Prices Offer Mix Promotion Mix
- 27. Factors Influencing Marketing Strategy Technological / physical environment Marketing Intermediaries Demographic/ economic environment Socio/ cultural environment Political / legal environment Competitors Suppliers Publics Price Place Product Promotion Marketing information system Marketing organization and implementation system Marketing planning system Marketing control system Target customers
- 28. The Marketing Information System Internal records Marketing decision support analysis Distributing information Marketing Environment Target markets Marketing channels Competitors Publics Macroenviron-ment forces Assessing information needs Marketing Managers Analysis Planning Implemen-tation Control Developing Information Marketing decisions and communication Marketing Information System Marketing intelligence Marketing research
- 29. Model of Buyer Behavior Marketing stimuli Product Price Place Promotion Other stimuli Economic Technological Political Cultural Cultural Social Personal Psychological Problem recognition Information search Evaluation Postpurchase behavior Buyer’s decisions Product choice Brand choice Dealer choice Purchase timing Purchase amount Buyer’s decisions process Buyer’s characteristics
- 30. Model of Factors Influencing Behavior Cultural Culture Subculture Social class Cultural Reference groups Family Roles and statuses Age and life- cycle stage Occupation Economic circumstances Lifestyle Personality and self-concept Personal Psychological Motivation Perception Learning Beliefs and attitudes BUYER
- 31. Maslow‘s Hierarchy of Needs Esteem Needs (self-esteem, recognition, status) Self-Actualization Needs (self-development and realization) Social Needs (sense of belonging, love) Safety Needs (security, protection) Physiological Needs (hunger, thirst)
- 32. How Customers Handle Dissatisfaction Seek redress directly from business firms Warn friends about the product and/or seller Decide to stop buying product or brand or boycott seller Complain to business, private, or governmental agencies Take legal action to obtain redress Take some form of private action Take some form of public action Dissatisfaction occurs Take no action Take some action
- 33. Customers‘ Use or Dispose of Product To be (re)sold Direct to consumer To be used Through middleman To middleman Give it away Throw it away Sell it Trade it Rent it Loan it Use it to serve original purpose Convert it to serve a new purpose Store it Get rid of it temporarily Keep it Get rid of it permanently Product
- 34. Model of Industrial Organization Analysis Basic Conditions Supply Raw materials Technology Unionization Product durability Value weight Business attitudes Public policies Demand Price elasticity Substitutes Rate of growth Cyclical and seasonal character Purchase method Marketing type Industry structure Number of sellers Product differentiation Entry and mobility barriers Exit and shrinkage barriers Cost structures Vertical integration Global reach Conduct Pricing behavior Product strategy and advertising Research and innovation Plant investment Legal tactics Performance Production and allocative efficiency Technological progress Profitability Employment
- 35. Shifting Company Orientations Customer Centered No Product orientation Competitor orientation Market orientation Customer orientation No Yes Yes Competitor Centered
- 36. 90 Types of Demand Measurement (6 x 5 x 3) Time Level Short-range Long-range Medium-range Product item Product form Product line Company sales Industry sales All sales Product Level Customer Territory Region U.S.A. World Space Level
- 37. Levels of Market Definition Total population Potential market (a) Total market (b) Potential market Served market Qualified available market Penetrated market Available market Potential market 10% 100% 40% 100% 10% 5% 20%
- 39. Different Segmentation of a Market (a) No market segmentation (b) Complete segmentation (e) Market segmentation by income-age class (d) Market segmentation by age classes A and B (c) Market segmentation by income classes 1, 2, and 3 1 1 1 2 3 3 A A B B B A 1A 1A 1B 2B 3B 3A
- 40. Basic Market-Preference Patterns Sweetness (a) Homogeneous preferences Sweetness (b) Diffused preferences Sweetness (c) Clustered preferences Creaminess Creaminess Creaminess
- 41. Five Forces Determining Segment Structural Attractiveness Potential Entrants (Threat of mobility) Industry Competitors (Segment rivalry) Buyers (Buyer power) Suppliers (Supplier power) Substitutes (Threat of substitutes)
- 42. Barriers of Profitability Exit Barriers Low Low, stable returns High, stable returns High, risky returns Low, risky returns Low High High Entry Barriers
- 43. Five Patterns of Target Market Selection M=Market) (P=Product / Full coverage M 1 M 1 M 1 P 1 P 2 P 3 Product specialization M 1 M 1 M 1 P 1 P 2 P 3 Single-segment concentration M 1 M 1 M 1 P 1 P 2 P 3 Market specialization M 1 M 1 M 1 P 1 P 2 P 3 Selective specialization M 1 M 1 M 1 P 1 P 2 P 3
- 44. Three Alternative Market Selection Strategies Company Marketing Mix Market (a) Undifferentiated marketing Segment 1 Segment 2 Segment 3 (c) Concentrated marketing Company marketing mix (b) Differentiated marketing Company marketing mix 1 Company marketing mix 2 Company marketing mix 3 Segment 1 Segment 3 Segment 2
- 45. Segments and Supersegments Products Products (a) Segments (b) Supersegments Customer Groups Customer Groups 1 2 5 11 10 6 7 8 4 3 9 12 1 2, 3 5, 6, 7 4, 8 9, 10, 11, 12
- 46. The New BCG Matrix Size of the advantage Many Fragmented Stalemate Volume Specialization Small Large Few Number of approaches to achieve advantage
- 47. Brand-Quality Strategies and Profitability (Profitability ROI) Quality Level Low Average Superior Quality improvement Time Quality Level Average Superior Low High Quality maintenance Quality adulteration A) Relationship between product quality and profitability (return on investment – ROI) B) Three strategies for managing product quality through time
- 48. Evaluating a Market Opportunity Yes Yes Yes Can it be obtained at a reasonable cost? Can it be obtained at a reasonable cost? Can it be obtained at a reasonable cost? Reject the market opportunity Yes Yes Yes Yes Yes Yes Profit objective Sales volume objective Sales growth objective Move to next stage Does company have the necessary capital? Does company have the necessary production and marketing know-how? Does company have the necessary distribution capability? Customer goodwill objective No No No No No No No No No No Yes Is the market opportunity compatible with company objectives? Is the market opportunity compatible with company resources?
- 51. Adopter Categorization on the Basis of Relative Time of Adoption of Innovation Time of adoption of innovations 2 1/2 % Innovators 16% Laggards 13 1/2 % Early adopters 34% Early majority 34% Late majority X - 2 X X - X +
- 52. Demand-Technology-Product Life Cycles Time (a) Sales Demand life-cycle Demand technology cycles G 1 E D M G 2 T 2 T 1 Sales Time (b) Demand life-cycle Demand technology cycle Product life cycle P 3 P 1 P 2 P 4
- 53. Sales and Profit Life Cycles Sales and Profits Time Profit Sales Maturity Growth Introduction Decline
- 54. Four Marketing Strategies Price Promotion High Rapid-skimming strategy Rapid-penetration strategy Slow-penetration strategy Slow-skimming strategy High Low Low
- 55. Stages of the Competitive Cycle Commodity Competition Share Stability Competitive Penetration Withdrawal Sole Supplier 100% Capacity share Market share Production costs Price premium
- 56. Companies in a Mature Industry Customizer Product specialist Market specialist Quality leader Service leader Cost leader Volume leaders Market Nichers
- 59. Hypothetical Market Structure 40% 30% 20% 10% Market Leader Market Nichers Market Follower Market Challenger
- 60. Defense Strategies (2) Flanking defense ATTACKER DEFENDER (1) Position defense (3) Preemptive defense (4) Counteroffensive defense (6) Contraction defense (5) Mobile defense
- 61. Market Share and Profitability % Profitability Average Sales (constant $000) International Harvester Hesston Deere Steiger 2 8 6 4 12 16 0 14 1,000 5,000 3,000 Massey Ferguson J.I. Case Sperry-New Holland Allis-Chalmers 10 (a) Linear relationship according to PIM studies (b) V-shaped relationship Market Share Profitability 20 10 % 30 14.1 17.6 23.4 30.0 9.1 0 Under 10 10-20 30-40 20-30 Over 40 %
- 62. Attack Strategies ATTACKER DEFENDER (1) Frontal attack (3) Encirclement attack (2) Flanking attack (4) Bypass attack
- 63. Major Decisions in International Marketing Deciding which markets to enter Deciding how to enter the market Deciding whether to go abroad Deciding on the marketing organization Deciding on the marketing program
- 64. Evaluating Which Markets to Enter L H Poland Romania Eastern Germany Czechoslovakia China Competitive Advantage Market Attractiveness H L M M L H Risk Medium High Low
- 65. Five Modes of Entry into Foreign Markets Direct exporting Licensing Indirect exporting Direct investments Joint venture Amount of commitment, risk, control, and profit potential
- 67. Whole-Channel Concept Seller’s international marketing headquarters Channels between nations Seller Final buyers Channels within foreign nations
- 68. Five Product Levels Generic product Expected product Augmented product Potential product Core benefit
- 69. Overview of Branding Decisions Branding Decision Brand-Name Decision Brand-Sponsor Decision What branding strategies should be used? New brands Brand extensions Line extensions Should a brand be developed for the product? Brand No brand Individual brand names Blanket family name Separate family name Company / individual names Manufacturer’s brand Private brand Mixed brands What names should be put on the products? Who should sponsor the brand? Should the brand be repositioned? Brand repositioning No brand repositioning Brand-Repositioning Decision Brand-Strategy Decision
- 70. Four Brand Strategies Product Category Existing Line extension Multibrands New brands Brand extension Existing New New Brand Name
- 71. Elements in a Service Encounter Customer A The Service Business as a System Other customers Service X Other services Advertising Billing and payment Sales calls Media stories Word-of-mouth comments Random exposures to personnel and facilities Market research studies Contact personnel Physical environment Internal organizational system Visible to customer Not visible to customer Service Business Secondary interactions Direct interactions
- 72. Three Types of Marketing in Service Industries Employees Customers Company Interactive Marketing Internal Marketing External Marketing
- 73. Evaluation for Different Types of Products Difficult to evaluate Clothing Furniture Jewelry Restaurant meals Houses Vacation Auto repair Haircuts Television repair Child care Root canal Legal services Automobiles Medical diagnosis Easy to evaluate High in search qualities High in credence qualities High in experience qualities Most goods Most services
- 74. Service-Quality Model Word of Mouth Communications Personal Needs Past Experience Expected Service Perceived Service Service Delivery (including pre- and postcontacts) Translation of Perceptions into Service Quality Specs. Management Perceptions of Consumer Expectations External Communications to Consumers GAP 4 Marketer Consumer GAP 2 GAP 3 GAP 5 GAP 1
- 76. Price, Revenue, Market Share, and Profits Apex Price (dollar / unit) Primary tradeoff range Pretax profit Market share Revenue 85 95 90 105 100 110 80 (%) ($M) ($M) Share Revenue Profit 65 70 60 80 75 10 16 14 12 20 18 40 70 60 50 90 80
- 77. Inelastic and Elastic Demand Price Quantity Demanded per Period (a) Inelastic demand Quantity Demanded per Period (b) Elastic demand P 1 P’ 1 P’ 2 Q’ 2 Q 2 Q’ 1 Q 1 P 2
- 78. The Three Cs Model for Price Setting Costs Competitors’ prices and prices of substitutes Customers’ assessment of unique product features Low Price No possible profit at this price No possible demand at this price High Price
- 79. Break-Even Chart Sales Volume in Units (in thousands) Total cost Total revenue Target profit Fixed cost Dollars (in thousands) 10 30 20 50 40 0 200 800 600 400 1200 1000
- 81. Consumer and Industrial Marketing Channels (a) Consumer marketing channels Manufacturer Consumer Jobber Retailer Retailer Retailer Wholesaler Wholesaler (b) Industrial marketing channels Manufacturer Industrial customer Manufacturer’s representative Manufacturer’s sales branch Industrial distributors
- 82. The Hybrid Grid BIG CUSTOMERS MIDSIZE CUSTOMERS SMALL CUSTOMERS AND NONCUSTOMERS Marketing Channels and Methods V E N D O R C U S T O M E R Lead Generation Account Management Qualifying Sales Postsales Service Close of Sales Presales Demand-Generation Tasks National Account Management Direct Sales Telemarketing Retail Stores Distributors Direct Mail Dealers and Value-Added Resellers
- 83. The Downside of Multichannel Marketing Cost Agent Cost using salesforce only Dealer National accounts Field salesforce Telemarketing Cost using different sales channels Customer Size Medium Small, Urban Very Large Large Small, Rural A B
- 84. Nature of Physical Distribution Procurement Manufacturing Physical distribution Channels Suppliers Customers
- 85. Optimal Order Quantity Order Quantity Order-processing cost per unit Total cost per unit Inventory carrying cost per unit Cost per Unit Q *
- 86. Response Hierarchy Models Models Liking Preference Conviction “ Hierarchy-of-Effects” Model Exposure “ Innovation-Adoption” Model Interest Awareness “ Communication” Model Cognitive stage Attention Interest Action Awareness Desire Purchase Affective stage Behavior stage Trial Adoption Knowledge “ AIDA” Model Reception Cognitive response Evaluation Behavior Intention Attitude Stages
- 87. Promotional Tools in Consumer vs. Industrial Markets Relative Importance Consumer Goods Advertising Public relations Sales promotion Personal selling Relative Importance Industrial Goods Personal selling Public relations Sales promotion Advertising
- 88. Push vs. Pull Strategy Push Strategy Manufacturer Intermediaries Demand Marketing activities Demand End users Pull Strategy Manufacturer Intermediaries Demand Marketing activities Demand End users
- 89. Cost Effectiveness of Different Promotional Tools Promotional Cost Effectiveness Awareness Comprehension Ordering Conviction Stages of Buyer Readiness Reordering Advertising and publicity Personal selling Sales promotion
- 90. Current Consumer States for Two Brands Total Brand Trial Awareness Brand A Satisfaction 80% aware 100% market 20% not aware 40% did not try 60% tried 80% disappointed 20% satisfied Total Brand Trial Awareness Brand B Satisfaction 40% aware 100% market 60% not aware 70% did not try 30% tried 20% disappointed 80% satisfied
- 91. Major Decisions in Advertising Management Message generation Message evaluation and selection Message execution Message decision Reach, frequency, impact major media types, specific media vehicles, media timing Media decision Communication impact Sales impact Advertising evaluation Communication objectives Sales objectives Objectives setting Affordable approach Percent of sales Competitive parity Objectives and task Budget decisions
- 92. Classification of Advertising Timing Patterns Level Rising Alternating Falling Intermittent Continuous Concentrated (1) (3) (2) (4) (6) (5) (7) (9) (8) (11) (10) (12) Number of messages per month Month
- 93. Steps in Designing and Managing the Salesforce Salesmanship training Relationship building skills Negotiation skills Improving salesforce effectiveness Recruiting and selecting sales representa-tives Motivating sales representa-tives Directing sales representa-tives Training sales representa-tives Evaluating sales representa-tives Managing the salesforce Salesforce objectives Salesforce size Salesforce structure Salesforce strategy Salesforce compensation Designing the salesforce
- 94. Major Steps in Effective Selling Prospecting and qualifying Preapproach Approach Closing Overcoming objections Presentation and demonstration Follow-up and maintenance
- 95. Stages in the Evolution of the Marketing Department (a) Stage 1 President Salesforce Other marketing functions Sales VP (b) Stage 2 President Salesforce Marketing Director Other marketing functions Sales VP (c) Stage 3 President Salesforce Other marketing functions Marketing VP Sales VP (d) Stages 4 and 5 Salesforce Other marketing functions Marketing VP Sales VP Executive VP of Marketing and Sales President
- 96. Functional Organization Marketing vice-president Marketing administration manager Advertising and sales promotion manager Sales manager Marketing research manager New products manager
- 97. The Product Manager‘s Interactions Manufacturing and distribution Media Promotion services Packaging Purchasing Publicity Salesforce Market research Research and development Legal Fiscal Advertising agency Product manager Agency media dept, Company media dept. Media sales reps Premium suppliers Premium screening Store testing Sampling Couponing Suppliers Research suppliers Trade Suppliers Designers Researchers Suppliers Trade
- 98. Three Types of Product Teams (a) Vertical product team PM PA APM (b) Triangular product team R C PM (c) Horizontal product team E F D S C R PM PM = product manager, APM = associate product manager, PA = product assistant, R = market researcher, C = communication specialist, S = sales manager, D = distribution specialist, F = finance / accounting specialist, E = engineer
- 99. The Control-Chart Model Time Period Advertising Expense / Sales Ratio 12 8 14 1 2 4 3 5 6 7 8 9 10 11 12 13 14 15 Lower control limit Upper control limit Desired level 10 6
- 100. Financial Model of Return on Net Worth Profit margin 1.5% Asset turnover 3.2 Net profits Net sales Net sales Total assets X = 12.5% Return on net worth Net profits Net worth 2.6 Financial leverage Total assets Net worth Return on assets 4.8% Net profits Total assets =
- 101. Dynamic Interactions Between Sales Orders and Distribution Efficiency Delivery delay Sales surge Management increases sales incentives Sales fall Perceived need to improve delivery time No or late action taken to add capacity Insufficient production and distribution capacity
- 102. Major Marketing Decision Areas Posing Legal or Ethical Questions COMPETITIVE RELATIONS DECISIONS ADVERTISING DECISIONS False advertising? Deceptive advertising? Bait-and-switch advertising? Promotional allowances and services? SELLING DECISIONS Bribing? Stealing trade secrets? Disparaging customers? Misrepresenting? Disclosure of customer rights? Unfair discrimination? Product additions and deletions? Patent protection? Product quality and safety? Product warranty? Harmful products? Anticompetitive acquisition? Barriers to entry? Predatory competition? PACKAGING DECISIONS Fair packaging and labeling? Excessive cost? Scarce resource? Pollution? PRICE DECISIONS Price fixing? Resale price maintenance? Price discrimination? Deceptive pricing? CHANNEL DECISIONS Exclusive dealing? Exclusive territorial distributorships? Tying agreements? Dealers’ rights? COMPETITIVE RELATIONS DECISIONS PRODUCT DECISIONS Legal or Ethical Questions
- 103. Drawpack Diagrams Drawpack.com offers premium Business Diagrams for students and professionals around the globe for their personal use. Please enjoy these Business Diagrams. You can send these slides to your personal contacts who might be interested in Business Diagrams. For further information about our service please contact us: [email_address] Please find our membership offer on www.drawpack.com
- 104. Usage rights 1. Drawpack.com allows the customer an unlimited but not exclusive right to use the provided services, products and diagrams. 2. The services, products and diagrams that the customer has received can be copied, edited, saved and used by the customer for their personal and commercial use. 3. The customer is prohibited from providing the service, products and diagrams on professional download levels in the area of audio, video and software transmission. This includes providing the services, products and diagrams via download against payment or free of charge. The customer is prohibited providing the services, products and diagrams on internet servers or on websites with public access. 4. The customer is prohibited providing identical or similar services to those provided on www.drawpack.com with the services, products and diagrams. 5. Any infringements against the above usage rights will lead to legal action. All rights are reserved to www.drawpack.com
Editor's Notes
- Source: Marketing Management, Kotler, 1994
- Source: Marketing Management, Kotler, 1994
- Source: Marketing Management, Kotler, 1994
- Source: Marketing Management, Kotler, 1994
- Source: Marketing Management, Kotler, 1994
- Source: Marketing Management, Kotler, 1994
- Source: Marketing Management, Kotler, 1994
- Source: Marketing Management, Kotler, 1994
- Source: Marketing Management, Kotler, 1994
- Source: Marketing Management, Kotler, 1994
- Source: Marketing Management, Kotler, 1994
- Source: Marketing Management, Kotler, 1994
- Source: Marketing Management, Kotler, 1994
- Source: Marketing Management, Kotler, 1994
- Source: Marketing Management, Kotler, 1994
- Source: Marketing Management, Kotler, 1994
- Source: Marketing Management, Kotler, 1994
- Source: Marketing Management, Kotler, 1994
- Source: Marketing Management, Kotler, 1994
- Source: Marketing Management, Kotler, 1994
- Source: Marketing Management, Kotler, 1994
- Source: Marketing Management, Kotler, 1994
- Source: Marketing Management, Kotler, 1994
- Source: Marketing Management, Kotler, 1994
- Source: Marketing Management, Kotler, 1994
- Source: Marketing Management, Kotler, 1994
- Source: Marketing Management, Kotler, 1994
- Source: Marketing Management, Kotler, 1994
- Source: Marketing Management, Kotler, 1994
- Source: Marketing Management, Kotler, 1994
- Source: Marketing Management, Kotler, 1994
- Source: Marketing Management, Kotler, 1994
- Source: Marketing Management, Kotler, 1994
- Source: Marketing Management, Kotler, 1994
- Source: Marketing Management, Kotler, 1994
- Source: Marketing Management, Kotler, 1994
- Source: Marketing Management, Kotler, 1994
- Source: Marketing Management, Kotler, 1994
- Source: Marketing Management, Kotler, 1994
- Source: Marketing Management, Kotler, 1994
- Source: Marketing Management, Kotler, 1994
- Source: Marketing Management, Kotler, 1994
- Source: Marketing Management, Kotler, 1994
- Source: Marketing Management, Kotler, 1994
- Source: Marketing Management, Kotler, 1994
- Source: Marketing Management, Kotler, 1994
- Source: Marketing Management, Kotler, 1994
- Source: Marketing Management, Kotler, 1994
- Source: Marketing Management, Kotler, 1994
- Source: Marketing Management, Kotler, 1994
- Source: Marketing Management, Kotler, 1994
- Source: Marketing Management, Kotler, 1994
- Source: Marketing Management, Kotler, 1994
- Source: Marketing Management, Kotler, 1994
- Source: Marketing Management, Kotler, 1994
- Source: Marketing Management, Kotler, 1994
- Source: Marketing Management, Kotler, 1994
- Source: Marketing Management, Kotler, 1994
- Source: Marketing Management, Kotler, 1994
- Source: Marketing Management, Kotler, 1994
- Source: Marketing Management, Kotler, 1994
- Source: Marketing Management, Kotler, 1994
- Source: Marketing Management, Kotler, 1994
- Source: Marketing Management, Kotler, 1994
- Source: Marketing Management, Kotler, 1994
- Source: Marketing Management, Kotler, 1994
- Source: Marketing Management, Kotler, 1994
- Source: Marketing Management, Kotler, 1994
- Source: Marketing Management, Kotler, 1994
- Source: Marketing Management, Kotler, 1994
- Source: Marketing Management, Kotler, 1994
- Source: Marketing Management, Kotler, 1994
- Source: Marketing Management, Kotler, 1994
- Source: Marketing Management, Kotler, 1994
- Source: Marketing Management, Kotler, 1994
- Source: Marketing Management, Kotler, 1994
- Source: Marketing Management, Kotler, 1994
- Source: Marketing Management, Kotler, 1994
- Source: Marketing Management, Kotler, 1994
- Source: Marketing Management, Kotler, 1994
- Source: Marketing Management, Kotler, 1994
- Source: Marketing Management, Kotler, 1994
- Source: Marketing Management, Kotler, 1994
- Source: Marketing Management, Kotler, 1994
- Source: Marketing Management, Kotler, 1994
- Source: Marketing Management, Kotler, 1994
- Source: Marketing Management, Kotler, 1994
- Source: Marketing Management, Kotler, 1994
- Source: Marketing Management, Kotler, 1994
- Source: Marketing Management, Kotler, 1994
- Source: Marketing Management, Kotler, 1994
- Source: Marketing Management, Kotler, 1994
- Source: Marketing Management, Kotler, 1994
- Source: Marketing Management, Kotler, 1994
- Source: Marketing Management, Kotler, 1994
- Source: Marketing Management, Kotler, 1994
- Source: Marketing Management, Kotler, 1994
- Source: Marketing Management, Kotler, 1994
- Source: Marketing Management, Kotler, 1994
- Source: Marketing Management, Kotler, 1994
- Source: Marketing Management, Kotler, 1994
- Source: Marketing Management, Kotler, 1994