
Recommended
More Related Content
Viewers also liked
Viewers also liked (18)
Alfred Piggott 2012.05.31 Compressed Air Vehicle Comparison Diesel Electric Gasoline Thermal
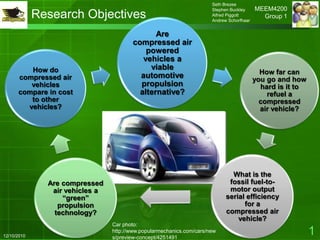
- 1. Seth Brezee Stephen Buckley MEEM4200 Research Objectives Alfred Piggott Andrew Schorfhaar Group 1 Are compressed air powered vehicles a How do viable How far can compressed air automotive you go and how vehicles propulsion hard is it to compare in cost alternative? refuel a to other compressed vehicles? air vehicle? What is the Are compressed fossil fuel-to- air vehicles a motor output “green” serial efficiency propulsion for a technology? compressed air vehicle? Car photo: 12/10/2010 http://www.popularmechanics.com/cars/new s/preview-concept/4251491 1
- 2. Compressed Air Vehicle - Basics Vehicle Pneumatic Motor Energy Storage Compressed Air Tanks Image Source: http://www.mdi.lu/english http://zeropollutionmotors.us/, http://www.google.com/patents 2
- 3. Compressed Air Vehicle – Analysis Serial Efficiency Isothermal Compression and Expansion P Power Plant Average 0.35 P2 1 1< n=k n< 0.935 k Is <k Electric Grid n n= I Is 1 e t ent o o th he r rop erm m Air Power Output i ic a all compressor 0.48 Electric Power Input P1 Shaft Power Output Pneumatic Motor 0.31 V Compressed Air Power Input p2 p2 serial (0.35 )( 0.935 )( 0.48 )( 0.31) 0.0487 Wisothermal p1 V2 ln p1 p1 Compressed Air Internal Energy 3 p1V1 p2V2 U PV 2 Isothermal Power First Law Air Compression p2 p p1 V2 ln 2 p1 p1 Q W U Powerisothermal Time Image Source: <http://www.me.mtu.edu/~jstallen/courses/MEEM4200> 3
- 4. Battery Electric Vehicle - Basics Nissan Leaf Propelled by: (source www.nissanusa.com) Lithium Ion Battery Capacity = 24 kWh Charging Station (source www.GE.com) Range = 73 miles Fuel Economy Label (source www.nytimes.com) Motor Controller 80 kW Motor 4
- 5. Battery Electric Vehicle - Analysis Battery Electric Power Battery Storage Fossil Fuel Discharge Plant (0.35) Efficiency (1.0) Efficiency (0.99) Transmission Battery Charge Motor Controller Grid (0.935) Efficiency (0.99) (0.96) Charging AC/DC Electric Motor Power Out Station (0.86) Converter (0.90) (0.804) Serial (0.35)(0.935)(0.86)(1.0)(0.99)(0.90)(0.99)(0.96)(0.804) Efficiency = 0.192 Carbon 0.608 kg/kWh (CO2 for 1 kWh at plant) Footprint 0.192 (serial efficiency) = 3.17 kg/kWh 5
- 6. Gasoline Powered Vehicle - Analysis A gasoline powered vehicle that was rated for around 30MPG was used for comparison. Serial Efficiency of Gasoline Power: Fossil Fuel Engine out = 18% Technology Cost for Gasoline Power: Gasoline Engine Cost in Dollars 4000dollars dollars Technology Cost 28.25 Vehicle Power Output in kW 141.55kW kW Vehicle Cost for Gasoline Power: o An average sedan in the market, for example, a Chevrolet Malibu has a base price of $22,000. o The Malibu is rated at 23 MPG in town and 34MPG on the Highway while powered by a stock 193 HP 2.4 liter 4-Cylinder engine. 1. "Advanced Technologies & Energy Efficiency." Fuel Economy. Web. 05 Dec. 2010. <http://www.fueleconomy.gov/feg/atv.shtml>. 2. "2011 Chevy Malibu Sedan Specs and Features | Chevrolet." 2011 Cars, SUVs, Trucks, Crossovers & Vans | Chevrolet. Web. 09 Dec. 2010. <http://www.chevrolet.com/malibu/features-specs/>. 6
- 7. Gasoline Powered Vehicle Cont… Carbon Footprint for Gasoline Power: grams 44amu kg Carbon Content 2, 241 0.99 8.8 gallon 12amu gallon kg kg 8.8 8.8 gallon gallon kg Carbon Footprint 1.74 kWh kWh kWh EFF . 33.7 0.15 gallon gallon Energy Density of Gasoline: Joules 1MJ 1gallon MJ Energy Density 122 x106 32, 230 gallon 106 J 3.7854 x10 3 m3 m3 Vehicle Range : miles gallons miles Vehicle Range 30 16 480 gallon tank tank 7
- 8. Diesel Powered Vehicle - Analysis Diesel Serial Efficiency Fossil Fuel-to-motor output: Motor Efficiency = 40% = 0.40 Diesel Conversion Technology Cost Cost = (Diesel Engine Cost)/(Engine Output) Calculation: $5000 / 126.8 kW (2010 Jetta TDI) = $39.42/ kW Diesel Vehicle Cost Comparison • The average diesel vehicle costs about $1000 more than a comparable petrol model. -2010 VW Jetta TDI (Diesel) starts at $22,000, 2010 VW Jetta (petrol) starts at $20,000 -2010 VW Jetta TDI gets 40/22 mpg (hwy/city), gas model gets 30/20 mpg (hwy/city) 1. Way, By The. "2010 Volkswagen Jetta TDI - Top Speed." Web. 10 Dec. 2010. <http://www.topspeed.com/cars/volkswagen/2010-volkswagen-jetta-tdi-ar75332.html> 8 2. "2010 VW Jetta TDI Buyers Guide Myturbodiesel.com - VW TDI Forum, Web. 10 Dec. 2010. <http://www.myturbodiesel.com/1000q/a5/2009-2010-VW-Jetta-TDI-checklist.htm> 3. "Gas Mileage of 2010 Volkswagen Jetta." Fuel Economy. Web. 10 Dec. 2010. <http://www.fueleconomy.gov/feg/bymodel/2010_Volkswagen_Jetta.shtml>
- 9. Diesel Powered Vehicle - Analysis Carbon Footprint for Diesel Energy (Using Serial Efficiency for between Refinement and Motor Output.) Diesel Carbon Content = 2.7 kg/liter, Diesel Energy Content = 10.1 kW-h /liter Serial Efficiency = 40.0 % Carbon Footprint (kg/ kW-h) = (Carbon Content) / (Energy Content * Serial Efficiency) Calculation: 2.7/ (10.1*0.40) = 1.7 kg/ kW-h Diesel Energy Density (Calculated for diesel with a density of 0.84 g/ ml) Diesel Energy Content = 36.4 MJ/ liter; 1 liter = 1000 cm^3; 1 m^3 = 1,000,000 cm^3 Calculation: 36.4 * 100^3 / 1000 = 36.4 * 10^3 MJ/ m^3 Diesel Vehicle Range As stated previously, the gas mileage of the 2010 VW Jetta TDI is 40 mpg highway. A standard tank size for a mid to small size car is between 12 and 15 gallons. This would put the range of the Jetta between 480 and 600 miles (504 used for comparison). 1. Lucy, By. "The Pros and Cons of Going Diesel." Mortgage Rates Credit Cards Refinance Home CD Rates by Bankrate.com. 2. US Environmental Protection Agency. Web. 09 Dec. 2010. http://www.epa.gov/otaq/models/ngm/may04/crc0304c.pdf 3. Lucy, By. "The Pros and Cons of Going Diesel." Mortgage Rates Credit Cards Refinance Home CD Rates by Bankrate.com. Web. 6. 09 Dec. 2010. 4. http://www.bankrate.com/brm/news/auto/20030804a1.asp Web. 09 Dec. 2010. http://www.evworld.com/library/energy_numbers.pdf 9
- 10. Summary – Energy Efficiency Compressed Air 0.05 Battery Electric 0.19 Gasoline 0.15 Diesel 0.40 0.00 0.10 0.20 0.30 0.40 Efficiency (Fossil Fuel to Motor Out) Conclusion: Compressed air vehicles are on the low end of efficiency, diesel is unmatched for converting fossil fuel to usable motor power 10
- 11. Summary – Carbon Emissions Compressed Air 12.5 Battery Electric 3.2 Gasoline 1.7 Diesel 1.7 0 510 15 Carbon Footprint (kg / KWh) For Battery and Air: C.F. = (0.608 kg / kW-hr) (1/serial efficiency) For Gasoline: C.F. = (0.261 kg / kW-hr) (1/serial efficiency) For Diesel: C.F. = (0.667 kg / kW-hr) (1/serial efficiency) Conclusion: Compressed air vehicles produce lots of CO2 when powered by fossil fueled power plants 11
- 12. Summary – Energy Volumetric Density Compressed Air 46.5 Battery Electric 1080 Gasoline 32,230 Diesel 36,400 0 10,000 20,000 30,000 40,000 Energy Density (MJ/meter cubed) Conclusion: Compressed air energy storage systems are not able to store a great deal of energy, limiting their range. 12
- 13. Summary – Technology Cost Analysis Compressed Air $167 Battery Electric $62 Gasoline $28 Diesel $39 $0 $50 $100 $150 $200 Technology Cost (Dollars/kW) Conclusion: Compressed air vehicles are on the high end in terms of cost to produce power due to low power output. 13
- 14. Summary – Cost and Range Overall Vehicle Cost Summary: Compressed Battery Gasoline Diesel Air Electric Vehicle Cost $4600-$17,800 $32,780 $22,000 $20,000 Vehicle Range Summary: Compressed Battery Gasoline Diesel Air Electric Vehicle Range 29 miles 73 miles 480 miles 504 miles Conclusion: Compressed air and electric vehicles will create “range anxiety” condition with customers, they will be worried about returning home before their energy reserve is depleted. 14
- 15. Technology Comparison – Customer Focus Customer Compressed Battery Electric Gasoline Diesel Metric Air Co2 Emissions? Relocates CO2 Relocates CO2 Emits CO2 at place of Emits CO2 at place of emissions, but creates emissions, but creates operation operation more more Easy to Refuel? No, need air No, takes too long, Refuel quickly with Refuel quickly with compressor, large expensive charger large refueling large refueling power draw required infrastructure infrastructure Costly to Own? Not likely, but exact Expensive to buy, Inexpensive to buy, Slightly more costly to figures unknown lower cost to operate costly to operate buy, same as gas to operate Future Promise? May be charged at May be charged at Most convenient to Most efficient to own, home, reduce home, reduce own, limited future for limited future for low dependence on oil dependence on oil low cost oil cost oil Future Hurdles? Must improve Efficiency improving Fuel will continue to Fuel will continue to efficiency, on board but must still increase increase in cost, increase in cost, but energy storage, and on board storage and raising operating costs can be modified to infrastructure charging infrastructure use bio fuels Green Factor High, clean power if High, clean power if Low, bad reputation Low, bad reputation charged by renewable charged by renewable for increasing air for increasing air sources sources pollution pollution, fine particles 15
- 16. Conclusions Compressed air vehicles are on the low end of efficiency, cannot store enough energy, and have serious infrastructure issues. Diesel powered vehicles have the best efficiency overall Battery electric vehicle green energy claims should be challenged when they are powered by fossil fuel power plants Both air and electric powered vehicles require a refueling infrastructure to be viable Gasoline and Diesel vehicles will continue to be popular for their ability to refuel quickly and carry a massive amount of chemical energy 16