Impact of Propsed Cafe Standards on HTF Revenues- William Buencher ARTBA
•
0 likes•797 views

Impact of Propsed Cafe Standards on HTF Revenues- William Buencher ARTBA
Recommended

Recommended
More Related Content
What's hot
What's hot (20)
Viewers also liked
Viewers also liked (20)
Similar to Impact of Propsed Cafe Standards on HTF Revenues- William Buencher ARTBA
Similar to Impact of Propsed Cafe Standards on HTF Revenues- William Buencher ARTBA (20)
More from artba
More from artba (20)
Recently uploaded
Recently uploaded (20)
Impact of Propsed Cafe Standards on HTF Revenues- William Buencher ARTBA
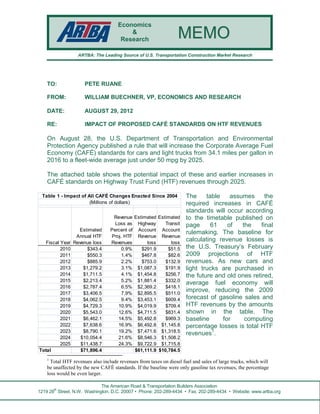
- 1. The American Road & Transportation Builders Association 1219 28 th Street, N.W. Washington, D.C. 20007 • Phone: 202-289-4434 • Fax: 202-289-4434 • Website: www.artba.org ARTBA: The Leading Source of U.S. Transportation Construction Market Research TO: PETE RUANE FROM: WILLIAM BUECHNER, VP, ECONOMICS AND RESEARCH DATE: AUGUST 29, 2012 RE: IMPACT OF PROPOSED CAFÉ STANDARDS ON HTF REVENUES On August 28, the U.S. Department of Transportation and Environmental Protection Agency published a rule that will increase the Corporate Average Fuel Economy (CAFÉ) standards for cars and light trucks from 34.1 miles per gallon in 2016 to a fleet-wide average just under 50 mpg by 2025. The attached table shows the potential impact of these and earlier increases in CAFÉ standards on Highway Trust Fund (HTF) revenues through 2025. The table assumes the required increases in CAFÉ standards will occur according to the timetable published on page 61 of the final rulemaking. The baseline for calculating revenue losses is the U.S. Treasury’s February 2009 projections of HTF revenues. As new cars and light trucks are purchased in the future and old ones retired, average fuel economy will improve, reducing the 2009 forecast of gasoline sales and HTF revenues by the amounts shown in the table. The baseline for computing percentage losses is total HTF revenues1 . 1 Total HTF revenues also include revenues from taxes on diesel fuel and sales of large trucks, which will be unaffected by the new CAFÉ standards. If the baseline were only gasoline tax revenues, the percentage loss would be even larger. MMEEMMOO Economics & Research Fiscal Year Estimated Annual HTF Revenue loss Revenue Loss as Percent of Proj. HTF Revenues Estimated Highway Account Revenue loss Estimated Transit Account Revenue loss 2010 $343.4 0.9% $291.9 $51.5 2011 $550.3 1.4% $467.8 $82.6 2012 $885.9 2.2% $753.0 $132.9 2013 $1,279.2 3.1% $1,087.3 $191.9 2014 $1,711.5 4.1% $1,454.8 $256.7 2015 $2,213.4 5.2% $1,881.4 $332.0 2016 $2,787.4 6.5% $2,369.2 $418.1 2017 $3,406.5 7.9% $2,895.5 $511.0 2018 $4,062.5 9.4% $3,453.1 $609.4 2019 $4,729.3 10.9% $4,019.9 $709.4 2020 $5,543.0 12.6% $4,711.5 $831.4 2021 $6,462.1 14.5% $5,492.8 $969.3 2022 $7,638.6 16.9% $6,492.8 $1,145.8 2023 $8,790.1 19.2% $7,471.6 $1,318.5 2024 $10,054.4 21.6% $8,546.3 $1,508.2 2025 $11,438.7 24.3% $9,722.9 $1,715.8 Total $71,896.4 $61,111.9 $10,784.5 Table 1 - Impact of All CAFÉ Changes Enacted Since 2004 (Millions of dollars)