Vietnamese satisfaction and dissatisfaction with smartphone
•Download as PPTX, PDF•
3 likes•2,182 views

What are the things that Vietnamese are happy / unhappy about their smartphones. Check out our surveys to 500 smartphone owners

Recommended
Recommended
More Related Content
What's hot
What's hot (20)
Viewers also liked
Viewers also liked (20)
Similar to Vietnamese satisfaction and dissatisfaction with smartphone
Similar to Vietnamese satisfaction and dissatisfaction with smartphone (20)
More from Q&Me Vietnam Market Research
More from Q&Me Vietnam Market Research (20)
Recently uploaded
Recently uploaded (6)
Vietnamese satisfaction and dissatisfaction with smartphone
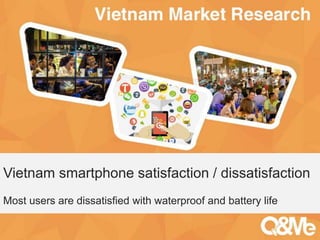
- 1. Your sub-title here Vietnam smartphone satisfaction / dissatisfaction Most users are dissatisfied with waterproof and battery life
- 2. • Survey about smartphone satisfaction and dissatisfaction • Sample size: 502 samples • Respondent criteria: Male & Female, IOS & Android users, 15-44 years old • Area: Vietnam • Conducted time: October 30th-November 10th, 2015 Survey information
- 3. • 76% people use Android and 24% people use IOS. • 31% people are dissatisfied with battery life. • 67% people want to use smartphones with long battery life. • Battery life of the 80% smartphone are likely to run out within a day. • 83% people have dropped their smartphone. • 36% people have their smartphone lost and stolen in street. • 41% people use the online app or service in case of the lost Executive summary
- 4. Male 49% Femal e 51% GENDER 53% 36% 9% 2% AREA Ho Chi Minh City Hanoi Da Nang Other 34% 20% 16% 22% 9% 1% 0 10 20 30 40 15-19 20-24 25-29 30-34 35-39 40-44 Age Age Respondent profile
- 5. People with high income use more IOS than Android. 46% 24% 24% 6% ANDROID USER Less than 3M VND 3M-5M 5M-10M 10M-50M 36% 26% 25% 13% IOS USER Less than 3M 3M-5M 5M-10M 10M-50M OS type by monthly income
- 6. OS type by gender 55% 41% 45% 59% Android user IOS user What kind of smartphone do you use? Male Female IOS is used by women more than men.
- 7. 78% 68% 67% 64% 62% 61% 57% 55% 54% 52% 33% 18% 59% 53% 54% 63% 48% 53% 46% 52% 58% 43% 36% 26% Brand Device design Display quality Usability Weight Sound Quality Camera Devise size Display size Durability Battery life Water proof How much are you satisfied with your phone? IOS Android Users are dissatisfied with battery life and water proof function. Smartphone satisfaction by feature
- 8. IOS users are satisfied with brand the most. 54% 40% 22% 24% Female Male Are you satisfied with your smartphone brand? IOS user Android users Gender difference in brand satisfaction
- 9. Android users are dissatisfied with battery life more than IOS users. 26% 74% IOS user Dissatisfied Average/Satisfied Dissatisfaction with battery life 33% 67% Android user Dissatisfied Average/Satisfied
- 10. More women want phones with better camera than men do. 64% 36% 39% 25% 71% 49% 32% 35% Long battery life Better camera feauture innovation design Better sound quality Female Male The features needed for smartphone
- 11. Women start concerning when battery is about to run out more than men. 5% 3% 5% 12% 22% 28% 23% 2% 3% 2% 6% 17% 38% 31% I do not care once it runs out of battery 40-60% 30-40% 20-30% 10-20% 1-10% What percentage of battery You would start concerning? Female Male Concerns on smartphone battery
- 12. - Battery problem is the most problem for both users. - Android users have more malfunction of device as problem than IOS users. 14% 15% 20% 18% 33% 44% 23% 23% 23% 35% 38% 45% Hardware evice problem Trouble with water Screen is broken or fractured Malfunction of device I had dropped phone Battery problem What kind of technical problem have you had? Android Users IOS Users Technical problem experience of smartphone
- 13. 40% 32% 31% 21% 19% 9% 40% Dropped from hand in operating deivices From desk or table Dropped from clothes pokets Dropped from hand in not operating devices When my child plays it Dropped from the bag Others How have you dropped your smartphone? Situation when users drop smartphone
- 14. More smartphones are stolen and lost in South Area than other area. 11% 17% 25% 9% 15% 10% North Middle South Have you ever have your smartphone stolen or lost? Stolen and lost lost Smartphone stolen experiences
- 15. Most users have lost and have smartphones stolen in street. Street 36% Café 9% Public transportation 17% Park 14% School 20% Places smartphones have stolen and lost
- 16. Use of the screen protection film Use of the smartphone protection cover Use of the online search app or service in care of the lost Use of the strap to tie it to your clothes 79% 57% 56% 83% 88% 73% 62% 87% Male Female Smartphone accessory ownership by gender Women use more smartphone protection cover than men.
- 17. Q&Me is the market research that helps you understand Vietnam market broad and deep by offering both of quantitative and qualitative survey online. + = Info@qandme.net Quantitative Survey Qualitative Survey Better Understanding Understand the consumer trend and opinions through the numeric data Feel the insight of your target audience through online focus group of chatting. You receive both of generic and deep information easily with affordable pricing.