SlideShare a Scribd company logo
1 of 13
Download to read offline
Experimental Physiology (1999), 84, 435-447
       Printed in Great Britain


         BREAST VOLUME AND MILK PRODUCTION DURING
               EXTENDED LACTATION IN WOMEN
              JACQUELINE C. KENT *, LEON MITOULAS, DAVID B. COX,
                  ROBYN A. OWENS t AND PETER E. HARTMANN
       Departments of Biochemistry and t Computer Science, The University of Western Australia, Nedlands, WA 6907,
                                                        Australia
                            (MANUSCRIPT RECEIVED 16 JULY 1998, ACCEPTED 2 DECEMBER 1998)


                                                         SUMMARY
          Quantitative measurements were made of relative breast volume and milk production from
          1 month of lactation until 3 months after weaning, and the storage capacity of the breasts was
          calculated. The increase in breast tissue volume from before conception until 1 month of lactation
          was maintained for the first 6 months of lactation (means + S.E.M.) (190.3 ± 13-1 ml, number of
          breasts, nb = 46). During this period of exclusive breast-feeding, 24 h milk production from
          each breast remained relatively constant (453.6 + 20 1 g, nb = 48), and storage capacity was
          209-9 + 11-0 ml (nb = 46). After 6 months, breast volume, milk production and storage capacity
          all decreased. There was a relationship between 24 h milk production and the storage capacity of
          the breasts, and these both appeared to be responding to infant demand for milk. At 15 months of
          lactation, the 24 h milk production of each breast was substantial (208.0 + 56-7 g, nb = 6), even
          though the breasts had returned to preconception size. This was associated with an apparent
          increased efficiency of the breast (milk production per unit breast tissue) after 6 months, which
          may have been due to redistribution of tissues within the breast. The possible causes of the
          decrease in breast volume are discussed.


                                                      INTRODUCTION
       The computerized breast measurement (CBM) system (Daly et al. 1992), which measures
       breast volume, has been developed further to allow us to make quantitative longitudinal
       measurements of breast volume from before conception, throughout pregnancy, until 1 month
       of lactation (Cox et al. 1999). That study demonstrated the wide variability between women
       in the amount and pattern of breast growth during pregnancy. While Neifert et al. (1990)
       found an association between minimal prenatal breast enlargement and insufficient lactation
       up to 21 days after birth, Cox et al. (1999) found no such relationship. The relationship
       between breast size and milk production beyond 1 month of lactation has not previously been
       studied.
          Milk production is relatively constant over the first 6 months of lactation (Dewey &
       Lonnerdal, 1983; Hartmann et al. 1995; Cox et al. 1996). From 6 to 16 months milk
       production declines even if mothers are not deliberately weaning their infants (Neville et al.
       1991). Furthermore, milk production during the first 6 months of lactation is not determined
       by the concentration of prolactin in the blood (Cox et al. 1996). It has been demonstrated that
       milk production 4- 10 months after birth responds to the demand for milk by infants (Daly et
       al. 1993b) but factors controlling milk production beyond this time have not been established.
                                      ;
                                          Corresponding author: jkent@cyllene.uwa.edu.au
1808


                          Downloaded from Exp Physiol (ep.physoc.org) by guest on August 22, 2009
436                                      J. C. KENT AND OTHERS

  As lactation proceeds, mothers are aware of changes in the size of their breasts, but these
changes have never been quantified, and their physiological significance has not been
determined. We aimed to measure the changes in breast volume from 1 month of lactation
until weaning; to determine whether the breast returned to its original pre-conception volume;
and to determine whether milk production throughout lactation was limited by either the size
or storage capacity of the breast.

                                                  METHODS

Subjects
  The study was approved by the Committee for Human Rights at The University of Western Australia.
The subjects were the same as described in Cox et al. (1999). Briefly, the eight subjects who had been
studied throughout pregnancy fully breast-fed their infants for at least 6 months. All the infants were
introduced to solid foods between 6 and 12 months of age, and complete weaning occurred between 18
and 24 months for subjects 1, 2, 3, 4, 7 (left breast) and 8. We measured their breast volume and 24 h milk
production at 1, 2, 4, and 6 months of lactation, at 3-monthly intervals until weaning, and where possible
3 months after weaning. Subject 1 was unavailable for measurements after 9 months of lactation but
returned for measurement after weaning. Subject 3 was only able to have 24 h milk production measured
at 6 weeks, and breast volume and 24 h milk production at 6 and 12 months of lactation and after
weaning. The final measurement of breast volume in subjects 5, 6 and 7 (right breast) was made between
30 and 33 months after birth. Their infants were still going to the breast between twice a day and once
every two days, but the amount of milk taken from each breast was less than 70 g per day.
Milk production
  Milk production from each breast was measured over a period of at least 24 h by test weighing the
mother (Arthur et al. 1987). Milk samples (< 1 ml) were collected from each breast by either manual
breast pump or hand expression into 5 ml polypropylene plastic vials, immediately before and after each
breast feed. Samples were frozen as soon as possible and kept at -15 °C until analysis. Although subject 2
successfully breast-fed her infant, no milk samples were collected due to her inability to express milk.
Breast volume
  Relative breast volume (RBV) (the volume of breast tissue and chest wall contained within an arbitrarily
but repeatably drawn black line encompassing all the breast tissue) was measured in the Department of
Biochemistry using the CBM system (Cox et al. 1999) during each 24 h period of measurement of milk
production. Between one and four measurements were made on each breast over a period of up to 5 h.
Milk samples (< 1 ml) were collected from each breast each time a breast volume measurement was
made, and stored as above.
Subject body weight and infant growth
  Subjects were weighed in the Department of Biochemistry before conception and during each occasion
on which breast volume was measured. Subjects provided records of the birth weight of their infants as
measured by midwives attending the birth, and weights of their infants up to 6 months of age as measured
by the Community Health Nurse at each subject's Child Health Centre.
Ester-ified fatty ac id mneasurement
   Total esterified fatty acids (EFA) were measured in all the milk samples by the method of Stcrn &
Shapiro (1953) as modified by Atwood & Hartmann (1992). As 98 % of lipid in human milk is present as
triacylglycerols (Jensen, 1989), thc EFA concentration of the samples vwas used as a measure of the fat
contcnit of thc milk assumning an average molecular weight for milk triacylglycerols of 843 1 Da (DaLly et
al. 1993a).
'Enpty' breast violIume
   RBV is a measurc of thc x olume of breast tissue a nd cliest x all in fronit of the planc definied by the black
cllilsc. DuLring lactaLtion thi.s RBV also includes the volumic oft milk conitaincd in the brcLast at the tlime of


               Downloaded from Exp Physiol (ep.physoc.org) by guest on August 22, 2009
BREAST VOLUME AND MILK PRODUCTION                                          437
measurement. Daly et al. (1993a) have described an equation which relates the fat content of the milk to
the degree of fullness of the breast. Using this equation and the measured fat content of each sample, the
degree of fullness of the breast at the particular time the sample was collected can be calculated (Cox et
al. 1996). From the changes in degree of fullness from before to after each feed and the volumes of milk
removed from the breast at each feed, the amount of milk remaining in the breast at each time can be
calculated. The RBV measured by the CBM system can then be corrected for the amount of milk in the
breast to give the 'empty' breast volume (EBV) (Cox et al. 1999). While the breast may never be actually
empty, this is the minimum volume of the breast for that day and it can be used to represent the volume of
breast tissue (glandular and fatty). The breast volumes quoted in this paper will be expressed as the
difference between the calculated 'empty' breast volume and the pre-conception breast volume and are
termed proliferated breast volumes (PBV).
   Thus, measurements of breast volume can be represented as follows:
           RBV = volume of breast tissue + volume of chest wall + volume of milk in the breast;
           EBV = RBV - calculated volume of milk in the breast;
           PBV = EBV - pre-conception RBV.
   That is, PBV represents the difference in the volume of breast tissue between the current measurement
and the measurement made before conception.
Storage capacity
  The storage capacity of the breast is the amount of milk calculated to be in the breast when it is full.
Since no milk samples were collected from subject 2 we were unable to calculate either her EBV (and
therefore PBV) or storage capacity, and her data are not included in this paper.
Statistics
   Repeated measures analysis of variance was used to test significance of differences between times
(SuperAnova, Abacus Concepts, Inc., Berkeley, CA, USA, 1987). Correlations and Student's paired t
tests were performed using the StatView SE + graphics software package (Abacus Concepts). Results are
presented as means + S.E.M. unless otherwise stated. P values greater than 0-05 are regarded as not
significant. The number of subjects is represented by N and the number of breasts by nb.

                                               RESULTS

Milk production and feeding frequency
  The 24 h milk production of each breast of each subject is shown in Fig. 1 and the mean
24 h milk production of all breasts in Fig. 2. For the first 6 months of lactation the 24 h milk
production from each breast remained relatively constant, averaging 453-6 + 20-1 g (nb = 48)
(Fig. 2). At 9 months of lactation the 24 h milk production from each breast (369-3 + 47-7 g,
nb = 12) was significantly different from that at 1, 2 and 4 months (459.3 + 48.2 g, P = 0 029,
nb = 12; 4500 + 40.4 g, P = 0-040, nb = 12 and 4497 + 34-5 g, P =0034, nb = 10,
respectively), but not different from that at 6 months (425-7 + 39 4 g, n = 12b) or from the
mean for each mother for 1-6 months. Between 9 and 12 months of lactation there was a
significant decrease in 24 h milk production to 260 3 + 55;8 g (P = 0-029, nb = 10), with a
further decrease to 109 2 + 47.7 g (P = 0006, n = 6) for subjects 5, 6 and 7 who were
breast-feeding at 18 months. At 24 months each breast of these mothers was producing
57.4 + 41 7 g (n,b = 5). Apart fiom subject 7, there were no consistent bilateral differences in
the milk production of the breasts of tlhe subjects.
   The mean total daily breast milk intake of the infants over the first 6 months ranged widely
froin 574 + 60 g for subject 4 to 1 181 + 94 g for subjectl.
   During the first 12 months, each breast W.as suckled between 3 and 8 times per day, with
mean values of' 64+ 0)3 (nj), = 12), 5 2 + 0 3 Oi1,) 12) and 51 + 0 3 (n,) = 10) tiines per day
at 1, 6 and 1 2 months, respectively. FIom 15 to 24 montlhs each breast w"as suckled between 2


                   Downloaded from Exp Physiol (ep.physoc.org) by guest on August 22, 2009
438                                    J. C. KENT AND OTHERS

        800                                                      800
                     Subject 1                                             Subject 6
                     tK
                      ;
        600                 -0.                                  600
                          11
        400                                                     400

        200                                                     -200
          0

       -200                                      I              -200            .            .       .       .
               0 3 6 9 12 15 18 21 24 2                    +3      0 3 6 9 12 15 18 21 24 27 w
        800          Subject 3                                  800 Subject 7
                                                                                    O.   -               %
 0)
 c
 0
        600
                     .4s                                        600         'J
                                                                           ,d

 ~0    400                                                      400
 -0
 0
                     0.
 -c    200                                                      200 .

 cwJ      0                                                       0
 0
                                                                                                                              H~
 E     -200 0             ,                     4|
                                                 1     |        -200 |      .            .       .           .       .   .T
              3 6 9 12 15 18 2            24 27'                '0 3 6 9 12 15 18 21 24 27 w w+3
 e
 E      800 F Subject 4                                         800        Subject 8
 ~0
 U)
       600                                                      600
 a)
 -o
  -


 a)    400                                                      400         .-


 a)
       200                                                      200                                  '           %


         0                                                        0

       -200                             , sIIs
                                        Is                      200         . .                  * *    I         11 1
                                          24           +               0    3 6                  9 1215 18 21 24 2w+3
       800                                                                               Time after birth (months)
                    Subject 5

       600      6    I'

       400
                     d

       200                        la
                     E--L

         0

       -200     .1                        I

              0 3 6 9 12 15 18 21 24 27 w
                   Time after birth (months)

                                       Fig. 1. For legend see facing page.


              Downloaded from Exp Physiol (ep.physoc.org) by guest on August 22, 2009
BREAST VOLUME AND MILK PRODUCTION                                                    439


                                  500
                                                                                          200

                          4)400                (10                                        E1
                          _                  (12) (12)                                           E
                              0300                                                        100    >

                                                     0.0
                                  200                      (0
                          E                                (10)
                                                                                                 c
                              -                                                           0
                                  1100                                              1

                                                                  (4)
                                                                    (7)       (10) (7)
                                    0                                         5) _-1 00
                                         0    3      6 9 12 15 18 21 24 27 w w+3
                                                      Time after birth (months)

Fig. 2. 24 h milk production (0) and proliferated breast volume (0) of left and right breasts of 6 subjects from 1 month of
  lactation until 3 months after weaning. w is the time of weaning, w + 3 is 3 months after weaning. Values are means with
  S.E.M. represented by vertical bars. Number of observations for each point is shown in parentheses. Zero proliferated
  breast volume is the volume of the breast before conception.

and 6 times per day, with mean values of 3 3 + 0-3 (nb = 8) and 2 8 + 0-2 (nb = 5) times per
day at 15 and 24 months, respectively. There was no change in the mean amount of milk
consumed per feed from each breast during the first 9 months, ranging from 73.8 + 8.9 g
(nb = 12) at 1 month to 83.8 + 7-2 g (nb = 12) at 6 months. This decreased to 50 4 + 9.8 g
(nb = 10) and 531 ± 171 g (rb = 8) at 12 months and 15 months, respectively, then decreased
further to 34-0 + 115 g (nb = 6), 25-3 + 8-5 g (nb = 7) and 26-5 + 21.3 g (nb = 5) at 18, 21
and 24 months, respectively.

Breast volume
  The PBV of each breast of each subject is shown in Fig. I and the mean of all breasts in Fig. 2.
For the first 6 months of lactation PBV remained relatively constant, averaging 190-3 + 13.1 ml
(nb = 46) (Fig. 2). At 9 months of lactation the PBV (95.8 + 19 8 ml) was significantly different
from that at 6 months (P = 0-003, nb = 12). The PBV at 12 months (78.8 + 15-6 ml, nb = 10)
was not different from that at 9 months. By 15 months PBV had decreased (P = 0 035, nb = 6)
and was not significantly different from preconception volume. There was no further change in
PBV until weaning. There was no difference in PBV between measurements made both at
weaning and 3 months later (subjects 4, 7 (left breast) and 8). The final RBV averaged
17 8 + 13-8 ml less than pre-conception RBV (nb = 14), but this difference was not significant.
Apart from subject 7, there were no consistent bilateral differences in PBV of the subjects.
  There was a significant relationship between 24 h milk production and PBV when these
measurements over the lactation period were incorporated (r2 = 0-428, P = 0 0001, nb = 105)


Fig. 1. 24 h milk production (circles) and proliferated breast volume (squares) of 7 subjects from 1 month of lactation until
  3 months after weaning. Open symbols represent the right breast, closed symbols represent the left breast. Arrow
  indicates time of weaning. w is the time of weaning, w + 3 is 3 months after weaning. For subject 7 the infant was
   weaned only from the left breast. Zero proliferated breast volume is the volume of the breast before conception.


                     Downloaded from Exp Physiol (ep.physoc.org) by guest on August 22, 2009
440                                             .4          C. KENT AND                OTHERS
                                           800


                                           600


                                           6
                                           400                                 .    0        j


                                   Co      200   -


                                               -2 -10 0                   0         100          200       300        400
                                                               Proliferated breast volume (ml)

 Fi-. 3. Relaitioniship Mwete nl 24 h tiiillk pro-tductionl .rnd          prroldeited.tt bi-c.ast VOILIIIC 16r lcf't aind i-ighit bi-catst.s   ol 6
   fio Itin
          1inonth oflal.ctatiOll Lint il 3S iionth.s af-terwue',1111'11                                                                               subjccts


(Figa. -onh( 7 e"LlchS subject anallysed individlually (ratnaing from 1- = 0-505, p = 0-0002,
    tC 3) aind for                      2002
71l) 22? in subject 7, to 1-2 rnl 0-89)2, P 0--00()1, 71, 2(), in subject 5) (Fig. 4). However, when
                               =
eaclh mealsurement tim-e was anallysed individuallly, ther-e was no relaltionship between these
par.ameter-s.
    As a1 mealsure of the 'efficiency' of the breast tissue, the raltio of the miean 24 h millik production
to the miean PBV at1 eLich mieaisuI-emfent tilne va.S calculalted. Thils showed only a simall variation
during the fir-st 6 moniths (2) 16 2 43 g rml-'), then inicrealsed to 3 85 g rml-' at 9 imonths and
330 g nml-' at 12 iontl0s.

S'to7-age capacitil
     The chainoe in stor-bloe capacaity of the brea1sts is shown in Fig. 5. The avZer.ae storage
                                                                                                    calpacity
,at   I)ot (1t )+2)2m,n 2) i ncreased to 2 31 .9 + 2 7.3 rl .I t 4 mioiiths (P-= 00016,
       m
sI'l) = 10). This waIs follow!ed by *t decrease fl'IOm 6 to 9) nioitlths (234.6 + 17 5 to 174.5 + 11 7 ml,
P =- (0) 0(, nl, = 12). Apart fi-oill subject 7, ther-e Nxere nio coinsisteiit bilaterall difHeerences in the
storage capacities of the bieeealsts ot the subjectsl
      TFie.-. WRstt-ooio relntionship
                  S
                                                          storii ge clityatnd
                                                      between cadi          o4                               h       ptaoduction
                                                                                                                 illefk                        6hen   these


ineasurements f tr  indimiduwal breasts uer  i the lactation perieod noere iacoi-porsited(b2e 0588
     =()000 1, n1, 83) (Fig. 6 z.lnd Table I1); and between the suii1 of' the storalge calp.lcity of left
  asdraght
         bmreofastsL ed of the 24 h eilstiodLctihenfroo leoft and right bieastls rhen these
                        SLini                     p
itneLmsureentsPeB the acmastiolu peientdtri eiwscolpoulated (h2i= sho 12, P = a) sma1l N = 43).
               o      e                                                   7
There tere sinificra6 t elatioi(sl0lps betgeen these
                    mo                                      pireas eted s8 at mlontla (92 n.739a,
                                                                                            m
P =00282g N
        m6), 2 ilonlhs (1_2 = 0)729, p = 0 0304, N = 6) and 1m2 thontlsS = 0827,                                                         (.2
P = 001 1'3, N = ), but not aIt 4, 6, ') or- 15) rnioitlis.
  There hans a ilatiogselicp betaeen storage cLpacity ofnd PBV ihe aeese setsureaents
                                                                    bret
the lactation peoriod weredacorpoeiated (th l ct147, P =0erid04, 8ic ) However, opei
                           i                                           we =                       when
elch    xexrcemeinttifice rlatlnysed i edinidually, there wareto relsatioslip bethween the0se
                        an s                                   p
parArmeters.


                   Downloaded from Exp Physiol (ep.physoc.org) by guest on August 22, 2009
BREAST VOLUME AND MILK PRODUCTION                                                           441
               800
                                 Subject 1                                           Subject 6
        O
       c       600
       0
       0                                                 * J*                                          0

       0-                                                                                                           .   -S
                                                                                                        0
       m
       C-
               400
                                                                                                       S

       E
       =       200
       c'

                 0


               800


        0)
        c
               600
        0

       -o
       0
               400
        C-

        E
       -Ce

               200


                     0


               800
                                 Subject 5                                           Subject 8
               600
        .o V                                     0

                                                                                                                S
        ° 400                                        ,                                                      0


        .E                                   0
               200l
       c't
                             00
                 0       .   .    , .4 i .       ----I          . -. .
                     -200         -100 0        100 200 300              400   -200 -100 0         100 200 300               400
                                 Proliferated breast volume (ml)                    Proliferated breast volume (ml)

Fig. 4. Relationship between 24 h milk production and proliferated breast volume for left and right breasts of 6 subjects
  (individual plots) from month of lactation until 3 months after weaning.

  At 1 month of lactation there was no relationship between the number of feeds per day and
the storage capacity of the breast. While there was a decrease in the number of feeds per day
as lactation progressed, the number of feeds per day was not dependent on the storage
capacity either throughout lactation or during the first 6 months when milk production was
relatively constant.


                             Downloaded from Exp Physiol (ep.physoc.org) by guest on August 22, 2009
442                                                              J. C. KENT             AND OTHERS


                                            300


                                    8
                                            200~
                                    (0
                                                         (12)              (12
                                    0-                                     (12)
                                                       (12)
                                    a1)
                                    0)      100l


                                                                                                        (3)            1
                                              0                                                                        (2)
                                                   0          3     6       9            12        15   18      21     24    27    30
                                                                        Time after birth (months)

Fig. 5. Sloiage capatit of lcf t and ti-ht hieasts of (6 sLItjcCts ftol1 I 1 monlthl Lnlltil 24 imonthlis otf lactation.                          alues ate means
   Witi S.F.N. repiescncd b x rtical hlars. NLInIhetl- of oet
                                                           OSCI''ations f1o`t eaich poillt is slhown inI patreniheCs.s

                                           800


                                           6 00                                                                  *
                                                                                         **        *
                               .0
                                o
                                0                                                    *        0S            *
                                           400                                           s

                                         * 200
                               c'          200                                   0


                                                                                                        0


                                                   0                 100                       200               300              400
                                                                        Storage capacity (ml)

Fit. 6. Rclationishipe     beiwcsti the 24 hi iilk p i-odctction and tili stoIt age capacity for- left                       aind -ihtt bicasts of 6 sLhbjets fir0m
   1 1tonh0ttl LIlItil 24 imonitlihs of lactatlitl.


Subject bocdv weight ciml inCfant growt/h
   Subject body weight xxas significantly higher at I mlonth of' lacttion (67 8 + 4-2 klg) thaLn
before conlceptioIn (64.7 + 3 4 ka, P = 0 035, ' = 6). During lactatiol, tlxxo subjects lost
w eight, txxo subjects ga ined weight, xxhile the xliglht of the remlaitling txx o fluctua ted.
                                                                                                 Oxerall,
there xxwas a- decrease in xeiglt betxxween 6 .and 9 imontits aind, for tile fou- subjects still
                                                                                                 feedingg,
0 furthier- decreatse betxeen 9 alnd 2 1 imonths (Fig. 7). The fital body xeight of the Illottlers
shoxed a xide ralinge (67.5 + 48 kg) xxhich xxas not sigtnificalntly different fromil bef'ore
conception (Student's pIli-ecl t test, P 0 170, N = 6).


                 Downloaded from Exp Physiol (ep.physoc.org) by guest on August 22, 2009
BREAST VOL U! ME AND NMILK PRODtlCTION                                                                 443

Table 1. Correlatiotns of 24 h miiilk pr-oduction acnd stor-age capacity of individlual br-easts at
                               different measurement times thlroughouit lactation
                                               Tiunlle            I'        P       it
                                             (illonithxs)

                                                   1            ().655   110() 14   1l
                                                   2            1)666    10)0001I   12
                                                   4            0.491    0l0241     10
                                                   6            0-343 0(0453        12
                                                   9            0)0 0()(0.102       12
                                                   12           1)662 0-0042        10
                                                   15           0)45t   ni.s.            6
                                                  1 24          0(588 0(000 1       83


                          90
                          85   -


                          80   -

                          75   -


                              0)
                      0   -6
                          55 0-0,
                          60 k_
                          55                                A

                          50

                                   Pre   0    3         6   9      12 15 18 21 24                27    w      w+3
                                                                Time after birth (months)

Fig. 7. Body x eig}ht tOf SLIhjects b t e conzeplic tioon (Prt)
                                                             ciland tt otib-o0.tlIt CtCtiO   W    is tIlh tillnC Otf   w   ealillg,   w   + 3 is
           bIRCl- %Nci cv0. SuIbject 1 (O). 4 (0) 5 (m), 6 (o). 7 (A)l 8 (A).
    m11onith.s     xx

   litfatits xeiglhed between 2790 g (inf.ant of subject 7 lho u.As delixered at 34 weelks
                                                                         w
gest"Ation due to pllacentaz prIaevia) and 4930 g at birthi wxhich is betxeen approximately the
20th and > 97thi centiles on the NCHS groxth curVes for children (US Depa-rtmenit of He.alth,
Education and Welfare, 1977). During the first monithi the xxoeight aian of the infantsi ranged
from 25 7 to 818 g per day. At 2 months, the smiallest infint xxas on the 35th centile, while the
others xvere betxeen the 50th a.nd 90th centiles. The mean weiglt ga,in for each iilifailt oxer tile
first 6 montlis ranged betxween 16 1 and 29)5 g per day. At 6 monthIsiilfatlts Were betxeen
                                                                               tie
the 20th and just oxer the 75th centiles. At 12 mltonths all initrints railged between the 3rd and
the 50th centiles, ind betxweeni 1 9 alnd 26 Illontlls, whenl txo of tile infants were wecaliled and the
remtaining ijililtits were Pllrtially breast-fed, they still ralnged betxxenei the 3rd alnd 50th centiles.
TheIe   ws no riclationship betxeen the ilfailt "'ightwci
        xx
                                                             i durinlg the first 1(1o1ith lnd PBV
(Lxaerage of' left and right for each miother) at 1 Illonth. Hoxever, tlhere xwas a relationshlip
betxxween the IlleIal xeigiht gaill of cacli intlatnt oxver the first 6 illoitil.s alnd its mca ciiailx breatst
                                                                                                  d
Illilk inltake (r2= 0.827, P = 0 045> N = 6) (Fig. 8).


                       Downloaded from Exp Physiol (ep.physoc.org) by guest on August 22, 2009
444                                       J. C. KENT AND OTHERS


                                30


                                                                       A

                          cm
                          0               0
                                 0
                          c     20
                          o               0


                                1 0 .LI                           .
                                   500    600     700    800     900       1000 1100 1200
                                                  Breast milk intake (g day-1)

Fig. 8. Relationship between the mean daily growth rate of infants and their mean daily breastmilk intake for the first
  6 months of lactation. Subject I (0), 4 (0) 5 (U), 6 (o), 7 (A), 8 (A).


                                                  DISCUSSION

Dewey et al. (1986) using data pooled from four studies found that 24 h milk production of
multiparous women between 6 and 18 weeks of lactation was 755 ± 177 g (mean + S.D.).
These milk production values were determined by weighing the infants without correction for
evaporative water losses, which would lead to an underestimation by 10 % (Arthur et al.
1987). Therefore, normal milk production would be 830 + 195 g (mean + S.D.) giving a
normal range of 440-1220 g (mean + 2 S.D.). Based on these figures, the milk production of
subject 4 at 1 month (413 g) was lower than normal, and subject 1 at 1 and 2 months (1324
and 1325 g, respectively) and subject 5 at 4 months (1259 g) were higher than normal, while
the remainder in the present study were within the normal range. The present data (24 h milk
production for 1-6 months of lactation of 905 3 + 245-3 g, mean + S.D.) are also consistent
with our previous data (Hartmann et al. 1995; Cox et al. 1996) for 24 h milk production of
798 + 216 g and 837 + 190 g (mean + S.D.), respectively, between 1 and 6 months of lactation.
The decline in milk production from 6 to 15 months is similar to the data of Neville et al.
(1991) for mothers who were not deliberately weaning their infants.
  It is immediately apparent from Fig. 1 that there was a small variation in PBV between
subjects at 1 month (coefficient of variation (c.v.) 15-1 %), compared with the large variation in
24 h milk production (c.v. 48-2 %). This confirms that 24 h milk production at 1 month is not
dependent on the amount of breast growth from before conception until 1 month of lactation
(Cox et al. 1999). Since milk production is unchanged for the first 6 months of lactation, we
conclude that breast growth during pregnancy and the first month of lactation had no effect on
milk production while infants were being fully breast-fed. Even though there was a significant
correlation between 24 h milk production and PBV when these measurements over the
lactation period were incorporated (Figs 3 and 4), there was no relationship between these
parameters when each measurement time was analysed individually. This implies that the 24 h
milk production is not dependent on PBV, but rather both are decreasing with time.


              Downloaded from Exp Physiol (ep.physoc.org) by guest on August 22, 2009
BREAST VOLUME AND MILK PRODUCTION                                    445
   Between 6 and 9 months of lactation there was a significant decrease in PBV, but no change
in 24 h milk production. This resulted in an increase in the ratio of the mean 24 h milk
production to the mean PBV at 9 months and implies an increase in efficiency of the breast
tissue. This may be due either to an increase in efficiency of the secretory cells during this
time, or to mobilization of fat tissue from the breast. Five of the subjects lost weight between 6
and 9 months, so fat tissue may have been lost from the breast along with overall fat loss.
However, PBV was not related to body weight changes at other times. It is possible that
mobilization of fat from the breast may occur separately from overall loss in body weight,
since Hartmann et al. (1995) have shown a redistribution of fat stores during lactation.
   The decrease in PBV after 6 months may be due to a combination of both mobilization of
fat from the breast and loss of mammary cells. Programmed cell death is part of the normal
repertoire of the lactating and involuting mammary gland (Quarrie et al. 1996). It occurs in
rodents and ruminants (Wilde et al. 1997) and appears to be under both endocrine and local
regulation. In rats, a deficiency of prolactin and growth hormone causes apoptosis in the
mammary gland, which is reversible by prolactin treatment (Travers et al. 1996). In women,
Hennart et al. (1981) found that prolactin concentrations in blood samples collected before
breast feeds decreased gradually from 1-3 months to 12-15 months, then dropped sharply at
15-18 months to concentrations not different from non-pregnant non-lactating women. Our
data showed that the breast volume returned to pre-conception size on average at 15 months,
consistent with apoptosis occurring as a result of decreased blood prolactin concentrations.
   Mammary apoptosis also appears to be associated with frequency of milk removal. Wilde et
al. (1997) suggested that frequent milking of goats may inhibit mammary apoptosis.
Consequently, a decline in feeding frequency would facilitate mammary apoptosis. The decrease
we measured in PBV between 12 and 15 months when the frequency decreased from 5-1 to
3-3 feeds per breast per day is consistent with this hypothesis. In addition to removing
inhibition of apoptosis, decline in the frequency of breast-feeds may lead to milk stasis, which
has been shown to induce apoptosis in the mammary gland of the rat (Quarrie et al. 1996).
   Whether the decline in breast volume is due to mobilization of fat from the breast, apoptosis
caused by endocrine and local factors, or a combination of these efFects, we have found that
even when the breast volume had returned to a minimum at 15 months, the combined 24 h
milk production from both breasts of the mothers was still between 95 and 315 g. Hennart et
al. (1981) also found 24 h milk production of between 150 and 300 g from 15-18 months
until 27-30 months. This suggests that while proliferation of breast tissue is necessary for
sufficient milk production to sustain an infant, the breast does not need to be enlarged above
pre-conception size to continue significant milk production. Further studies are needed to
identify the proportions of different tissues in the lactating and quiescent breast.
   The lack of correlation between storage capacity of the breast and PBV, when each
measurement time was analysed individually, implies that the storage capacity is not
dependent on PBV, but rather both are decreasing with time.
   Our finding of a relationship between the sum of the storage capacity of left and right
breasts and the sum of the 24 h milk production from left and right breasts, when these
measurements over the lactation period were incorporated, is in contrast to Daly et al.
(1993b) who found no relationship. However, the subjects in that study were between 4 and
10 months of lactation, and we also found no significant relationship at 4, 6 or 9 months.
Treating left and right breasts individually, storage capacity was strongly related to the 24 h
milk production both when these measurements over the lactation period were incorporated,
and at each measurement time between 1 and 12 months. Analysis of the data of Daly et al.


                 Downloaded from Exp Physiol (ep.physoc.org) by guest on August 22, 2009
-.
446                                 J. C. KENT AND OTHERS

(1993b) also shows a relationship between the storage capacity of each breast and the 24 h
milk production from that breast (r2 = 0-348, P = 0-0039, nb = 22).
  More than 20 % of the stored milk remained in each breast after at least two feeds during all
24 h measurement periods. That is, the infant demand for milk was usually satisfied before the
breast was empty of available milk. Therefore, the storage capacity was not limiting the infant's
intake, but rather responding to the degree of emptying. The only exception was the left breast
of subject 7 which was consistently emptied at 1, 2 and 4 months. It is of interest that the left
breast of this subject always produced less milk than the right, and that the infant she was
feeding during the current study and her previous infant both weaned themselves from this
breast before the right breast.
  Current growth charts are based on data from a sample of predominantly formula-fed
infants. The high growth rate of the infants we measured over the first 2 months was consistent
with the finding of Dewey et al. (1995) that breast-fed infants grow more rapidly in the first
2 months compared with current growth charts. The lower growth rate between 2 and
12 months was also consistent with the finding of Dewey et al. (1995) that breast-fed infants
grow less rapidly from 3 to 12 months when compared with current growth charts. The
relationship between the average growth rate over the first 6 months and the average daily
breast milk intake suggests that milk production of the mother is either limiting growth rate or
responding to infant appetite. Since all but one of the breasts was not consistently emptied, it
would appear that each mother had the potential to produce more milk. Furthermore milk
production, as well as storage capacity, was responding to the infant demand for milk.
  In conclusion, we have found that milk production, breast volume and storage capacity all
declined after 6 months of lactation. However, significant milk production persisted after the
breast had returned to pre-conception volume at 15 months of lactation. Milk production was
not dependent on PBV at any stage of lactation. Milk production was closely related to the
storage capacity of the breast, and both were apparently responding to the infant demand for
milk mediated by the degree of emptying of the breast. Therefore, our data are consistent with
the premise that milk production responds to infant demand throughout lactation.
We would like especially to thank the volunteer subjects, their families and the Nursing Mothers'
Association of Australia. We thank Lyle Gurrin for statistical advice, and Dijana Mihic and Tracey
Williams for technical assistance. The project was supported by the National Health and Medical
Research Council and the Grains Research and Development Corporation/Meadow Lea.

                                          REFERENCES
ARTHUR, P. G., HARTMANN, P. E. & SMITH, M. (1987). Measurement of milk intake of breast-fed infants.
  Journal of Pediatric Gastroenterology and Nutrition 6, 758-763.
ATWOOD, C. S. & HARTMANN, P. E. (1992). Collection of fore and hind milk from the sow and the
  changes in milk composition during suckling. Journal of Dairy Research 59, 287-298.
Cox, D. B., KENT, J. C., CASEY, T. M., OWENS, R. A. & HARTMANN, P. E. (1999). Breast growth and the
  urinary excretion of lactose during human pregnancy and early lactation: endocrine relationships.
  Experimental Physiology 84, 421-434
Cox, D. B., OWENS, R. A. & HARTMANN, P. E. (1996). Blood and milk prolactin and the rate of milk
  synthesis in women. Experimental Physiology 81, 1007- 1020.
DALY, S. E. J., Di Rosso, A., OWENS, R. A. & HARTMANN, P. E..(1993a). Degree of breast emptying
  explains changes in the fat content, but not fatty acid composition, of human milk. Experimental
  Physiology 78, 741-755.


             Downloaded from Exp Physiol (ep.physoc.org) by guest on August 22, 2009
BREAST VOLUME AND MILK PRODUCTION                                         447
DALY, S. E. J., KENT, J. C., HUYNH, D. Q., OWENS, R. A., ALEXANDER, B. F., NG, K. C. & HARTMANN,
  P. E. (1992). The determination of short-term breast volume changes and the rate of synthesis of
  human milk using computerized breast measurement. Experimental Physiology 77, 79-87.
DALY, S. E. J., OWENS, R. A. & HARTMANN, P. E. (1993b). The short-term synthesis and infant-regulated
  removal of milk in lactating women. Experimental Physiology 78, 209-220.
DEWEY, K.G., FINLEY, D.A., STRODE, M.A. & LONNERDAL, B. (1986). Relationship of maternal age to
  breast milk volume and composition. In Human Lactation 2: Maternal and Environmental Factors,
  ed. HAMOSH, M. & GOLDMAN, A.S., pp. 263-273. Plenum Press, New York, London.
DEWEY, K.G. & LONNERDAL, B. (1983). Milk and nutrient intake of breast-fed infants from 1 to
  6 months: relation to growth and fatness. Journal of Pediatric Gastroenterology and Nutrition 2,
  497-506.
DEWEY, K. G., PEERSON, J. M., BROWN, K. H., KREBS, N. F., MICHAELSEN, K. F., PERSSON, L. A.,
  SALMENPERA, L., WHITEHEAD, R. G., YEUNG, D. L. & THE WORLD HEALTH ORGANIZATION WORKING
  GROUP ON INFANT GROWTH (1995). Growth of breast-fed infants deviates from current reference data:
  a pooled analysis of US, Canadian, and European data sets. Pediatrics 96, 495-503.
HARTMANN, P. E., SHERRIFF, J. & KENT, J. (1995). Maternal nutrition and the regulation of milk synthesis.
  Proceedings of the Nutrition Society 54, 379-389.
HENNART, P., DELOGNE-DESNOECK, H. Vis & ROBYN, C. (1981). Serum levels of prolactin and milk
  production in women during a lactation period of thirty months. Clinical Endocrinology 14, 349-353.
JENSEN, R. G. (1989). The Lipids of Human Milk. CRC Press, Boca Raton, FL, USA.
NEIFERT, M., DEMARZO, S., SEACAT, J., YOUNG, D., LEFF, M. & ORLEANS, M. (1990). The influence of
  breast surgery, breast appearance, and pregnancy-induced breast changes on lactation sufficiency as
  measured by infant weight gain. Bir-th 17, 31-38.
NEVILLE, M. C., ALLEN, J. C., ARCHER, P. C., CASEY, C. E., SEACAT, J., KELLER, R. P., LUTES, V. J. R. &
  NEIFERT, M. (1991). Studies in human lactation: milk volume and nutrient composition during weaning
  and lactogenesis. American Journal of Clinical Nutrition 54, 81-92.
QUARRIE, L. H.. ADDEY, C. V. P. & WILDE, C. J. (1996). Programmed cell death during mammary
  involution induced by weaning, litter removal and milk stasis. Journal of Cell Physiology 168,
  559-569.
STERN, I. & SHAPIRO, B. (1953). A rapid and simple method for the determination of esterified fatty acids
  and for total fatty acids in blood. Journal of Clinical Pathology 17, 184-187.
TRAVERS, M. T., BARBER, M. C., TONNER, E., QUARRIE, L., WILDE, C. J. & FLINT, D. J. (1996). The role of
  prolactin and growth hormone in the regulation of casein gene expression and mammary cell survival -
  relationships to milk synthesis and secretion. Endocrinology 137, 1530-1539.
US DEPARTMENT OF HEALTH, EDUCATION AND WELFARE (1977). NCHS growth curves for children,
  birth-18 years. DHEW publication (PHS) 78-1650.
WILDE, C. J., QUARRIE, L. H., TONNER, E., FLINT, D. J. & PEAKER, M. (1997). Mammary apoptosis.
  Livestock Production Science 50, 29-37.


                   Downloaded from Exp Physiol (ep.physoc.org) by guest on August 22, 2009

More Related Content

What's hot

PREGNANCY ASSOCIATED BIOMOLECULES
PREGNANCY ASSOCIATED BIOMOLECULESPREGNANCY ASSOCIATED BIOMOLECULES
PREGNANCY ASSOCIATED BIOMOLECULESJerome Andonissamy
 
Pathophysiology of preterm labor
Pathophysiology of preterm laborPathophysiology of preterm labor
Pathophysiology of preterm laborDr Praman Kushwah
 
A comparative study on the growth rate of the thymus and suprarenal glands of...
A comparative study on the growth rate of the thymus and suprarenal glands of...A comparative study on the growth rate of the thymus and suprarenal glands of...
A comparative study on the growth rate of the thymus and suprarenal glands of...iosrjce
 
Annals of Nutritional Disorders & Therapy
Annals of Nutritional Disorders & TherapyAnnals of Nutritional Disorders & Therapy
Annals of Nutritional Disorders & TherapyAustin Publishing Group
 
Nutritional Factors In Milk From Brazilian Mothers Delivering Small For Gesta...
Nutritional Factors In Milk From Brazilian Mothers Delivering Small For Gesta...Nutritional Factors In Milk From Brazilian Mothers Delivering Small For Gesta...
Nutritional Factors In Milk From Brazilian Mothers Delivering Small For Gesta...Biblioteca Virtual
 
Normal pregnancy sept 2019 classes
Normal pregnancy sept 2019 classesNormal pregnancy sept 2019 classes
Normal pregnancy sept 2019 classesmohamedshukrielmi
 
Nutrition in vlbw infants
Nutrition in vlbw infantsNutrition in vlbw infants
Nutrition in vlbw infantsVarsha Shah
 
Hemorrhage in early pregnancy / ABORTION
Hemorrhage in early pregnancy / ABORTIONHemorrhage in early pregnancy / ABORTION
Hemorrhage in early pregnancy / ABORTIONELIZEBETH RANI V
 
z96-251 Fetal Development in Wolves
z96-251 Fetal Development in Wolvesz96-251 Fetal Development in Wolves
z96-251 Fetal Development in Wolvestlhillis
 
Balance, Fit, Intrauterine Life and Lifelong Disease
Balance, Fit, Intrauterine Life and Lifelong Disease  Balance, Fit, Intrauterine Life and Lifelong Disease
Balance, Fit, Intrauterine Life and Lifelong Disease Salford Systems
 
Devi Pangeni - Phase Feeding of Sows during Gestation and Lactation
Devi Pangeni - Phase Feeding of Sows during Gestation and LactationDevi Pangeni - Phase Feeding of Sows during Gestation and Lactation
Devi Pangeni - Phase Feeding of Sows during Gestation and LactationJohn Blue
 
Prenatal development&birth 3
Prenatal development&birth 3Prenatal development&birth 3
Prenatal development&birth 3姿儀 汪
 

What's hot (20)

Labor part one
Labor part oneLabor part one
Labor part one
 
PREGNANCY ASSOCIATED BIOMOLECULES
PREGNANCY ASSOCIATED BIOMOLECULESPREGNANCY ASSOCIATED BIOMOLECULES
PREGNANCY ASSOCIATED BIOMOLECULES
 
The Normal Breastfed Baby
The Normal Breastfed BabyThe Normal Breastfed Baby
The Normal Breastfed Baby
 
Pathophysiology of preterm labor
Pathophysiology of preterm laborPathophysiology of preterm labor
Pathophysiology of preterm labor
 
A comparative study on the growth rate of the thymus and suprarenal glands of...
A comparative study on the growth rate of the thymus and suprarenal glands of...A comparative study on the growth rate of the thymus and suprarenal glands of...
A comparative study on the growth rate of the thymus and suprarenal glands of...
 
Annals of Nutritional Disorders & Therapy
Annals of Nutritional Disorders & TherapyAnnals of Nutritional Disorders & Therapy
Annals of Nutritional Disorders & Therapy
 
Updated lecture 58
Updated lecture 58 Updated lecture 58
Updated lecture 58
 
Nutritional Factors In Milk From Brazilian Mothers Delivering Small For Gesta...
Nutritional Factors In Milk From Brazilian Mothers Delivering Small For Gesta...Nutritional Factors In Milk From Brazilian Mothers Delivering Small For Gesta...
Nutritional Factors In Milk From Brazilian Mothers Delivering Small For Gesta...
 
Condicion corporal vaca
Condicion corporal vacaCondicion corporal vaca
Condicion corporal vaca
 
Normal pregnancy sept 2019 classes
Normal pregnancy sept 2019 classesNormal pregnancy sept 2019 classes
Normal pregnancy sept 2019 classes
 
Nutrition in vlbw infants
Nutrition in vlbw infantsNutrition in vlbw infants
Nutrition in vlbw infants
 
Maternal Conditions and Breastfeeding
Maternal Conditions and BreastfeedingMaternal Conditions and Breastfeeding
Maternal Conditions and Breastfeeding
 
Hemorrhage in early pregnancy / ABORTION
Hemorrhage in early pregnancy / ABORTIONHemorrhage in early pregnancy / ABORTION
Hemorrhage in early pregnancy / ABORTION
 
Breastfeeding Supporting Health Care
Breastfeeding Supporting Health CareBreastfeeding Supporting Health Care
Breastfeeding Supporting Health Care
 
1 s2.0-s0570178313000250-main
1 s2.0-s0570178313000250-main1 s2.0-s0570178313000250-main
1 s2.0-s0570178313000250-main
 
z96-251 Fetal Development in Wolves
z96-251 Fetal Development in Wolvesz96-251 Fetal Development in Wolves
z96-251 Fetal Development in Wolves
 
Balance, Fit, Intrauterine Life and Lifelong Disease
Balance, Fit, Intrauterine Life and Lifelong Disease  Balance, Fit, Intrauterine Life and Lifelong Disease
Balance, Fit, Intrauterine Life and Lifelong Disease
 
Devi Pangeni - Phase Feeding of Sows during Gestation and Lactation
Devi Pangeni - Phase Feeding of Sows during Gestation and LactationDevi Pangeni - Phase Feeding of Sows during Gestation and Lactation
Devi Pangeni - Phase Feeding of Sows during Gestation and Lactation
 
Prenatal development&birth 3
Prenatal development&birth 3Prenatal development&birth 3
Prenatal development&birth 3
 
Handout Prenatal
Handout PrenatalHandout Prenatal
Handout Prenatal
 

Viewers also liked

Wonderful World Of Window Treatments
Wonderful World Of Window TreatmentsWonderful World Of Window Treatments
Wonderful World Of Window TreatmentsDECDEN
 
Forever Flowing 2 2
Forever Flowing 2 2Forever Flowing 2 2
Forever Flowing 2 2Geminiasp
 
Comunica city#sce2014
Comunica city#sce2014Comunica city#sce2014
Comunica city#sce2014ComunicaCity
 
Model for Improvement and ROI in IT, 4CIO 03/06/2010
Model for Improvement and ROI in IT, 4CIO 03/06/2010Model for Improvement and ROI in IT, 4CIO 03/06/2010
Model for Improvement and ROI in IT, 4CIO 03/06/2010Michael Kozloff
 
Startup location
Startup locationStartup location
Startup locationMark Essel
 
National Society of Black Engineers 36th Annual Conference Toronto Presentation
National Society of Black Engineers 36th Annual Conference Toronto PresentationNational Society of Black Engineers 36th Annual Conference Toronto Presentation
National Society of Black Engineers 36th Annual Conference Toronto PresentationMeltin Bell
 
Методы расчета отдачи на инвестиции (ROI) в технологии информационной безопас...
Методы расчета отдачи на инвестиции (ROI) в технологии информационной безопас...Методы расчета отдачи на инвестиции (ROI) в технологии информационной безопас...
Методы расчета отдачи на инвестиции (ROI) в технологии информационной безопас...Michael Kozloff
 
fast track.to - Meanwhile behind the Great Firewall
fast track.to - Meanwhile behind the Great Firewallfast track.to - Meanwhile behind the Great Firewall
fast track.to - Meanwhile behind the Great FirewallJuha Lassila
 
A 1 ppt excercis exx
A 1 ppt excercis exxA 1 ppt excercis exx
A 1 ppt excercis exxJOHN WALKER
 
EvoluçãO Da Pesquisa Em Aleitamento Materno
EvoluçãO Da Pesquisa Em Aleitamento MaternoEvoluçãO Da Pesquisa Em Aleitamento Materno
EvoluçãO Da Pesquisa Em Aleitamento MaternoBiblioteca Virtual
 
Jurnal TPSDP Student Grant
Jurnal TPSDP Student GrantJurnal TPSDP Student Grant
Jurnal TPSDP Student GrantSandi KH
 

Viewers also liked (20)

Wonderful World Of Window Treatments
Wonderful World Of Window TreatmentsWonderful World Of Window Treatments
Wonderful World Of Window Treatments
 
Forever Flowing 2 2
Forever Flowing 2 2Forever Flowing 2 2
Forever Flowing 2 2
 
Comunica city#sce2014
Comunica city#sce2014Comunica city#sce2014
Comunica city#sce2014
 
Lead Nurturing
Lead NurturingLead Nurturing
Lead Nurturing
 
Model for Improvement and ROI in IT, 4CIO 03/06/2010
Model for Improvement and ROI in IT, 4CIO 03/06/2010Model for Improvement and ROI in IT, 4CIO 03/06/2010
Model for Improvement and ROI in IT, 4CIO 03/06/2010
 
Glosarios
GlosariosGlosarios
Glosarios
 
Startup location
Startup locationStartup location
Startup location
 
Chisholm Gallery/Leslie Shiels Canine Culture 2
Chisholm Gallery/Leslie Shiels Canine Culture 2Chisholm Gallery/Leslie Shiels Canine Culture 2
Chisholm Gallery/Leslie Shiels Canine Culture 2
 
National Society of Black Engineers 36th Annual Conference Toronto Presentation
National Society of Black Engineers 36th Annual Conference Toronto PresentationNational Society of Black Engineers 36th Annual Conference Toronto Presentation
National Society of Black Engineers 36th Annual Conference Toronto Presentation
 
Kennedy & Bouvier
Kennedy & Bouvier Kennedy & Bouvier
Kennedy & Bouvier
 
Life of Sam
Life of SamLife of Sam
Life of Sam
 
Методы расчета отдачи на инвестиции (ROI) в технологии информационной безопас...
Методы расчета отдачи на инвестиции (ROI) в технологии информационной безопас...Методы расчета отдачи на инвестиции (ROI) в технологии информационной безопас...
Методы расчета отдачи на инвестиции (ROI) в технологии информационной безопас...
 
fast track.to - Meanwhile behind the Great Firewall
fast track.to - Meanwhile behind the Great Firewallfast track.to - Meanwhile behind the Great Firewall
fast track.to - Meanwhile behind the Great Firewall
 
Collegio 2013
Collegio  2013Collegio  2013
Collegio 2013
 
TKAM
TKAMTKAM
TKAM
 
A 1 ppt excercis exx
A 1 ppt excercis exxA 1 ppt excercis exx
A 1 ppt excercis exx
 
EvoluçãO Da Pesquisa Em Aleitamento Materno
EvoluçãO Da Pesquisa Em Aleitamento MaternoEvoluçãO Da Pesquisa Em Aleitamento Materno
EvoluçãO Da Pesquisa Em Aleitamento Materno
 
Flex
FlexFlex
Flex
 
Jurnal TPSDP Student Grant
Jurnal TPSDP Student GrantJurnal TPSDP Student Grant
Jurnal TPSDP Student Grant
 
Evidence On The Long Term
Evidence On The Long TermEvidence On The Long Term
Evidence On The Long Term
 

Similar to Breast Volume And Milk Production During Extended Lactation In Women

Is increased fat content of hindmilk due to the size or the number of milk fa...
Is increased fat content of hindmilk due to the size or the number of milk fa...Is increased fat content of hindmilk due to the size or the number of milk fa...
Is increased fat content of hindmilk due to the size or the number of milk fa...Prof. Marcus Renato de Carvalho
 
CLINICAL BRIEFA Quality Improvement Initiative Improving .docx
CLINICAL BRIEFA Quality Improvement Initiative Improving .docxCLINICAL BRIEFA Quality Improvement Initiative Improving .docx
CLINICAL BRIEFA Quality Improvement Initiative Improving .docxbartholomeocoombs
 
CLINICAL BRIEFA Quality Improvement Initiative Improving .docx
CLINICAL BRIEFA Quality Improvement Initiative Improving .docxCLINICAL BRIEFA Quality Improvement Initiative Improving .docx
CLINICAL BRIEFA Quality Improvement Initiative Improving .docxmccormicknadine86
 
Descenso fetal en trabajo de parto
Descenso fetal en trabajo de partoDescenso fetal en trabajo de parto
Descenso fetal en trabajo de partorubenhuaraz
 
The Optimal Duration Of Exclusive Breastfeeding
The Optimal Duration Of Exclusive BreastfeedingThe Optimal Duration Of Exclusive Breastfeeding
The Optimal Duration Of Exclusive BreastfeedingBiblioteca Virtual
 
Aleitamento materno e adiposidade adulta
Aleitamento materno e adiposidade adultaAleitamento materno e adiposidade adulta
Aleitamento materno e adiposidade adultaLaped Ufrn
 
Induction and augmentation of labour by dr jograjiya
Induction and augmentation of labour by dr jograjiyaInduction and augmentation of labour by dr jograjiya
Induction and augmentation of labour by dr jograjiyaJograjiya Gelabhai Raghubhai
 
Drs. Rossi and Shreve’s CMC Abdominal Imaging Mastery Project: June Cases
Drs. Rossi and Shreve’s CMC Abdominal Imaging Mastery Project: June CasesDrs. Rossi and Shreve’s CMC Abdominal Imaging Mastery Project: June Cases
Drs. Rossi and Shreve’s CMC Abdominal Imaging Mastery Project: June CasesSean M. Fox
 
A new growth chart for preterm babies
A new growth chart for preterm babiesA new growth chart for preterm babies
A new growth chart for preterm babiesgisa_legal
 
Risk Factors For Excess Weight Loss And Hypernatremia In Exclusively Breast F...
Risk Factors For Excess Weight Loss And Hypernatremia In Exclusively Breast F...Risk Factors For Excess Weight Loss And Hypernatremia In Exclusively Breast F...
Risk Factors For Excess Weight Loss And Hypernatremia In Exclusively Breast F...Biblioteca Virtual
 
Breastfeeding Continues To Increase Into The New Millennium
Breastfeeding Continues To Increase Into The New MillenniumBreastfeeding Continues To Increase Into The New Millennium
Breastfeeding Continues To Increase Into The New MillenniumBiblioteca Virtual
 
Estimation of Fetal Size and Weight using Various Formulas
Estimation of Fetal Size and Weight using Various FormulasEstimation of Fetal Size and Weight using Various Formulas
Estimation of Fetal Size and Weight using Various Formulasijtsrd
 
Prof.pushpamala research paper publication 1440 fetal size estimation
Prof.pushpamala research paper publication 1440 fetal size estimationProf.pushpamala research paper publication 1440 fetal size estimation
Prof.pushpamala research paper publication 1440 fetal size estimationDr.Pushpamala Ramaiah
 
Trends In Infant Nutrition In Saudi Arabia
Trends In Infant Nutrition In Saudi ArabiaTrends In Infant Nutrition In Saudi Arabia
Trends In Infant Nutrition In Saudi ArabiaBiblioteca Virtual
 
The comparison of dinoprostone and vagiprost for induction of lobar in post t...
The comparison of dinoprostone and vagiprost for induction of lobar in post t...The comparison of dinoprostone and vagiprost for induction of lobar in post t...
The comparison of dinoprostone and vagiprost for induction of lobar in post t...iosrphr_editor
 

Similar to Breast Volume And Milk Production During Extended Lactation In Women (20)

Breastfeeding update
Breastfeeding updateBreastfeeding update
Breastfeeding update
 
Is increased fat content of hindmilk due to the size or the number of milk fa...
Is increased fat content of hindmilk due to the size or the number of milk fa...Is increased fat content of hindmilk due to the size or the number of milk fa...
Is increased fat content of hindmilk due to the size or the number of milk fa...
 
CLINICAL BRIEFA Quality Improvement Initiative Improving .docx
CLINICAL BRIEFA Quality Improvement Initiative Improving .docxCLINICAL BRIEFA Quality Improvement Initiative Improving .docx
CLINICAL BRIEFA Quality Improvement Initiative Improving .docx
 
CLINICAL BRIEFA Quality Improvement Initiative Improving .docx
CLINICAL BRIEFA Quality Improvement Initiative Improving .docxCLINICAL BRIEFA Quality Improvement Initiative Improving .docx
CLINICAL BRIEFA Quality Improvement Initiative Improving .docx
 
Descenso fetal en trabajo de parto
Descenso fetal en trabajo de partoDescenso fetal en trabajo de parto
Descenso fetal en trabajo de parto
 
The Optimal Duration Of Exclusive Breastfeeding
The Optimal Duration Of Exclusive BreastfeedingThe Optimal Duration Of Exclusive Breastfeeding
The Optimal Duration Of Exclusive Breastfeeding
 
Clinical assessment of Fetal weight estimation using Johnson's formula & Ultr...
Clinical assessment of Fetal weight estimation using Johnson's formula & Ultr...Clinical assessment of Fetal weight estimation using Johnson's formula & Ultr...
Clinical assessment of Fetal weight estimation using Johnson's formula & Ultr...
 
Aleitamento materno e adiposidade adulta
Aleitamento materno e adiposidade adultaAleitamento materno e adiposidade adulta
Aleitamento materno e adiposidade adulta
 
Breast feeding
Breast feedingBreast feeding
Breast feeding
 
Induction and augmentation of labour by dr jograjiya
Induction and augmentation of labour by dr jograjiyaInduction and augmentation of labour by dr jograjiya
Induction and augmentation of labour by dr jograjiya
 
Comparative Study on Macroscopic Morphology of Human Placenta in Preterm, Ter...
Comparative Study on Macroscopic Morphology of Human Placenta in Preterm, Ter...Comparative Study on Macroscopic Morphology of Human Placenta in Preterm, Ter...
Comparative Study on Macroscopic Morphology of Human Placenta in Preterm, Ter...
 
Drs. Rossi and Shreve’s CMC Abdominal Imaging Mastery Project: June Cases
Drs. Rossi and Shreve’s CMC Abdominal Imaging Mastery Project: June CasesDrs. Rossi and Shreve’s CMC Abdominal Imaging Mastery Project: June Cases
Drs. Rossi and Shreve’s CMC Abdominal Imaging Mastery Project: June Cases
 
A new growth chart for preterm babies
A new growth chart for preterm babiesA new growth chart for preterm babies
A new growth chart for preterm babies
 
Labor
LaborLabor
Labor
 
Risk Factors For Excess Weight Loss And Hypernatremia In Exclusively Breast F...
Risk Factors For Excess Weight Loss And Hypernatremia In Exclusively Breast F...Risk Factors For Excess Weight Loss And Hypernatremia In Exclusively Breast F...
Risk Factors For Excess Weight Loss And Hypernatremia In Exclusively Breast F...
 
Breastfeeding Continues To Increase Into The New Millennium
Breastfeeding Continues To Increase Into The New MillenniumBreastfeeding Continues To Increase Into The New Millennium
Breastfeeding Continues To Increase Into The New Millennium
 
Estimation of Fetal Size and Weight using Various Formulas
Estimation of Fetal Size and Weight using Various FormulasEstimation of Fetal Size and Weight using Various Formulas
Estimation of Fetal Size and Weight using Various Formulas
 
Prof.pushpamala research paper publication 1440 fetal size estimation
Prof.pushpamala research paper publication 1440 fetal size estimationProf.pushpamala research paper publication 1440 fetal size estimation
Prof.pushpamala research paper publication 1440 fetal size estimation
 
Trends In Infant Nutrition In Saudi Arabia
Trends In Infant Nutrition In Saudi ArabiaTrends In Infant Nutrition In Saudi Arabia
Trends In Infant Nutrition In Saudi Arabia
 
The comparison of dinoprostone and vagiprost for induction of lobar in post t...
The comparison of dinoprostone and vagiprost for induction of lobar in post t...The comparison of dinoprostone and vagiprost for induction of lobar in post t...
The comparison of dinoprostone and vagiprost for induction of lobar in post t...
 

More from Biblioteca Virtual

Aleitamento Materno Manual De OrientaçãO
Aleitamento Materno   Manual De OrientaçãOAleitamento Materno   Manual De OrientaçãO
Aleitamento Materno Manual De OrientaçãOBiblioteca Virtual
 
Statistical Report Of The 2008 Iblce Examination
Statistical Report Of The 2008 Iblce ExaminationStatistical Report Of The 2008 Iblce Examination
Statistical Report Of The 2008 Iblce ExaminationBiblioteca Virtual
 
Lactation Management Self Study Modules Level I
Lactation Management Self Study Modules Level ILactation Management Self Study Modules Level I
Lactation Management Self Study Modules Level IBiblioteca Virtual
 
AvaliaçãO Do Impacto De Um Programa De Puericultura Na PromoçãO Da Amamentaçã...
AvaliaçãO Do Impacto De Um Programa De Puericultura Na PromoçãO Da Amamentaçã...AvaliaçãO Do Impacto De Um Programa De Puericultura Na PromoçãO Da Amamentaçã...
AvaliaçãO Do Impacto De Um Programa De Puericultura Na PromoçãO Da Amamentaçã...Biblioteca Virtual
 
AnáLise Da Efetividade De Um Programa De Incentivo Ao Aleitamento Materno Exc...
AnáLise Da Efetividade De Um Programa De Incentivo Ao Aleitamento Materno Exc...AnáLise Da Efetividade De Um Programa De Incentivo Ao Aleitamento Materno Exc...
AnáLise Da Efetividade De Um Programa De Incentivo Ao Aleitamento Materno Exc...Biblioteca Virtual
 
Statistical Report Of The 2008 Iblce Examination
Statistical Report Of The 2008 Iblce ExaminationStatistical Report Of The 2008 Iblce Examination
Statistical Report Of The 2008 Iblce ExaminationBiblioteca Virtual
 
Uk Formula Marketing Practices
Uk Formula Marketing PracticesUk Formula Marketing Practices
Uk Formula Marketing PracticesBiblioteca Virtual
 
Statistical Report Of The 2008 Iblce Examination
Statistical Report Of The 2008 Iblce ExaminationStatistical Report Of The 2008 Iblce Examination
Statistical Report Of The 2008 Iblce ExaminationBiblioteca Virtual
 
PromoçãO, ProtecçãO E Apoio. Apoio RepresentaçõEs Sociais Em Aleitamento Materno
PromoçãO, ProtecçãO E Apoio. Apoio RepresentaçõEs Sociais Em Aleitamento MaternoPromoçãO, ProtecçãO E Apoio. Apoio RepresentaçõEs Sociais Em Aleitamento Materno
PromoçãO, ProtecçãO E Apoio. Apoio RepresentaçõEs Sociais Em Aleitamento MaternoBiblioteca Virtual
 
O Ensino De Aleitamento Materno Na GraduaçãO Em Medicina Um Estudo De Caso
O Ensino De Aleitamento Materno Na GraduaçãO Em Medicina   Um Estudo De CasoO Ensino De Aleitamento Materno Na GraduaçãO Em Medicina   Um Estudo De Caso
O Ensino De Aleitamento Materno Na GraduaçãO Em Medicina Um Estudo De CasoBiblioteca Virtual
 
No Seio Da FamíLia AmamentaçãO E PromoçãO Da SaúDe No Programa De SaúDe Da ...
No Seio Da FamíLia   AmamentaçãO E PromoçãO Da SaúDe No Programa De SaúDe Da ...No Seio Da FamíLia   AmamentaçãO E PromoçãO Da SaúDe No Programa De SaúDe Da ...
No Seio Da FamíLia AmamentaçãO E PromoçãO Da SaúDe No Programa De SaúDe Da ...Biblioteca Virtual
 
Lactation Management Self Study Modules Level I
Lactation Management Self Study Modules Level ILactation Management Self Study Modules Level I
Lactation Management Self Study Modules Level IBiblioteca Virtual
 
AnáLise Da Efetividade De Um Programa De Incentivo Ao Aleitamento Materno Exc...
AnáLise Da Efetividade De Um Programa De Incentivo Ao Aleitamento Materno Exc...AnáLise Da Efetividade De Um Programa De Incentivo Ao Aleitamento Materno Exc...
AnáLise Da Efetividade De Um Programa De Incentivo Ao Aleitamento Materno Exc...Biblioteca Virtual
 
AvaliaçãO Do Impacto De Um Programa De Puericultura Na PromoçãO Da Amamentaçã...
AvaliaçãO Do Impacto De Um Programa De Puericultura Na PromoçãO Da Amamentaçã...AvaliaçãO Do Impacto De Um Programa De Puericultura Na PromoçãO Da Amamentaçã...
AvaliaçãO Do Impacto De Um Programa De Puericultura Na PromoçãO Da Amamentaçã...Biblioteca Virtual
 
Iblce Regional Office In Europe Candidate Information Guide
Iblce Regional Office In Europe   Candidate Information GuideIblce Regional Office In Europe   Candidate Information Guide
Iblce Regional Office In Europe Candidate Information GuideBiblioteca Virtual
 
A ImportâNcia Da AmamentaçãO Para A SaúDe Da Mulher Que Amamenta
A ImportâNcia Da AmamentaçãO Para A SaúDe Da Mulher Que AmamentaA ImportâNcia Da AmamentaçãO Para A SaúDe Da Mulher Que Amamenta
A ImportâNcia Da AmamentaçãO Para A SaúDe Da Mulher Que AmamentaBiblioteca Virtual
 
AmamentaçãO E Uso De AntiinflamatóRios NãO EsteróIdes Pela Nutriz InformaçõEs...
AmamentaçãO E Uso De AntiinflamatóRios NãO EsteróIdes Pela Nutriz InformaçõEs...AmamentaçãO E Uso De AntiinflamatóRios NãO EsteróIdes Pela Nutriz InformaçõEs...
AmamentaçãO E Uso De AntiinflamatóRios NãO EsteróIdes Pela Nutriz InformaçõEs...Biblioteca Virtual
 
Contribution Of Environmental Factors To The Risk Of Male Infertility
Contribution Of Environmental Factors To The Risk Of Male InfertilityContribution Of Environmental Factors To The Risk Of Male Infertility
Contribution Of Environmental Factors To The Risk Of Male InfertilityBiblioteca Virtual
 
Contraindications To Breastfeeding
Contraindications To BreastfeedingContraindications To Breastfeeding
Contraindications To BreastfeedingBiblioteca Virtual
 

More from Biblioteca Virtual (20)

Aleitamento Materno Manual De OrientaçãO
Aleitamento Materno   Manual De OrientaçãOAleitamento Materno   Manual De OrientaçãO
Aleitamento Materno Manual De OrientaçãO
 
Statistical Report Of The 2008 Iblce Examination
Statistical Report Of The 2008 Iblce ExaminationStatistical Report Of The 2008 Iblce Examination
Statistical Report Of The 2008 Iblce Examination
 
Lactation Management Self Study Modules Level I
Lactation Management Self Study Modules Level ILactation Management Self Study Modules Level I
Lactation Management Self Study Modules Level I
 
AvaliaçãO Do Impacto De Um Programa De Puericultura Na PromoçãO Da Amamentaçã...
AvaliaçãO Do Impacto De Um Programa De Puericultura Na PromoçãO Da Amamentaçã...AvaliaçãO Do Impacto De Um Programa De Puericultura Na PromoçãO Da Amamentaçã...
AvaliaçãO Do Impacto De Um Programa De Puericultura Na PromoçãO Da Amamentaçã...
 
AnáLise Da Efetividade De Um Programa De Incentivo Ao Aleitamento Materno Exc...
AnáLise Da Efetividade De Um Programa De Incentivo Ao Aleitamento Materno Exc...AnáLise Da Efetividade De Um Programa De Incentivo Ao Aleitamento Materno Exc...
AnáLise Da Efetividade De Um Programa De Incentivo Ao Aleitamento Materno Exc...
 
Statistical Report Of The 2008 Iblce Examination
Statistical Report Of The 2008 Iblce ExaminationStatistical Report Of The 2008 Iblce Examination
Statistical Report Of The 2008 Iblce Examination
 
Uk Formula Marketing Practices
Uk Formula Marketing PracticesUk Formula Marketing Practices
Uk Formula Marketing Practices
 
Statistical Report Of The 2008 Iblce Examination
Statistical Report Of The 2008 Iblce ExaminationStatistical Report Of The 2008 Iblce Examination
Statistical Report Of The 2008 Iblce Examination
 
PromoçãO, ProtecçãO E Apoio. Apoio RepresentaçõEs Sociais Em Aleitamento Materno
PromoçãO, ProtecçãO E Apoio. Apoio RepresentaçõEs Sociais Em Aleitamento MaternoPromoçãO, ProtecçãO E Apoio. Apoio RepresentaçõEs Sociais Em Aleitamento Materno
PromoçãO, ProtecçãO E Apoio. Apoio RepresentaçõEs Sociais Em Aleitamento Materno
 
O Ensino De Aleitamento Materno Na GraduaçãO Em Medicina Um Estudo De Caso
O Ensino De Aleitamento Materno Na GraduaçãO Em Medicina   Um Estudo De CasoO Ensino De Aleitamento Materno Na GraduaçãO Em Medicina   Um Estudo De Caso
O Ensino De Aleitamento Materno Na GraduaçãO Em Medicina Um Estudo De Caso
 
No Seio Da FamíLia AmamentaçãO E PromoçãO Da SaúDe No Programa De SaúDe Da ...
No Seio Da FamíLia   AmamentaçãO E PromoçãO Da SaúDe No Programa De SaúDe Da ...No Seio Da FamíLia   AmamentaçãO E PromoçãO Da SaúDe No Programa De SaúDe Da ...
No Seio Da FamíLia AmamentaçãO E PromoçãO Da SaúDe No Programa De SaúDe Da ...
 
Lactation Management Self Study Modules Level I
Lactation Management Self Study Modules Level ILactation Management Self Study Modules Level I
Lactation Management Self Study Modules Level I
 
AnáLise Da Efetividade De Um Programa De Incentivo Ao Aleitamento Materno Exc...
AnáLise Da Efetividade De Um Programa De Incentivo Ao Aleitamento Materno Exc...AnáLise Da Efetividade De Um Programa De Incentivo Ao Aleitamento Materno Exc...
AnáLise Da Efetividade De Um Programa De Incentivo Ao Aleitamento Materno Exc...
 
AvaliaçãO Do Impacto De Um Programa De Puericultura Na PromoçãO Da Amamentaçã...
AvaliaçãO Do Impacto De Um Programa De Puericultura Na PromoçãO Da Amamentaçã...AvaliaçãO Do Impacto De Um Programa De Puericultura Na PromoçãO Da Amamentaçã...
AvaliaçãO Do Impacto De Um Programa De Puericultura Na PromoçãO Da Amamentaçã...
 
Iblce Regional Office In Europe Candidate Information Guide
Iblce Regional Office In Europe   Candidate Information GuideIblce Regional Office In Europe   Candidate Information Guide
Iblce Regional Office In Europe Candidate Information Guide
 
A ImportâNcia Da AmamentaçãO Para A SaúDe Da Mulher Que Amamenta
A ImportâNcia Da AmamentaçãO Para A SaúDe Da Mulher Que AmamentaA ImportâNcia Da AmamentaçãO Para A SaúDe Da Mulher Que Amamenta
A ImportâNcia Da AmamentaçãO Para A SaúDe Da Mulher Que Amamenta
 
AmamentaçãO E Uso De AntiinflamatóRios NãO EsteróIdes Pela Nutriz InformaçõEs...
AmamentaçãO E Uso De AntiinflamatóRios NãO EsteróIdes Pela Nutriz InformaçõEs...AmamentaçãO E Uso De AntiinflamatóRios NãO EsteróIdes Pela Nutriz InformaçõEs...
AmamentaçãO E Uso De AntiinflamatóRios NãO EsteróIdes Pela Nutriz InformaçõEs...
 
Anatomofisiologia[1]
Anatomofisiologia[1]Anatomofisiologia[1]
Anatomofisiologia[1]
 
Contribution Of Environmental Factors To The Risk Of Male Infertility
Contribution Of Environmental Factors To The Risk Of Male InfertilityContribution Of Environmental Factors To The Risk Of Male Infertility
Contribution Of Environmental Factors To The Risk Of Male Infertility
 
Contraindications To Breastfeeding
Contraindications To BreastfeedingContraindications To Breastfeeding
Contraindications To Breastfeeding
 

Breast Volume And Milk Production During Extended Lactation In Women

  • 1. Experimental Physiology (1999), 84, 435-447 Printed in Great Britain BREAST VOLUME AND MILK PRODUCTION DURING EXTENDED LACTATION IN WOMEN JACQUELINE C. KENT *, LEON MITOULAS, DAVID B. COX, ROBYN A. OWENS t AND PETER E. HARTMANN Departments of Biochemistry and t Computer Science, The University of Western Australia, Nedlands, WA 6907, Australia (MANUSCRIPT RECEIVED 16 JULY 1998, ACCEPTED 2 DECEMBER 1998) SUMMARY Quantitative measurements were made of relative breast volume and milk production from 1 month of lactation until 3 months after weaning, and the storage capacity of the breasts was calculated. The increase in breast tissue volume from before conception until 1 month of lactation was maintained for the first 6 months of lactation (means + S.E.M.) (190.3 ± 13-1 ml, number of breasts, nb = 46). During this period of exclusive breast-feeding, 24 h milk production from each breast remained relatively constant (453.6 + 20 1 g, nb = 48), and storage capacity was 209-9 + 11-0 ml (nb = 46). After 6 months, breast volume, milk production and storage capacity all decreased. There was a relationship between 24 h milk production and the storage capacity of the breasts, and these both appeared to be responding to infant demand for milk. At 15 months of lactation, the 24 h milk production of each breast was substantial (208.0 + 56-7 g, nb = 6), even though the breasts had returned to preconception size. This was associated with an apparent increased efficiency of the breast (milk production per unit breast tissue) after 6 months, which may have been due to redistribution of tissues within the breast. The possible causes of the decrease in breast volume are discussed. INTRODUCTION The computerized breast measurement (CBM) system (Daly et al. 1992), which measures breast volume, has been developed further to allow us to make quantitative longitudinal measurements of breast volume from before conception, throughout pregnancy, until 1 month of lactation (Cox et al. 1999). That study demonstrated the wide variability between women in the amount and pattern of breast growth during pregnancy. While Neifert et al. (1990) found an association between minimal prenatal breast enlargement and insufficient lactation up to 21 days after birth, Cox et al. (1999) found no such relationship. The relationship between breast size and milk production beyond 1 month of lactation has not previously been studied. Milk production is relatively constant over the first 6 months of lactation (Dewey & Lonnerdal, 1983; Hartmann et al. 1995; Cox et al. 1996). From 6 to 16 months milk production declines even if mothers are not deliberately weaning their infants (Neville et al. 1991). Furthermore, milk production during the first 6 months of lactation is not determined by the concentration of prolactin in the blood (Cox et al. 1996). It has been demonstrated that milk production 4- 10 months after birth responds to the demand for milk by infants (Daly et al. 1993b) but factors controlling milk production beyond this time have not been established. ; Corresponding author: jkent@cyllene.uwa.edu.au 1808 Downloaded from Exp Physiol (ep.physoc.org) by guest on August 22, 2009
  • 2. 436 J. C. KENT AND OTHERS As lactation proceeds, mothers are aware of changes in the size of their breasts, but these changes have never been quantified, and their physiological significance has not been determined. We aimed to measure the changes in breast volume from 1 month of lactation until weaning; to determine whether the breast returned to its original pre-conception volume; and to determine whether milk production throughout lactation was limited by either the size or storage capacity of the breast. METHODS Subjects The study was approved by the Committee for Human Rights at The University of Western Australia. The subjects were the same as described in Cox et al. (1999). Briefly, the eight subjects who had been studied throughout pregnancy fully breast-fed their infants for at least 6 months. All the infants were introduced to solid foods between 6 and 12 months of age, and complete weaning occurred between 18 and 24 months for subjects 1, 2, 3, 4, 7 (left breast) and 8. We measured their breast volume and 24 h milk production at 1, 2, 4, and 6 months of lactation, at 3-monthly intervals until weaning, and where possible 3 months after weaning. Subject 1 was unavailable for measurements after 9 months of lactation but returned for measurement after weaning. Subject 3 was only able to have 24 h milk production measured at 6 weeks, and breast volume and 24 h milk production at 6 and 12 months of lactation and after weaning. The final measurement of breast volume in subjects 5, 6 and 7 (right breast) was made between 30 and 33 months after birth. Their infants were still going to the breast between twice a day and once every two days, but the amount of milk taken from each breast was less than 70 g per day. Milk production Milk production from each breast was measured over a period of at least 24 h by test weighing the mother (Arthur et al. 1987). Milk samples (< 1 ml) were collected from each breast by either manual breast pump or hand expression into 5 ml polypropylene plastic vials, immediately before and after each breast feed. Samples were frozen as soon as possible and kept at -15 °C until analysis. Although subject 2 successfully breast-fed her infant, no milk samples were collected due to her inability to express milk. Breast volume Relative breast volume (RBV) (the volume of breast tissue and chest wall contained within an arbitrarily but repeatably drawn black line encompassing all the breast tissue) was measured in the Department of Biochemistry using the CBM system (Cox et al. 1999) during each 24 h period of measurement of milk production. Between one and four measurements were made on each breast over a period of up to 5 h. Milk samples (< 1 ml) were collected from each breast each time a breast volume measurement was made, and stored as above. Subject body weight and infant growth Subjects were weighed in the Department of Biochemistry before conception and during each occasion on which breast volume was measured. Subjects provided records of the birth weight of their infants as measured by midwives attending the birth, and weights of their infants up to 6 months of age as measured by the Community Health Nurse at each subject's Child Health Centre. Ester-ified fatty ac id mneasurement Total esterified fatty acids (EFA) were measured in all the milk samples by the method of Stcrn & Shapiro (1953) as modified by Atwood & Hartmann (1992). As 98 % of lipid in human milk is present as triacylglycerols (Jensen, 1989), thc EFA concentration of the samples vwas used as a measure of the fat contcnit of thc milk assumning an average molecular weight for milk triacylglycerols of 843 1 Da (DaLly et al. 1993a). 'Enpty' breast violIume RBV is a measurc of thc x olume of breast tissue a nd cliest x all in fronit of the planc definied by the black cllilsc. DuLring lactaLtion thi.s RBV also includes the volumic oft milk conitaincd in the brcLast at the tlime of Downloaded from Exp Physiol (ep.physoc.org) by guest on August 22, 2009
  • 3. BREAST VOLUME AND MILK PRODUCTION 437 measurement. Daly et al. (1993a) have described an equation which relates the fat content of the milk to the degree of fullness of the breast. Using this equation and the measured fat content of each sample, the degree of fullness of the breast at the particular time the sample was collected can be calculated (Cox et al. 1996). From the changes in degree of fullness from before to after each feed and the volumes of milk removed from the breast at each feed, the amount of milk remaining in the breast at each time can be calculated. The RBV measured by the CBM system can then be corrected for the amount of milk in the breast to give the 'empty' breast volume (EBV) (Cox et al. 1999). While the breast may never be actually empty, this is the minimum volume of the breast for that day and it can be used to represent the volume of breast tissue (glandular and fatty). The breast volumes quoted in this paper will be expressed as the difference between the calculated 'empty' breast volume and the pre-conception breast volume and are termed proliferated breast volumes (PBV). Thus, measurements of breast volume can be represented as follows: RBV = volume of breast tissue + volume of chest wall + volume of milk in the breast; EBV = RBV - calculated volume of milk in the breast; PBV = EBV - pre-conception RBV. That is, PBV represents the difference in the volume of breast tissue between the current measurement and the measurement made before conception. Storage capacity The storage capacity of the breast is the amount of milk calculated to be in the breast when it is full. Since no milk samples were collected from subject 2 we were unable to calculate either her EBV (and therefore PBV) or storage capacity, and her data are not included in this paper. Statistics Repeated measures analysis of variance was used to test significance of differences between times (SuperAnova, Abacus Concepts, Inc., Berkeley, CA, USA, 1987). Correlations and Student's paired t tests were performed using the StatView SE + graphics software package (Abacus Concepts). Results are presented as means + S.E.M. unless otherwise stated. P values greater than 0-05 are regarded as not significant. The number of subjects is represented by N and the number of breasts by nb. RESULTS Milk production and feeding frequency The 24 h milk production of each breast of each subject is shown in Fig. 1 and the mean 24 h milk production of all breasts in Fig. 2. For the first 6 months of lactation the 24 h milk production from each breast remained relatively constant, averaging 453-6 + 20-1 g (nb = 48) (Fig. 2). At 9 months of lactation the 24 h milk production from each breast (369-3 + 47-7 g, nb = 12) was significantly different from that at 1, 2 and 4 months (459.3 + 48.2 g, P = 0 029, nb = 12; 4500 + 40.4 g, P = 0-040, nb = 12 and 4497 + 34-5 g, P =0034, nb = 10, respectively), but not different from that at 6 months (425-7 + 39 4 g, n = 12b) or from the mean for each mother for 1-6 months. Between 9 and 12 months of lactation there was a significant decrease in 24 h milk production to 260 3 + 55;8 g (P = 0-029, nb = 10), with a further decrease to 109 2 + 47.7 g (P = 0006, n = 6) for subjects 5, 6 and 7 who were breast-feeding at 18 months. At 24 months each breast of these mothers was producing 57.4 + 41 7 g (n,b = 5). Apart fiom subject 7, there were no consistent bilateral differences in the milk production of the breasts of tlhe subjects. The mean total daily breast milk intake of the infants over the first 6 months ranged widely froin 574 + 60 g for subject 4 to 1 181 + 94 g for subjectl. During the first 12 months, each breast W.as suckled between 3 and 8 times per day, with mean values of' 64+ 0)3 (nj), = 12), 5 2 + 0 3 Oi1,) 12) and 51 + 0 3 (n,) = 10) tiines per day at 1, 6 and 1 2 months, respectively. FIom 15 to 24 montlhs each breast w"as suckled between 2 Downloaded from Exp Physiol (ep.physoc.org) by guest on August 22, 2009
  • 4. 438 J. C. KENT AND OTHERS 800 800 Subject 1 Subject 6 tK ; 600 -0. 600 11 400 400 200 -200 0 -200 I -200 . . . . 0 3 6 9 12 15 18 21 24 2 +3 0 3 6 9 12 15 18 21 24 27 w 800 Subject 3 800 Subject 7 O. - % 0) c 0 600 .4s 600 'J ,d ~0 400 400 -0 0 0. -c 200 200 . cwJ 0 0 0 H~ E -200 0 , 4| 1 | -200 | . . . . . .T 3 6 9 12 15 18 2 24 27' '0 3 6 9 12 15 18 21 24 27 w w+3 e E 800 F Subject 4 800 Subject 8 ~0 U) 600 600 a) -o - a) 400 400 .- a) 200 200 ' % 0 0 -200 , sIIs Is 200 . . * * I 11 1 24 + 0 3 6 9 1215 18 21 24 2w+3 800 Time after birth (months) Subject 5 600 6 I' 400 d 200 la E--L 0 -200 .1 I 0 3 6 9 12 15 18 21 24 27 w Time after birth (months) Fig. 1. For legend see facing page. Downloaded from Exp Physiol (ep.physoc.org) by guest on August 22, 2009
  • 5. BREAST VOLUME AND MILK PRODUCTION 439 500 200 4)400 (10 E1 _ (12) (12) E 0300 100 > 0.0 200 (0 E (10) c - 0 1100 1 (4) (7) (10) (7) 0 5) _-1 00 0 3 6 9 12 15 18 21 24 27 w w+3 Time after birth (months) Fig. 2. 24 h milk production (0) and proliferated breast volume (0) of left and right breasts of 6 subjects from 1 month of lactation until 3 months after weaning. w is the time of weaning, w + 3 is 3 months after weaning. Values are means with S.E.M. represented by vertical bars. Number of observations for each point is shown in parentheses. Zero proliferated breast volume is the volume of the breast before conception. and 6 times per day, with mean values of 3 3 + 0-3 (nb = 8) and 2 8 + 0-2 (nb = 5) times per day at 15 and 24 months, respectively. There was no change in the mean amount of milk consumed per feed from each breast during the first 9 months, ranging from 73.8 + 8.9 g (nb = 12) at 1 month to 83.8 + 7-2 g (nb = 12) at 6 months. This decreased to 50 4 + 9.8 g (nb = 10) and 531 ± 171 g (rb = 8) at 12 months and 15 months, respectively, then decreased further to 34-0 + 115 g (nb = 6), 25-3 + 8-5 g (nb = 7) and 26-5 + 21.3 g (nb = 5) at 18, 21 and 24 months, respectively. Breast volume The PBV of each breast of each subject is shown in Fig. I and the mean of all breasts in Fig. 2. For the first 6 months of lactation PBV remained relatively constant, averaging 190-3 + 13.1 ml (nb = 46) (Fig. 2). At 9 months of lactation the PBV (95.8 + 19 8 ml) was significantly different from that at 6 months (P = 0-003, nb = 12). The PBV at 12 months (78.8 + 15-6 ml, nb = 10) was not different from that at 9 months. By 15 months PBV had decreased (P = 0 035, nb = 6) and was not significantly different from preconception volume. There was no further change in PBV until weaning. There was no difference in PBV between measurements made both at weaning and 3 months later (subjects 4, 7 (left breast) and 8). The final RBV averaged 17 8 + 13-8 ml less than pre-conception RBV (nb = 14), but this difference was not significant. Apart from subject 7, there were no consistent bilateral differences in PBV of the subjects. There was a significant relationship between 24 h milk production and PBV when these measurements over the lactation period were incorporated (r2 = 0-428, P = 0 0001, nb = 105) Fig. 1. 24 h milk production (circles) and proliferated breast volume (squares) of 7 subjects from 1 month of lactation until 3 months after weaning. Open symbols represent the right breast, closed symbols represent the left breast. Arrow indicates time of weaning. w is the time of weaning, w + 3 is 3 months after weaning. For subject 7 the infant was weaned only from the left breast. Zero proliferated breast volume is the volume of the breast before conception. Downloaded from Exp Physiol (ep.physoc.org) by guest on August 22, 2009
  • 6. 440 .4 C. KENT AND OTHERS 800 600 6 400 . 0 j Co 200 - -2 -10 0 0 100 200 300 400 Proliferated breast volume (ml) Fi-. 3. Relaitioniship Mwete nl 24 h tiiillk pro-tductionl .rnd prroldeited.tt bi-c.ast VOILIIIC 16r lcf't aind i-ighit bi-catst.s ol 6 fio Itin 1inonth oflal.ctatiOll Lint il 3S iionth.s af-terwue',1111'11 subjccts (Figa. -onh( 7 e"LlchS subject anallysed individlually (ratnaing from 1- = 0-505, p = 0-0002, tC 3) aind for 2002 71l) 22? in subject 7, to 1-2 rnl 0-89)2, P 0--00()1, 71, 2(), in subject 5) (Fig. 4). However, when = eaclh mealsurement tim-e was anallysed individuallly, ther-e was no relaltionship between these par.ameter-s. As a1 mealsure of the 'efficiency' of the breast tissue, the raltio of the miean 24 h millik production to the miean PBV at1 eLich mieaisuI-emfent tilne va.S calculalted. Thils showed only a simall variation during the fir-st 6 moniths (2) 16 2 43 g rml-'), then inicrealsed to 3 85 g rml-' at 9 imonths and 330 g nml-' at 12 iontl0s. S'to7-age capacitil The chainoe in stor-bloe capacaity of the brea1sts is shown in Fig. 5. The avZer.ae storage calpacity ,at I)ot (1t )+2)2m,n 2) i ncreased to 2 31 .9 + 2 7.3 rl .I t 4 mioiiths (P-= 00016, m sI'l) = 10). This waIs follow!ed by *t decrease fl'IOm 6 to 9) nioitlths (234.6 + 17 5 to 174.5 + 11 7 ml, P =- (0) 0(, nl, = 12). Apart fi-oill subject 7, ther-e Nxere nio coinsisteiit bilaterall difHeerences in the storage capacities of the bieeealsts ot the subjectsl TFie.-. WRstt-ooio relntionship S storii ge clityatnd between cadi o4 h ptaoduction illefk 6hen these ineasurements f tr indimiduwal breasts uer i the lactation perieod noere iacoi-porsited(b2e 0588 =()000 1, n1, 83) (Fig. 6 z.lnd Table I1); and between the suii1 of' the storalge calp.lcity of left asdraght bmreofastsL ed of the 24 h eilstiodLctihenfroo leoft and right bieastls rhen these SLini p itneLmsureentsPeB the acmastiolu peientdtri eiwscolpoulated (h2i= sho 12, P = a) sma1l N = 43). o e 7 There tere sinificra6 t elatioi(sl0lps betgeen these mo pireas eted s8 at mlontla (92 n.739a, m P =00282g N m6), 2 ilonlhs (1_2 = 0)729, p = 0 0304, N = 6) and 1m2 thontlsS = 0827, (.2 P = 001 1'3, N = ), but not aIt 4, 6, ') or- 15) rnioitlis. There hans a ilatiogselicp betaeen storage cLpacity ofnd PBV ihe aeese setsureaents bret the lactation peoriod weredacorpoeiated (th l ct147, P =0erid04, 8ic ) However, opei i we = when elch xexrcemeinttifice rlatlnysed i edinidually, there wareto relsatioslip bethween the0se an s p parArmeters. Downloaded from Exp Physiol (ep.physoc.org) by guest on August 22, 2009
  • 7. BREAST VOLUME AND MILK PRODUCTION 441 800 Subject 1 Subject 6 O c 600 0 0 * J* 0 0- . -S 0 m C- 400 S E = 200 c' 0 800 0) c 600 0 -o 0 400 C- E -Ce 200 0 800 Subject 5 Subject 8 600 .o V 0 S ° 400 , 0 .E 0 200l c't 00 0 . . , .4 i . ----I . -. . -200 -100 0 100 200 300 400 -200 -100 0 100 200 300 400 Proliferated breast volume (ml) Proliferated breast volume (ml) Fig. 4. Relationship between 24 h milk production and proliferated breast volume for left and right breasts of 6 subjects (individual plots) from month of lactation until 3 months after weaning. At 1 month of lactation there was no relationship between the number of feeds per day and the storage capacity of the breast. While there was a decrease in the number of feeds per day as lactation progressed, the number of feeds per day was not dependent on the storage capacity either throughout lactation or during the first 6 months when milk production was relatively constant. Downloaded from Exp Physiol (ep.physoc.org) by guest on August 22, 2009
  • 8. 442 J. C. KENT AND OTHERS 300 8 200~ (0 (12) (12 0- (12) (12) a1) 0) 100l (3) 1 0 (2) 0 3 6 9 12 15 18 21 24 27 30 Time after birth (months) Fig. 5. Sloiage capatit of lcf t and ti-ht hieasts of (6 sLItjcCts ftol1 I 1 monlthl Lnlltil 24 imonthlis otf lactation. alues ate means Witi S.F.N. repiescncd b x rtical hlars. NLInIhetl- of oet OSCI''ations f1o`t eaich poillt is slhown inI patreniheCs.s 800 6 00 * ** * .0 o 0 * 0S * 400 s * 200 c' 200 0 0 0 100 200 300 400 Storage capacity (ml) Fit. 6. Rclationishipe beiwcsti the 24 hi iilk p i-odctction and tili stoIt age capacity for- left aind -ihtt bicasts of 6 sLhbjets fir0m 1 1tonh0ttl LIlItil 24 imonitlihs of lactatlitl. Subject bocdv weight ciml inCfant growt/h Subject body weight xxas significantly higher at I mlonth of' lacttion (67 8 + 4-2 klg) thaLn before conlceptioIn (64.7 + 3 4 ka, P = 0 035, ' = 6). During lactatiol, tlxxo subjects lost w eight, txxo subjects ga ined weight, xxhile the xliglht of the remlaitling txx o fluctua ted. Oxerall, there xxwas a- decrease in xeiglt betxxween 6 .and 9 imontits aind, for tile fou- subjects still feedingg, 0 furthier- decreatse betxeen 9 alnd 2 1 imonths (Fig. 7). The fital body xeight of the Illottlers shoxed a xide ralinge (67.5 + 48 kg) xxhich xxas not sigtnificalntly different fromil bef'ore conception (Student's pIli-ecl t test, P 0 170, N = 6). Downloaded from Exp Physiol (ep.physoc.org) by guest on August 22, 2009
  • 9. BREAST VOL U! ME AND NMILK PRODtlCTION 443 Table 1. Correlatiotns of 24 h miiilk pr-oduction acnd stor-age capacity of individlual br-easts at different measurement times thlroughouit lactation Tiunlle I' P it (illonithxs) 1 ().655 110() 14 1l 2 1)666 10)0001I 12 4 0.491 0l0241 10 6 0-343 0(0453 12 9 0)0 0()(0.102 12 12 1)662 0-0042 10 15 0)45t ni.s. 6 1 24 0(588 0(000 1 83 90 85 - 80 - 75 - 0) 0 -6 55 0-0, 60 k_ 55 A 50 Pre 0 3 6 9 12 15 18 21 24 27 w w+3 Time after birth (months) Fig. 7. Body x eig}ht tOf SLIhjects b t e conzeplic tioon (Prt) ciland tt otib-o0.tlIt CtCtiO W is tIlh tillnC Otf w ealillg, w + 3 is bIRCl- %Nci cv0. SuIbject 1 (O). 4 (0) 5 (m), 6 (o). 7 (A)l 8 (A). m11onith.s xx litfatits xeiglhed between 2790 g (inf.ant of subject 7 lho u.As delixered at 34 weelks w gest"Ation due to pllacentaz prIaevia) and 4930 g at birthi wxhich is betxeen approximately the 20th and > 97thi centiles on the NCHS groxth curVes for children (US Depa-rtmenit of He.alth, Education and Welfare, 1977). During the first monithi the xxoeight aian of the infantsi ranged from 25 7 to 818 g per day. At 2 months, the smiallest infint xxas on the 35th centile, while the others xvere betxeen the 50th a.nd 90th centiles. The mean weiglt ga,in for each iilifailt oxer tile first 6 montlis ranged betxween 16 1 and 29)5 g per day. At 6 monthIsiilfatlts Were betxeen tie the 20th and just oxer the 75th centiles. At 12 mltonths all initrints railged between the 3rd and the 50th centiles, ind betxweeni 1 9 alnd 26 Illontlls, whenl txo of tile infants were wecaliled and the remtaining ijililtits were Pllrtially breast-fed, they still ralnged betxxenei the 3rd alnd 50th centiles. TheIe ws no riclationship betxeen the ilfailt "'ightwci xx i durinlg the first 1(1o1ith lnd PBV (Lxaerage of' left and right for each miother) at 1 Illonth. Hoxever, tlhere xwas a relationshlip betxxween the IlleIal xeigiht gaill of cacli intlatnt oxver the first 6 illoitil.s alnd its mca ciiailx breatst d Illilk inltake (r2= 0.827, P = 0 045> N = 6) (Fig. 8). Downloaded from Exp Physiol (ep.physoc.org) by guest on August 22, 2009
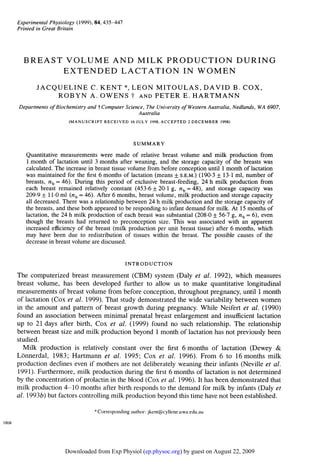
  • 10. 444 J. C. KENT AND OTHERS 30 A cm 0 0 0 c 20 o 0 1 0 .LI . 500 600 700 800 900 1000 1100 1200 Breast milk intake (g day-1) Fig. 8. Relationship between the mean daily growth rate of infants and their mean daily breastmilk intake for the first 6 months of lactation. Subject I (0), 4 (0) 5 (U), 6 (o), 7 (A), 8 (A). DISCUSSION Dewey et al. (1986) using data pooled from four studies found that 24 h milk production of multiparous women between 6 and 18 weeks of lactation was 755 ± 177 g (mean + S.D.). These milk production values were determined by weighing the infants without correction for evaporative water losses, which would lead to an underestimation by 10 % (Arthur et al. 1987). Therefore, normal milk production would be 830 + 195 g (mean + S.D.) giving a normal range of 440-1220 g (mean + 2 S.D.). Based on these figures, the milk production of subject 4 at 1 month (413 g) was lower than normal, and subject 1 at 1 and 2 months (1324 and 1325 g, respectively) and subject 5 at 4 months (1259 g) were higher than normal, while the remainder in the present study were within the normal range. The present data (24 h milk production for 1-6 months of lactation of 905 3 + 245-3 g, mean + S.D.) are also consistent with our previous data (Hartmann et al. 1995; Cox et al. 1996) for 24 h milk production of 798 + 216 g and 837 + 190 g (mean + S.D.), respectively, between 1 and 6 months of lactation. The decline in milk production from 6 to 15 months is similar to the data of Neville et al. (1991) for mothers who were not deliberately weaning their infants. It is immediately apparent from Fig. 1 that there was a small variation in PBV between subjects at 1 month (coefficient of variation (c.v.) 15-1 %), compared with the large variation in 24 h milk production (c.v. 48-2 %). This confirms that 24 h milk production at 1 month is not dependent on the amount of breast growth from before conception until 1 month of lactation (Cox et al. 1999). Since milk production is unchanged for the first 6 months of lactation, we conclude that breast growth during pregnancy and the first month of lactation had no effect on milk production while infants were being fully breast-fed. Even though there was a significant correlation between 24 h milk production and PBV when these measurements over the lactation period were incorporated (Figs 3 and 4), there was no relationship between these parameters when each measurement time was analysed individually. This implies that the 24 h milk production is not dependent on PBV, but rather both are decreasing with time. Downloaded from Exp Physiol (ep.physoc.org) by guest on August 22, 2009
  • 11. BREAST VOLUME AND MILK PRODUCTION 445 Between 6 and 9 months of lactation there was a significant decrease in PBV, but no change in 24 h milk production. This resulted in an increase in the ratio of the mean 24 h milk production to the mean PBV at 9 months and implies an increase in efficiency of the breast tissue. This may be due either to an increase in efficiency of the secretory cells during this time, or to mobilization of fat tissue from the breast. Five of the subjects lost weight between 6 and 9 months, so fat tissue may have been lost from the breast along with overall fat loss. However, PBV was not related to body weight changes at other times. It is possible that mobilization of fat from the breast may occur separately from overall loss in body weight, since Hartmann et al. (1995) have shown a redistribution of fat stores during lactation. The decrease in PBV after 6 months may be due to a combination of both mobilization of fat from the breast and loss of mammary cells. Programmed cell death is part of the normal repertoire of the lactating and involuting mammary gland (Quarrie et al. 1996). It occurs in rodents and ruminants (Wilde et al. 1997) and appears to be under both endocrine and local regulation. In rats, a deficiency of prolactin and growth hormone causes apoptosis in the mammary gland, which is reversible by prolactin treatment (Travers et al. 1996). In women, Hennart et al. (1981) found that prolactin concentrations in blood samples collected before breast feeds decreased gradually from 1-3 months to 12-15 months, then dropped sharply at 15-18 months to concentrations not different from non-pregnant non-lactating women. Our data showed that the breast volume returned to pre-conception size on average at 15 months, consistent with apoptosis occurring as a result of decreased blood prolactin concentrations. Mammary apoptosis also appears to be associated with frequency of milk removal. Wilde et al. (1997) suggested that frequent milking of goats may inhibit mammary apoptosis. Consequently, a decline in feeding frequency would facilitate mammary apoptosis. The decrease we measured in PBV between 12 and 15 months when the frequency decreased from 5-1 to 3-3 feeds per breast per day is consistent with this hypothesis. In addition to removing inhibition of apoptosis, decline in the frequency of breast-feeds may lead to milk stasis, which has been shown to induce apoptosis in the mammary gland of the rat (Quarrie et al. 1996). Whether the decline in breast volume is due to mobilization of fat from the breast, apoptosis caused by endocrine and local factors, or a combination of these efFects, we have found that even when the breast volume had returned to a minimum at 15 months, the combined 24 h milk production from both breasts of the mothers was still between 95 and 315 g. Hennart et al. (1981) also found 24 h milk production of between 150 and 300 g from 15-18 months until 27-30 months. This suggests that while proliferation of breast tissue is necessary for sufficient milk production to sustain an infant, the breast does not need to be enlarged above pre-conception size to continue significant milk production. Further studies are needed to identify the proportions of different tissues in the lactating and quiescent breast. The lack of correlation between storage capacity of the breast and PBV, when each measurement time was analysed individually, implies that the storage capacity is not dependent on PBV, but rather both are decreasing with time. Our finding of a relationship between the sum of the storage capacity of left and right breasts and the sum of the 24 h milk production from left and right breasts, when these measurements over the lactation period were incorporated, is in contrast to Daly et al. (1993b) who found no relationship. However, the subjects in that study were between 4 and 10 months of lactation, and we also found no significant relationship at 4, 6 or 9 months. Treating left and right breasts individually, storage capacity was strongly related to the 24 h milk production both when these measurements over the lactation period were incorporated, and at each measurement time between 1 and 12 months. Analysis of the data of Daly et al. Downloaded from Exp Physiol (ep.physoc.org) by guest on August 22, 2009
  • 12. -. 446 J. C. KENT AND OTHERS (1993b) also shows a relationship between the storage capacity of each breast and the 24 h milk production from that breast (r2 = 0-348, P = 0-0039, nb = 22). More than 20 % of the stored milk remained in each breast after at least two feeds during all 24 h measurement periods. That is, the infant demand for milk was usually satisfied before the breast was empty of available milk. Therefore, the storage capacity was not limiting the infant's intake, but rather responding to the degree of emptying. The only exception was the left breast of subject 7 which was consistently emptied at 1, 2 and 4 months. It is of interest that the left breast of this subject always produced less milk than the right, and that the infant she was feeding during the current study and her previous infant both weaned themselves from this breast before the right breast. Current growth charts are based on data from a sample of predominantly formula-fed infants. The high growth rate of the infants we measured over the first 2 months was consistent with the finding of Dewey et al. (1995) that breast-fed infants grow more rapidly in the first 2 months compared with current growth charts. The lower growth rate between 2 and 12 months was also consistent with the finding of Dewey et al. (1995) that breast-fed infants grow less rapidly from 3 to 12 months when compared with current growth charts. The relationship between the average growth rate over the first 6 months and the average daily breast milk intake suggests that milk production of the mother is either limiting growth rate or responding to infant appetite. Since all but one of the breasts was not consistently emptied, it would appear that each mother had the potential to produce more milk. Furthermore milk production, as well as storage capacity, was responding to the infant demand for milk. In conclusion, we have found that milk production, breast volume and storage capacity all declined after 6 months of lactation. However, significant milk production persisted after the breast had returned to pre-conception volume at 15 months of lactation. Milk production was not dependent on PBV at any stage of lactation. Milk production was closely related to the storage capacity of the breast, and both were apparently responding to the infant demand for milk mediated by the degree of emptying of the breast. Therefore, our data are consistent with the premise that milk production responds to infant demand throughout lactation. We would like especially to thank the volunteer subjects, their families and the Nursing Mothers' Association of Australia. We thank Lyle Gurrin for statistical advice, and Dijana Mihic and Tracey Williams for technical assistance. The project was supported by the National Health and Medical Research Council and the Grains Research and Development Corporation/Meadow Lea. REFERENCES ARTHUR, P. G., HARTMANN, P. E. & SMITH, M. (1987). Measurement of milk intake of breast-fed infants. Journal of Pediatric Gastroenterology and Nutrition 6, 758-763. ATWOOD, C. S. & HARTMANN, P. E. (1992). Collection of fore and hind milk from the sow and the changes in milk composition during suckling. Journal of Dairy Research 59, 287-298. Cox, D. B., KENT, J. C., CASEY, T. M., OWENS, R. A. & HARTMANN, P. E. (1999). Breast growth and the urinary excretion of lactose during human pregnancy and early lactation: endocrine relationships. Experimental Physiology 84, 421-434 Cox, D. B., OWENS, R. A. & HARTMANN, P. E. (1996). Blood and milk prolactin and the rate of milk synthesis in women. Experimental Physiology 81, 1007- 1020. DALY, S. E. J., Di Rosso, A., OWENS, R. A. & HARTMANN, P. E..(1993a). Degree of breast emptying explains changes in the fat content, but not fatty acid composition, of human milk. Experimental Physiology 78, 741-755. Downloaded from Exp Physiol (ep.physoc.org) by guest on August 22, 2009
  • 13. BREAST VOLUME AND MILK PRODUCTION 447 DALY, S. E. J., KENT, J. C., HUYNH, D. Q., OWENS, R. A., ALEXANDER, B. F., NG, K. C. & HARTMANN, P. E. (1992). The determination of short-term breast volume changes and the rate of synthesis of human milk using computerized breast measurement. Experimental Physiology 77, 79-87. DALY, S. E. J., OWENS, R. A. & HARTMANN, P. E. (1993b). The short-term synthesis and infant-regulated removal of milk in lactating women. Experimental Physiology 78, 209-220. DEWEY, K.G., FINLEY, D.A., STRODE, M.A. & LONNERDAL, B. (1986). Relationship of maternal age to breast milk volume and composition. In Human Lactation 2: Maternal and Environmental Factors, ed. HAMOSH, M. & GOLDMAN, A.S., pp. 263-273. Plenum Press, New York, London. DEWEY, K.G. & LONNERDAL, B. (1983). Milk and nutrient intake of breast-fed infants from 1 to 6 months: relation to growth and fatness. Journal of Pediatric Gastroenterology and Nutrition 2, 497-506. DEWEY, K. G., PEERSON, J. M., BROWN, K. H., KREBS, N. F., MICHAELSEN, K. F., PERSSON, L. A., SALMENPERA, L., WHITEHEAD, R. G., YEUNG, D. L. & THE WORLD HEALTH ORGANIZATION WORKING GROUP ON INFANT GROWTH (1995). Growth of breast-fed infants deviates from current reference data: a pooled analysis of US, Canadian, and European data sets. Pediatrics 96, 495-503. HARTMANN, P. E., SHERRIFF, J. & KENT, J. (1995). Maternal nutrition and the regulation of milk synthesis. Proceedings of the Nutrition Society 54, 379-389. HENNART, P., DELOGNE-DESNOECK, H. Vis & ROBYN, C. (1981). Serum levels of prolactin and milk production in women during a lactation period of thirty months. Clinical Endocrinology 14, 349-353. JENSEN, R. G. (1989). The Lipids of Human Milk. CRC Press, Boca Raton, FL, USA. NEIFERT, M., DEMARZO, S., SEACAT, J., YOUNG, D., LEFF, M. & ORLEANS, M. (1990). The influence of breast surgery, breast appearance, and pregnancy-induced breast changes on lactation sufficiency as measured by infant weight gain. Bir-th 17, 31-38. NEVILLE, M. C., ALLEN, J. C., ARCHER, P. C., CASEY, C. E., SEACAT, J., KELLER, R. P., LUTES, V. J. R. & NEIFERT, M. (1991). Studies in human lactation: milk volume and nutrient composition during weaning and lactogenesis. American Journal of Clinical Nutrition 54, 81-92. QUARRIE, L. H.. ADDEY, C. V. P. & WILDE, C. J. (1996). Programmed cell death during mammary involution induced by weaning, litter removal and milk stasis. Journal of Cell Physiology 168, 559-569. STERN, I. & SHAPIRO, B. (1953). A rapid and simple method for the determination of esterified fatty acids and for total fatty acids in blood. Journal of Clinical Pathology 17, 184-187. TRAVERS, M. T., BARBER, M. C., TONNER, E., QUARRIE, L., WILDE, C. J. & FLINT, D. J. (1996). The role of prolactin and growth hormone in the regulation of casein gene expression and mammary cell survival - relationships to milk synthesis and secretion. Endocrinology 137, 1530-1539. US DEPARTMENT OF HEALTH, EDUCATION AND WELFARE (1977). NCHS growth curves for children, birth-18 years. DHEW publication (PHS) 78-1650. WILDE, C. J., QUARRIE, L. H., TONNER, E., FLINT, D. J. & PEAKER, M. (1997). Mammary apoptosis. Livestock Production Science 50, 29-37. Downloaded from Exp Physiol (ep.physoc.org) by guest on August 22, 2009