Medical Graphs
•
7 likes•22,653 views

The document discusses how various types of graphs are used in medical contexts. Hospitals use pain scales to assess patient pain levels and treatment needs. Vital signs like heart rate and blood pressure are often graphed electronically. Line and curve graphs are commonly used to monitor things like sleep apnea, cholesterol levels, blood glucose levels, and disease outbreaks over time. Other graphs show concepts like body mass index, sleep patterns, and the glycemic index of foods. Reflexology uses charts to map pressure points on hands and feet to different body parts.

Recommended
More Related Content
What's hot
What's hot (20)
Viewers also liked
Viewers also liked (18)
Similar to Medical Graphs
More from Passy World
More from Passy World (20)
Recently uploaded
Recently uploaded (20)
Medical Graphs
- 2. Hospitals have a 1 to 10 pain scale, which is used to work out how patients are going, and what relief treatment might be needed. Image Source: http://springpblwow.springnote.com
- 3. Serious pain is usually experienced for several days after a major medical operation.
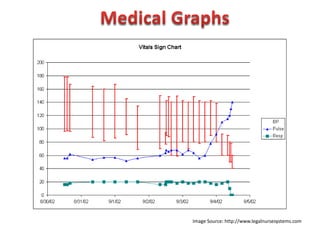
- 4. “Vital Signs” such as Heart Rate, Pulse, Respiration, and Blood Pressure, are monitored and graphed electronically and recorded on a specialised computer. Image Source: http://www.pec-equipment.com
- 5. Most Medical Graphs are Line or Curve Graphs, rather than Bar Charts or Pie Charts. Image Source: http://farm3.static.flickr.com
- 6. However, sometimes column graphs are used. Image Source: http://www.thingstheydontteachyou.com
- 7. Sometimes stacked column graphs are used. Image Source: http://www.soill.co.za
- 8. Line Graphs are used for monitoring patient Cholesterol levels. (Related to Heart Health) Image Source: http://www.ricediet.com
- 9. BMI – Body Mass Index Charts are used to work out if adults are at a correct healthy body weight. Image Source: http://wikieducator.org
- 10. Line Graphs are used to monitor breathing during sleep to check for “Sleep Apnea”. Image Sources: http://1800cpap.com http://www.sciencecodex.com http://sleepzine.com
- 11. Some more Sleep Apnea Graphs. Image Source: http://nyxdevices.com
- 12. How much Sleep have you been getting lately? Image Source: http://www.nanotechnologystore.com
- 13. Graphs are used for detecting Diabetes by measuring blood glucose levels after a meal. Image Source: http://www.glycemicedge.com
- 14. The following graph shows how blood glucose levels vary with the type of food eaten. Image Source: http://www.diabeteshealthysolutions.com
- 15. The Glycemic Index rates foods based on how they affect blood sugar levels. Image Source: http://static.ddmcdn.com
- 16. Graphs are used for tracking disease epidemics. Image Source: http://www.avert.org
- 17. Iridology makes a chart of areas of the human eye which are believed to indicate body health. (See next slide for a detailed chart). Image Source: http://28.media.tumblr.com
- 18. Reflexology Chart for the Feet. Image Source: http://2.bp.blogspot.com
- 19. Reflexology, Acupressure, Acupuncture, and Massage all use the concept of stimulating pressure points in various locations of the body to relieve stress and/or to stimulate the body’s natural healing processes. For Reflexology there are charts which map out areas of the hands and feet to show how they relate to parts of the body. These are not really graphs, but are more like maps.
- 20. Reflexology Chart for the Feet. Image Source: http://healthy-ojas.com
- 21. And some Medical Graphs are just for fun Image Source: Graphjam.com