Asia-Pacific Wealth Report 2015 Infographic
•
27 likes•6,182 views

Key findings of the Asia-Pacific Wealth Report 2015 in this infographic
Recommended

Recommended
More Related Content
What's hot
What's hot (20)
Viewers also liked
Viewers also liked (20)
Similar to Asia-Pacific Wealth Report 2015 Infographic
Similar to Asia-Pacific Wealth Report 2015 Infographic (20)
More from Capgemini
More from Capgemini (20)
Recently uploaded
Recently uploaded (20)
Asia-Pacific Wealth Report 2015 Infographic
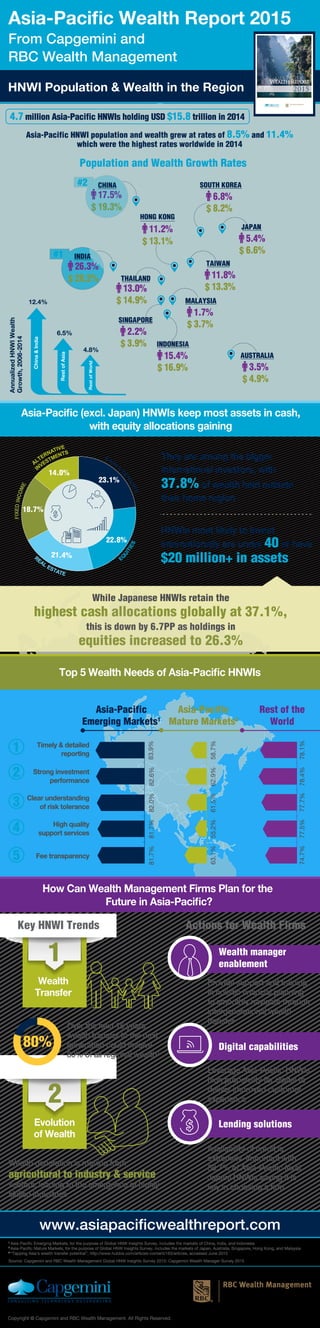
- 1. Copyright @ Capgemini and RBC Wealth Management. All Rights Reserved. 1 Asia-Pacific Emerging Markets, for the purpose of Global HNW Insights Survey, includes the markets of China, India, and Indonesia 2 Asia-Pacific Mature Markets, for the purpose of Global HNW Insights Survey, includes the markets of Japan, Australia, Singapore, Hong Kong, and Malaysia 3 “Tapping Asia’s wealth transfer potential”, http://www.hubbis.com/articles-content/163/articles, accessed June 2015 Source: Capgemini and RBC Wealth Management Global HNW Insights Survey 2015; Capgemini Wealth Manager Survey 2015 Asia-Pacific Wealth Report 2015 From Capgemini and RBC Wealth Management www.asiapacificwealthreport.com Asia-Pacific Emerging Markets1 Actions for Wealth Firms Asia-Pacific Mature Markets2 Rest of the World Asia-Pacific (excl. Japan) HNWIs keep most assets in cash, with equity allocations gaining 23.1% 22.8% 21.4% 18.7% 14.0% HNWIs most likely to invest internationally are under 40 or have $20 million+ in assets 1 2 3 4 5 Timely & detailed reporting Strong investment performance Clear understanding of risk tolerance High quality support services Fee transparency They are among the bigger international investors, with 37.8% of wealth held outside their home region While Japanese HNWIs retain the highest cash allocations globally at 37.1%, this is down by 6.7PP as holdings in equities increased to 26.3% Top 5 Wealth Needs of Asia-Pacific HNWIs 1 Wealth Transfer How Can Wealth Management Firms Plan for the Future in Asia-Pacific? Key HNWI Trends 2 Evolution of Wealth Over the next 15 years, wealth transfer to the next generation could involve 80% of all regional wealth3 Wealth generation is moving from agricultural to industry & service sectors, leading to the emergence of highly skilled industries Provide support and training in holistic financial planning to smoothly navigate through intergenerational wealth transfer 80% Wealth manager enablement Leverage Asia-Pacific HNWIs’ high propensity for digital to deliver improved customer experience Availability of credit is extremely important with 58.7% of Asia-Pacific (excl. Japan) HNWIs saying it is key in choosing a firm Digital capabilities Lending solutions 81.7%81.7%82.0%82.6%83.9% 63.1%55.2%61.5%62.9%58.7% 74.7%77.5%77.7%78.4%78.1% Population and Wealth Growth Rates THAILAND 13.0% $ 14.9% AUSTRALIA 3.5% $ 4.9% MALAYSIA 1.7% $ 3.7% TAIWAN 11.8% $ 13.3% JAPAN 5.4% $ 6.6% SOUTH KOREA 6.8% $ 8.2% HONG KONG 11.2% $ 13.1% 2.2% $ 3.9% SINGAPORE 15.4% $ 16.9% INDONESIA Asia-Pacific HNWI population and wealth grew at rates of 8.5% and 11.4% which were the highest rates worldwide in 2014 12.4% 6.5% 4.8% AnnualizedHNWIWealth Growth,2006-2014 China&India RestofAsia RestofWorldHNWI Population & Wealth in the Region 17.5% $ 19.3% #2 INDIA 26.3% $ 28.2% #1 CHINA �4.7 million Asia-Pacific HNWIs holding USD�$15.8 trillion in 2014