SlideShare a Scribd company logo
1 of 3
Response Analysis for ABC, Inc.

Direct Mail Description:             Invitation to July Art Event
                                     ½ Fold Card, with Repositionable Note
Mail Date:                           June 18, 2008
List Qty:                            4,000 Records
Responses:                           97
Response Rate:                       2.4%
Tests:                               3 Demographic Variables:
                                     Age, Income, Mail Order Responder


                                                                                  Analysis - Geography


                                 Top 10 - Zip Code Performance
                               Zip
                              Code             Mail Qty       Response              %
                             45208               245             6                2.4%
                             45215              1143             24               2.1%
                             45230               352             3                0.8%
                             45244               421             7                1.7%
                             45174               356             5                1.5%
                             45140               412             3                0.8%
                             45150               325             4                1.2%
                             45243               222             1                0.6%
                             45242              1219             13               1.1%
                             41017               305             2                0.5%
                             TOTAL              4000             97               2.4%


                                     Geography Response Rate %

             2.5%

             2.0%

             1.5%

             1.0%

             0.5%

             0.0%
                     45208

                             45215

                                       45230

                                                 45244

                                                          45174

                                                                  45140

                                                                          45150

                                                                                   45243

                                                                                           45242

                                                                                                   41017


                    CONFIDENTIAL! Do Not Copy or Reproduce With Out Permission.
Analysis - Demographics


Variable #1 – Age
Top performing age groups in descending order:
48-49, 46-47, 42-43, 50-51, 52-53


                                    Age - Response %

          6.0%
          5.0%
          4.0%
          3.0%
          2.0%
          1.0%
          0.0%
                  1

                  3

                  5

                  7

                  9

                  1

                  3

                  5

                  7

                  9

                  1

                  3

                  5
                  5
                -4

                -4

                -4

                -4

                -4

                -5

                -5

                -5

                -5

                -5

                -6

                -6

                -6
              >4
             40

             42

             44

             46

             48

             50

             52

             54

             56

             58

             60

             62

             64


Variable #2 – Income
The top performing segment is $100k - $124,999. $150k+ and $125K are also above the
1% threshold, and should be included in the next list order.


                          Response Rate % - Income


            > $50k

    $75k - $99,999

            $150k+

  $125k - $149,999

  $100k - $124,999

                 0.00%       0.50%       1.00%        1.50%       2.00%       2.50%   3.00%


                     CONFIDENTIAL! Do Not Copy or Reproduce With Out Permission.
Test #3 – Mail Order Responder

“Mail Order Buyer” has outperformed non buyers in the last 4 mailings.

                  Mail Order Buyer         Mail Qty     Response          %
                        Yes                 4235          168           4.0%
                   No / Unknown             887            22           2.5%


                                                                                  Summary


The top responding segments should be closely examined to determine if adjustments to
the mailing list should be made at the time of the next order.

                                  TOP RESPONDERS
                                     Age: 48-49
                                  Income: $100k - $124,999
                    Mail Order Buyer Flag: Yes


                                     Response Rate %


       3.2%

       3.0%

       2.8%

       2.6%

       2.4%

       2.2%

       2.0%
                                                 1
                               Jun-08            May-08             Feb-08


A constant review of list demographics, as well as mail piece evaluation should be done
to fully understand why response rates fluctuate from mailing to mailing.


                    CONFIDENTIAL! Do Not Copy or Reproduce With Out Permission.

More Related Content

Similar to Sample Response Analysis Abc Co

Diagnosing And Solving Membership Marketing Challenges - Tony Rossell-mgi
Diagnosing And Solving Membership Marketing Challenges - Tony Rossell-mgiDiagnosing And Solving Membership Marketing Challenges - Tony Rossell-mgi
Diagnosing And Solving Membership Marketing Challenges - Tony Rossell-mgiMarketing General Incorporated (MGI)
 
Edelman 2011 trust barometer
Edelman 2011 trust barometer Edelman 2011 trust barometer
Edelman 2011 trust barometer Barbara Deters
 
2011 Edelman Trust Barometer: Global & Country Insights
2011 Edelman Trust Barometer: Global & Country Insights2011 Edelman Trust Barometer: Global & Country Insights
2011 Edelman Trust Barometer: Global & Country InsightsEdelman Digital
 
2011 Edelman Trust Barometer Findings
2011 Edelman Trust Barometer Findings2011 Edelman Trust Barometer Findings
2011 Edelman Trust Barometer FindingsEdelman
 
Edelman trust barometer global deck
Edelman trust barometer global deckEdelman trust barometer global deck
Edelman trust barometer global deckRhona Cameron
 
Trust barometer executive findings
Trust barometer executive findingsTrust barometer executive findings
Trust barometer executive findingsBPO Group
 
Edelman Trust Barometer Findings 2011
Edelman Trust Barometer Findings 2011Edelman Trust Barometer Findings 2011
Edelman Trust Barometer Findings 2011Sustainable Brands
 
Edelman trust barometer global deck
Edelman trust barometer global deckEdelman trust barometer global deck
Edelman trust barometer global deckangelamhenao
 
Excel charts lesson 8
Excel charts lesson 8Excel charts lesson 8
Excel charts lesson 8Tellez16
 
Excel charts lesson 8
Excel charts lesson 8Excel charts lesson 8
Excel charts lesson 8Tellez16
 
Real Time Enrollment of IPS and Charter Schools
Real Time Enrollment of IPS and Charter SchoolsReal Time Enrollment of IPS and Charter Schools
Real Time Enrollment of IPS and Charter SchoolsAbdul-Hakim Shabazz
 
Bill Watkins - Economic Forecast
Bill Watkins - Economic ForecastBill Watkins - Economic Forecast
Bill Watkins - Economic ForecastContract Cities
 
Cisco Candidate Survey Report Winter 2012
Cisco Candidate Survey Report Winter 2012Cisco Candidate Survey Report Winter 2012
Cisco Candidate Survey Report Winter 2012georgeleobarnes
 
Cardinal pr survey results
Cardinal pr survey resultsCardinal pr survey results
Cardinal pr survey resultstimjm123
 
Reward trends - Aon Hewitt
Reward trends - Aon HewittReward trends - Aon Hewitt
Reward trends - Aon HewittAon Hewitt EMEA
 
Upec presentation-080808-中(證交所-上傳版本)
Upec presentation-080808-中(證交所-上傳版本)Upec presentation-080808-中(證交所-上傳版本)
Upec presentation-080808-中(證交所-上傳版本)thc000
 

Similar to Sample Response Analysis Abc Co (20)

Poverty and Disability
Poverty and DisabilityPoverty and Disability
Poverty and Disability
 
Diagnosing And Solving Membership Marketing Challenges - Tony Rossell-mgi
Diagnosing And Solving Membership Marketing Challenges - Tony Rossell-mgiDiagnosing And Solving Membership Marketing Challenges - Tony Rossell-mgi
Diagnosing And Solving Membership Marketing Challenges - Tony Rossell-mgi
 
Edelman 2011 trust barometer
Edelman 2011 trust barometer Edelman 2011 trust barometer
Edelman 2011 trust barometer
 
2011 Edelman Trust Barometer: Global & Country Insights
2011 Edelman Trust Barometer: Global & Country Insights2011 Edelman Trust Barometer: Global & Country Insights
2011 Edelman Trust Barometer: Global & Country Insights
 
Trust barometer 2011 edelman
Trust barometer 2011   edelmanTrust barometer 2011   edelman
Trust barometer 2011 edelman
 
2011 Edelman Trust Barometer Findings
2011 Edelman Trust Barometer Findings2011 Edelman Trust Barometer Findings
2011 Edelman Trust Barometer Findings
 
Edelman trust barometer global deck
Edelman trust barometer global deckEdelman trust barometer global deck
Edelman trust barometer global deck
 
Trust barometer executive findings
Trust barometer executive findingsTrust barometer executive findings
Trust barometer executive findings
 
Edelman Trust Barometer Findings 2011
Edelman Trust Barometer Findings 2011Edelman Trust Barometer Findings 2011
Edelman Trust Barometer Findings 2011
 
Edelman trust barometer global deck
Edelman trust barometer global deckEdelman trust barometer global deck
Edelman trust barometer global deck
 
Excel charts lesson 8
Excel charts lesson 8Excel charts lesson 8
Excel charts lesson 8
 
Excel charts lesson 8
Excel charts lesson 8Excel charts lesson 8
Excel charts lesson 8
 
Real Time Enrollment of IPS and Charter Schools
Real Time Enrollment of IPS and Charter SchoolsReal Time Enrollment of IPS and Charter Schools
Real Time Enrollment of IPS and Charter Schools
 
Bill Watkins - Economic Forecast
Bill Watkins - Economic ForecastBill Watkins - Economic Forecast
Bill Watkins - Economic Forecast
 
Gillaspy demographic change
Gillaspy demographic changeGillaspy demographic change
Gillaspy demographic change
 
Cisco Candidate Survey Report Winter 2012
Cisco Candidate Survey Report Winter 2012Cisco Candidate Survey Report Winter 2012
Cisco Candidate Survey Report Winter 2012
 
Diagrams
DiagramsDiagrams
Diagrams
 
Cardinal pr survey results
Cardinal pr survey resultsCardinal pr survey results
Cardinal pr survey results
 
Reward trends - Aon Hewitt
Reward trends - Aon HewittReward trends - Aon Hewitt
Reward trends - Aon Hewitt
 
Upec presentation-080808-中(證交所-上傳版本)
Upec presentation-080808-中(證交所-上傳版本)Upec presentation-080808-中(證交所-上傳版本)
Upec presentation-080808-中(證交所-上傳版本)
 

Sample Response Analysis Abc Co

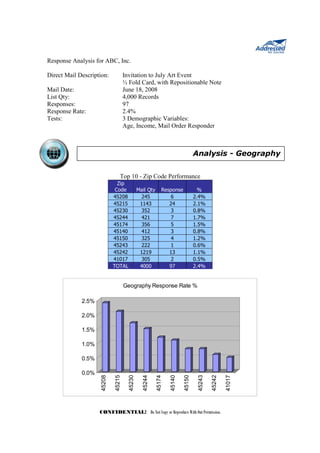
  • 1. Response Analysis for ABC, Inc. Direct Mail Description: Invitation to July Art Event ½ Fold Card, with Repositionable Note Mail Date: June 18, 2008 List Qty: 4,000 Records Responses: 97 Response Rate: 2.4% Tests: 3 Demographic Variables: Age, Income, Mail Order Responder Analysis - Geography Top 10 - Zip Code Performance Zip Code Mail Qty Response % 45208 245 6 2.4% 45215 1143 24 2.1% 45230 352 3 0.8% 45244 421 7 1.7% 45174 356 5 1.5% 45140 412 3 0.8% 45150 325 4 1.2% 45243 222 1 0.6% 45242 1219 13 1.1% 41017 305 2 0.5% TOTAL 4000 97 2.4% Geography Response Rate % 2.5% 2.0% 1.5% 1.0% 0.5% 0.0% 45208 45215 45230 45244 45174 45140 45150 45243 45242 41017 CONFIDENTIAL! Do Not Copy or Reproduce With Out Permission.
  • 2. Analysis - Demographics Variable #1 – Age Top performing age groups in descending order: 48-49, 46-47, 42-43, 50-51, 52-53 Age - Response % 6.0% 5.0% 4.0% 3.0% 2.0% 1.0% 0.0% 1 3 5 7 9 1 3 5 7 9 1 3 5 5 -4 -4 -4 -4 -4 -5 -5 -5 -5 -5 -6 -6 -6 >4 40 42 44 46 48 50 52 54 56 58 60 62 64 Variable #2 – Income The top performing segment is $100k - $124,999. $150k+ and $125K are also above the 1% threshold, and should be included in the next list order. Response Rate % - Income > $50k $75k - $99,999 $150k+ $125k - $149,999 $100k - $124,999 0.00% 0.50% 1.00% 1.50% 2.00% 2.50% 3.00% CONFIDENTIAL! Do Not Copy or Reproduce With Out Permission.
  • 3. Test #3 – Mail Order Responder “Mail Order Buyer” has outperformed non buyers in the last 4 mailings. Mail Order Buyer Mail Qty Response % Yes 4235 168 4.0% No / Unknown 887 22 2.5% Summary The top responding segments should be closely examined to determine if adjustments to the mailing list should be made at the time of the next order. TOP RESPONDERS Age: 48-49 Income: $100k - $124,999 Mail Order Buyer Flag: Yes Response Rate % 3.2% 3.0% 2.8% 2.6% 2.4% 2.2% 2.0% 1 Jun-08 May-08 Feb-08 A constant review of list demographics, as well as mail piece evaluation should be done to fully understand why response rates fluctuate from mailing to mailing. CONFIDENTIAL! Do Not Copy or Reproduce With Out Permission.