SlideShare a Scribd company logo
1 of 6
Download to read offline
A.L. Wagner Appraisal Group
                                                                                  Presents
                                              THE CHICAGOLAND QUARTERLY HOUSING REPORT

                                         The Analysis of Absorption Rates and Percentage of Change in Inventory Level
                                                              Single Family Detached Residences
                                                           October 1, 2008 to September 30, 2009

Sponsored by:
Alvin "Chip" Wagner III, SRA, SCRP
A. L. Wagner Appraisal Group, Inc.                                                           Specializing in Relocation, Litigation & Lending Appraisals
1807 Washington Street, Suite 110, Naperville, IL 60565                                      Serving the Chicagoland Area since 1970
(630) 416-6556 ~ www.wagnerappraisal.com ~ chip@rac.net                                      Offices in Naperville, Plainfield, Chicago, Flossmoor


                                                               October 1, 2009 Statistics                                      October 1, 2008 Statistics
                                                               Under    Under # of Sales                                                                   12 mo SP
                             MLS                 Average      Contract Contract  Last            Average    MONTHS     MONTHS     Percent      Average       Percent
Town                         Area   Actives     List Price     (Ctg.)   (Pend) 12 mos.          Sale Price  SUPPLY     SUPPLY     Change      Sale Price    Change
Addison                       101       206   $     331,822         51      19      168       $     225,723  10.39      19.83     -47.63%   $    286,138    -21.11%
Algonquin                     102       240   $     337,505         49      10      185       $     247,393  11.80      14.89     -20.72%   $    301,985    -18.08%
Alsip                         658        89   $     201,358         17        5       93      $     152,973  9.29       16.28     -42.94%   $    194,218    -21.24%
Antioch                         2       290   $     321,229         26      18      192       $     209,271  14.75      16.20      -8.98%   $    243,006    -13.88%
Arlington Heights               5       364   $     521,477         77      19      350       $     387,706  9.79       11.15     -12.19%   $    429,919      -9.82%
Aurora - DuPage County        507       179   $     348,882         44      10      247       $     269,750  7.14       7.68       -7.10%   $    318,264    -15.24%
Aurora - Kane County          507       672   $     165,562        143      75      646       $     132,227  9.33       11.29     -17.35%   $    171,217    -22.77%
Aurora - Will, Kendall Cty    507        81   $     265,956         34        7     124       $     246,746  5.89       11.38     -48.22%   $    275,797    -10.53%
Barrington Area                10       626   $ 1,090,200           44      14      304       $     616,456  20.75      19.29       7.56%   $    753,276    -18.16%
Bartlett                      104       212   $     363,090         50        6     219       $     293,578  9.25       12.09     -23.45%   $    313,695      -6.41%
Batavia                       510       205   $     395,746         34        3     156       $     316,295  12.75      10.55      20.78%   $    331,897      -4.70%
Beecher                       401        82   $     304,230           4       4       33      $     192,103  24.00      16.09      49.15%   $    230,975    -16.83%
Bellwood                     2104       105   $     138,703         21      38      142       $     85,764   6.27       18.39     -65.92%   $    153,990    -44.31%
Bensenville                   106       127   $     266,429         29      17        81      $     188,491  12.00      31.02     -61.31%   $    255,642    -26.27%
Berwyn                        402       236   $     191,950         66      51      288       $     156,238  6.99       12.90     -45.78%   $    217,034    -28.01%
Bloomingdale                  108       107   $     513,671         18        5       97      $     358,571  10.70      18.57     -42.38%   $    418,832    -14.39%
Blue Island                   406        92   $     145,046           9       7       67      $      91,857  13.30      13.52      -1.59%   $    135,757    -32.34%
Bolingbrook                   440       405   $     264,909         97      45      453       $     200,725  8.17       12.87     -36.54%   $    258,547    -22.36%
Bridgeview                    455        49   $     238,653         12        6       47      $     197,194  9.05       15.85     -42.92%   $    223,588    -11.80%

       Data Source: MRED LLC
       Midwest Real Estate Data, LLC                          (C) Copyright 2009, A. L. Wagner Appraisal Group                                       Page 1
October 1, 2009 Statistics                                 October 1, 2008 Statistics
                                                              Under    Under # of Sales                                                               12 mo SP
                            MLS                 Average      Contract Contract  Last            Average    MONTHS   MONTHS   Percent      Average       Percent
Town                        Area   Actives     List Price     (Ctg.)   (Pend) 12 mos.          Sale Price  SUPPLY   SUPPLY   Change      Sale Price    Change
Broadview                    155        64   $     177,324           8       7       56      $     109,564  10.82    15.62   -30.76%   $    171,300    -36.04%
Brookfield                   513       117   $     271,959         18        5     115       $     225,883  10.17    7.60     33.87%   $    262,464    -13.94%
Buffalo Grove                 89       159   $     421,665         37        7     196       $     353,821  7.95     8.90    -10.69%   $    406,391    -12.94%
Burbank                      454       197   $     251,322         40      20      158       $     186,445  10.84    19.22   -43.57%   $    231,573    -19.49%
Burnham                      633        17   $      99,609           0       8       24      $      45,417  6.38     16.36   -61.04%   $    100,105    -54.63%
Burr Ridge                   522       195   $ 1,349,298           18        4       69      $     752,216  25.71    43.79   -41.28%   $    997,810    -24.61%
Calumet City                 409       277   $     105,172         23      56      301       $     65,512   8.75     13.39   -34.67%   $     98,646    -33.59%
Calumet Park                 643        31   $      90,330           9     12        71      $      50,204  4.04     10.29   -60.69%   $    135,740    -63.01%
Carol Stream                 188       127   $     286,352         27        8     133       $     239,411  9.07     11.03   -17.77%   $    278,889    -14.16%
Carpentersville              110       280   $     182,220         42      18      245       $     132,218  11.02    10.47     5.25%   $    170,741    -22.56%
Cary                          13       208   $     348,818         32        8     169       $     250,526  11.94    10.78    10.83%   $    289,962    -13.60%
Channahon                    410       107   $     289,323         15        7       86      $     218,998  11.89    17.03   -30.20%   $    247,944    -11.67%
Chicago Heights              411       213   $     115,008         21      28      238       $     56,605   8.91     16.05   -44.52%   $     99,217    -42.95%
Chicago Ridge                415        29   $     245,883           4       3       37      $     181,288  7.91     10.72   -26.24%   $    215,498    -15.87%
Cicero                       650       214   $     137,245         59      49      270       $     96,495   6.79     21.58   -68.51%   $    167,747    -42.48%
Clarendon Hills              514        94   $     757,971         22        3       71      $     577,595  11.75    16.66   -29.47%   $    690,483    -16.35%
Country Club Hills           478       151   $     158,958         33      33      187       $     109,093  7.16     12.79   -43.99%   $    154,544    -29.41%
Countryside                  527        36   $     424,025           5       0       16      $     383,844  20.57    21.50    -4.32%   $    354,992       8.13%
Crestwood                    446        28   $     238,132           5       2       34      $     193,083  8.20     8.00      2.44%   $    218,596    -11.67%
Crete                        417       176   $     269,737         26      13      124       $     163,899  12.96    14.06    -7.87%   $    211,416    -22.48%
Crystal Lake (& Lakewood)     14       518   $     389,352         97      21      392       $     260,146  12.19    15.94   -23.52%   $    306,539    -15.13%
Darien                       562        98   $     409,948         13        1       97      $     326,081  10.59    14.50   -26.91%   $    355,803      -8.35%
Deerfield                     15       161   $     743,608         14        8     139       $     542,121  12.00    16.68   -28.05%   $    698,915    -22.43%
Des Plaines                   16       345   $     346,498         67      18      312       $     252,085  10.43    18.13   -42.49%   $    309,638    -18.59%
Dolton                       419       245   $      91,459         21      40      262       $     52,396   9.10     11.03   -17.48%   $     96,551    -45.73%
Downers Grove                515       365   $     530,533         45        6     318       $     396,285  11.87    13.02    -8.84%   $    458,595    -13.59%
Elgin                        123       859   $     274,140        152      59      650       $     180,972  11.97    16.55   -27.65%   $    224,969    -19.56%
Elk Grove Village              7       142   $     312,343         28        9     110       $     286,706  11.59    11.84    -2.06%   $    319,400    -10.24%
Elmhurst                     126       311   $     583,146         67        9     312       $     429,523  9.62     10.67    -9.88%   $    510,524    -15.87%
Elmwood Park                 635       133   $     302,746         37      23      116       $     226,436  9.07     19.22   -52.82%   $    269,305    -15.92%
Evanston                     201       264   $     677,599         41      20      299       $     498,103  8.80     9.73     -9.53%   $    633,911    -21.42%
Evergreen Park               642       140   $     209,372         23        9     150       $     175,813  9.23     14.90   -38.03%   $    204,482    -14.02%
Flossmoor                    422       147   $     376,894         21        7     111       $     231,249  12.69    19.93   -36.31%   $    321,973    -28.18%
Forest Park                  130        55   $     305,581           8       3       48      $     255,250  11.19    15.18   -26.33%   $    326,283    -21.77%
Fox Lake                      20       100   $     315,945         14        3       48      $     175,370  18.46    18.00     2.56%   $    240,477    -27.07%
Fox River Grove               21        55   $     289,813           4       1       25      $     253,312  22.00    10.53   108.91%   $    291,325    -13.05%


      Data Source: MRED LLC
      Midwest Real Estate Data, LLC                          (C) Copyright 2009, A. L. Wagner Appraisal Group                                   Page 2
October 1, 2009 Statistics                                 October 1, 2008 Statistics
                                                              Under    Under # of Sales                                                               12 mo SP
                            MLS                 Average      Contract Contract  Last            Average    MONTHS   MONTHS   Percent      Average       Percent
Town                        Area   Actives     List Price     (Ctg.)   (Pend) 12 mos.          Sale Price  SUPPLY   SUPPLY   Change      Sale Price    Change
Frankfort                    423       298   $     480,343         27        5     201       $     345,194  15.35    14.34     7.06%   $    365,901      -5.66%
Franklin Park                131       136   $     209,911         38      18        99      $     163,246  10.53    19.96   -47.26%   $    212,720    -23.26%
Geneva                       134       198   $     455,649         49        4     251       $     354,975  7.82     9.68    -19.25%   $    377,411      -5.94%
Glen Ellyn                   137       297   $     635,668         60        2     232       $     412,950  12.12    11.29     7.37%   $    507,913    -18.70%
Glencoe                       22       104   $ 1,903,174           18        8       90      $ 1,094,468    10.76    14.60   -26.33%   $ 1,388,150     -21.16%
Glendale Heights             139       135   $     225,552         37      11      170       $     166,431  7.43     17.51   -57.56%   $    220,173    -24.41%
Glenview                      25       447   $     804,066         50      20      290       $     573,527  14.90    16.12    -7.56%   $    777,723    -26.26%
Glenwood                     425        55   $     145,743         14      14        75      $     101,166  6.41     9.76    -34.33%   $    136,584    -25.93%
Gurnee                        31       257   $     351,718         42        9     220       $     288,301  11.38    11.96    -4.84%   $    335,226    -14.00%
Hanover Park                 103       136   $     209,786         46      10      168       $     173,815  7.29     10.90   -33.15%   $    217,793    -20.19%
Harvey                       426       185   $      65,015         11      47      240       $     20,910   7.45     14.20   -47.54%   $     53,426    -60.86%
Harwood Heights              656        56   $     358,438           4       3       37      $     258,446  15.27    30.00   -49.09%   $    295,840    -12.64%
Hazel Crest                  429       121   $     123,746         12      12      137       $     66,906   9.02     11.63   -22.45%   $    113,632    -41.12%
Hickory Hills                457        73   $     277,332         10        4       43      $     218,316  15.37    23.23   -33.85%   $    273,756    -20.25%
Highland Park                 35       375   $ 1,005,686           30      13      196       $     618,647  18.83    14.61    28.85%   $    788,672    -21.56%
Hillside                     162        47   $     212,534         10        9       45      $     149,771  8.81     20.27   -56.52%   $    202,542    -26.05%
Hinkley                      520        25   $     274,148           1       1       11      $     190,182  23.08    14.73    56.70%   $    235,474    -19.23%
Hinsdale                     521       280   $ 1,368,971           34      11      205       $     938,144  13.44    18.05   -25.55%   $ 1,263,886     -25.77%
Hoffman Estates              194       207   $     370,568         34      13      227       $     292,073  9.07     10.30   -11.95%   $    342,769    -14.79%
Homer Glen                   500       217   $     518,603         24        9     107       $     342,280  18.60    25.06   -25.77%   $    400,178    -14.47%
Homewood                     430       133   $     186,573         27      13      172       $     157,217  7.53     8.34     -9.77%   $    189,057    -16.84%
Indian Head Park             531        16   $     472,634           0       0        3      $     725,500  64.00    27.43   133.33%   $    461,167     57.32%
Inverness                   7167       107   $ 1,002,971             5       0       39      $     645,671  29.18    18.21    60.28%   $    727,810    -11.29%
Itasca                       143        72   $     535,274         11        1       34      $     337,221  18.78    22.09   -14.98%   $    425,869    -20.82%
Joliet                       499       713   $     172,296        121      75      719       $     135,890  9.35     11.09   -15.69%   $    165,377    -17.83%
Justice                      458        39   $     272,750           8       7       27      $     183,067  11.14    32.57   -65.79%   $    236,210    -22.50%
Kenilworth                    43        58   $ 2,127,672             1       3       20      $ 1,444,873    29.00    16.29    78.07%   $ 1,961,687     -26.35%
LaGrange Park                526        62   $     402,562           7       3       96      $     345,326  7.02     8.95    -21.55%   $    374,878      -7.88%
LaGrange                     525       118   $     597,829         16        3     128       $     455,757  9.63     12.60   -23.52%   $    567,969    -19.76%
Lake Bluff                    44       113   $ 1,345,604           10        3       55      $     653,342  19.94    15.28    30.47%   $    676,338      -3.40%
Lake Forest                   45       347   $ 1,896,487           24        9     138       $ 1,181,319    24.35    22.33     9.05%   $ 1,319,945     -10.50%
Lake In The Hills            156       150   $     294,129         54        9     214       $     214,065  6.50     10.41   -37.59%   $    240,389    -10.95%
Lake Villa & Lindenhurst      46       258   $     298,285         36      13      240       $     237,006  10.71    12.63   -15.18%   $    292,878    -19.08%
Lansing                      438       252   $     157,729         30      22      202       $     111,692  11.91    14.33   -16.92%   $    145,195    -23.07%
Lemont                       439       185   $     551,271         25        8     111       $     399,862  15.42    19.65   -21.52%   $    431,266      -7.28%
Libertyville & Green Oaks     48       275   $     703,547         34        9     191       $     480,111  14.10    16.78   -15.95%   $    539,398    -10.99%


       Data Source: MRED LLC
       Midwest Real Estate Data, LLC                         (C) Copyright 2009, A. L. Wagner Appraisal Group                                   Page 3
October 1, 2009 Statistics                                 October 1, 2008 Statistics
                                                             Under    Under # of Sales                                                               12 mo SP
                           MLS                 Average      Contract Contract  Last            Average    MONTHS   MONTHS   Percent      Average       Percent
Town                       Area   Actives     List Price     (Ctg.)   (Pend) 12 mos.          Sale Price  SUPPLY   SUPPLY   Change      Sale Price    Change
Lincolnshire                 69        91   $     867,011         11        3       48      $     544,083  17.61    20.79   -15.26%   $    667,606    -18.50%
Lincolnwood                 645       116   $     701,959         21      13        81      $     422,857  12.10    22.20   -45.48%   $    572,778    -26.17%
Lisle                       532       117   $     467,699         14        2      103      $     347,196  11.80    9.79     20.55%   $    371,256      -6.48%
Lockport                    495       281   $     281,896         36      15       172      $     214,527  15.12    11.82    27.93%   $    242,275    -11.45%
Lombard                     148       224   $     355,599         46        6      262      $     266,967  8.56     11.09   -22.83%   $    307,809    -13.27%
Lynwood                    5411        75   $     240,303         15        6       38      $     184,957  15.25    16.60    -8.12%   $    236,714    -21.86%
Lyons                       534        58   $     188,716           9     11        52      $     131,383  9.67     15.33   -36.96%   $    189,447    -30.65%
Markham                    4426       111   $     111,962         12      16       192      $     44,472   6.05     14.25   -57.51%   $     85,350    -47.89%
Matteson                    443       155   $     203,881         35      18       170      $     171,624  8.34     11.20   -25.55%   $    207,718    -17.38%
Maywood                     153       129   $     122,629         20      29       146      $     65,427   7.94     15.88   -50.01%   $    128,576    -49.11%
Medinah                     157        33   $     414,209           5       3       15      $     395,327  17.22    46.91   -63.30%   $    336,700     17.41%
Melrose Park                160        89   $     214,151         16      15        81      $     140,744  9.54     29.04   -67.16%   $    210,965    -33.29%
McHenry                      50       578   $     325,941         85      19       346      $     197,299  15.41    13.66    12.80%   $    220,023    -10.33%
Minooka                     447       115   $     319,706         14        7       76      $     201,011  14.23    17.87   -20.39%   $    231,977    -13.35%
Midlothian                  445        77   $     189,543         15      10        91      $     125,395  7.97     11.45   -30.46%   $    167,270    -25.03%
Mokena                      448       124   $     472,584         21        5      101      $     341,750  11.72    11.66     0.47%   $    373,821      -8.58%
Monee                       449        82   $     386,025         10        5      102      $     207,994  8.41     17.75   -52.62%   $    280,243    -25.78%
Montgomery                  538       166   $     194,965         56      20       238      $     183,108  6.34     10.42   -39.14%   $    206,103    -11.16%
Morton Grove                 53       153   $     418,731         26      13       135      $     307,562  10.55    14.79   -28.68%   $    389,285    -20.99%
Mt. Prospect                 56       234   $     369,234         40      14       252      $     315,282  9.18     12.63   -27.37%   $    365,913    -13.84%
Mundelein                    60       283   $     359,392         45      17       213      $     246,998  12.35    14.22   -13.13%   $    317,188    -22.13%
Naperville                  540       905   $     668,504        167      28     1,025      $     443,896  8.90     9.45     -5.77%   $    495,515    -10.42%
New Lenox                   451       213   $     371,208         32        6      161      $     302,451  12.84    10.43    23.14%   $    295,900       2.21%
Niles                       648       159   $     405,558         29      12       123      $     302,803  11.63    20.64   -43.64%   $    355,910    -14.92%
Norridge                    634       107   $     419,818         20      14        86      $     278,993  10.70    17.78   -39.83%   $    338,564    -17.60%
North Aurora                542       130   $     291,434         18        3       97      $     263,516  13.22    11.45    15.45%   $    282,753      -6.80%
North Chicago                64        78   $     121,331           9       8       90      $      56,569  8.75     15.20   -42.45%   $     87,887    -35.63%
North Riverside             547        26   $     254,210           1       0       43      $     218,980  7.09     8.60    -17.58%   $    256,463    -14.62%
Northbrook                   62       306   $     801,854         42      16       244      $     603,991  12.16    13.44    -9.50%   $    673,082    -10.26%
Northfield                 7193        77   $     904,305           2       5       35      $     897,889  22.00    20.20     8.94%   $    982,165      -8.58%
Northlake                   164        73   $     206,754         16      15        70      $     138,187  8.67     16.25   -46.64%   $    200,660    -31.13%
Oak Brook                   523       121   $ 1,724,370             8       1       44      $ 1,318,124    27.40    25.50     7.44%   $ 1,033,564      27.53%
Oak Forest                  452       129   $     227,449         27        8      150      $     181,798  8.37     10.99   -23.85%   $    210,359    -13.58%
Oak Lawn                    453       263   $     263,178         40      16       270      $     199,441  9.68     13.17   -26.51%   $    246,386    -19.05%
Oak Park                    302       185   $     521,713         47      15       295      $     422,827  6.22     8.20    -24.13%   $    487,186    -13.21%
Olympia Fields              461        61   $     310,770         16        2       54      $     203,368  10.17    14.90   -31.78%   $    225,001      -9.61%


       Data Source: MRED LLC
       Midwest Real Estate Data, LLC                        (C) Copyright 2009, A. L. Wagner Appraisal Group                                   Page 4
October 1, 2009 Statistics                                 October 1, 2008 Statistics
                                                             Under    Under # of Sales                                                               12 mo SP
                           MLS                 Average      Contract Contract  Last            Average    MONTHS   MONTHS   Percent      Average       Percent
Town                       Area   Actives     List Price     (Ctg.)   (Pend) 12 mos.          Sale Price  SUPPLY   SUPPLY   Change      Sale Price    Change
Orland Park                 462       281   $     520,007         43      10      274       $     360,230  10.31    11.40    -9.53%   $    380,564      -5.34%
Oswego                      543       255   $     342,297         52      15      288       $     257,616  8.62     11.64   -25.95%   $    287,553    -10.41%
Palatine                     67       316   $     474,662         36        7     280       $     372,740  11.74    13.25   -11.43%   $    432,020    -13.72%
Palos Heights               463        93   $     459,816           8       4       61      $     309,008  15.29    10.76    42.10%   $    357,495    -13.56%
Palos Hills                 465        49   $     314,629         13        1       53      $     238,969  8.78     11.45   -23.38%   $    274,622    -12.98%
Palos Park                  464        80   $     757,367           9       1       42      $     527,345  18.46    29.29   -36.98%   $    568,019      -7.16%
Park Forest                 466       190   $     106,073         26      44      221       $     64,890   7.84     13.54   -42.12%   $     99,386    -34.71%
Park Ridge                   68       330   $     654,576         49      13      231       $     473,406  13.52    16.49   -18.06%   $    521,972      -9.30%
Peotone                     468        64   $     347,377           7       4       28      $     230,267  19.69    20.00    -1.54%   $    235,924      -2.40%
Plainfield                  544       755   $     309,492        153      45      839       $     243,485  8.74     11.34   -22.92%   $    281,183    -13.41%
Posen                       469        45   $     128,770           4       4       39      $      93,682  11.49    14.40   -20.21%   $    137,436    -31.84%
Prospect Heights             70        57   $     524,561           8       2       45      $     365,376  12.44    28.80   -56.82%   $    454,476    -19.61%
Richton Park                471        94   $     159,026         17      16      100       $     116,679  8.48     13.98   -39.34%   $    168,703    -30.84%
River Forest                305        82   $     898,599         10        1       73      $     793,904  11.71    10.81     8.32%   $    875,926      -9.36%
River Grove                 171        66   $     224,371         12        8       44      $     199,393  12.38    15.76   -21.50%   $    245,724    -18.85%
Riverdale                   627        88   $      71,451           5     18      104       $      38,291  8.31     13.08   -36.44%   $     78,910    -51.48%
Riverside                   546        87   $     561,211         13        3       48      $     412,564  16.31    16.30     0.09%   $    458,535    -10.03%
Rolling Meadows               8        71   $     319,131         16        5     102       $     248,075  6.93     10.57   -34.46%   $    300,472    -17.44%
Romeoville                  494       223   $     197,410         80      28      291       $     158,923  6.71     12.91   -48.03%   $    194,652    -18.36%
Roselle & Keeneyville       172       120   $     387,360         21        8       99      $     291,523  11.25    10.72     4.91%   $    336,825    -13.45%
Round Lake                   73       400   $     177,907         90      35      437       $     134,566  8.54     13.71   -37.72%   $    174,991    -23.10%
Sauk Village                414        83   $     101,501           8     19      134       $      48,259  6.19     12.65   -51.08%   $     92,497    -47.83%
Schaumburg                  193       171   $     425,439         42      11      212       $     302,816  7.74     9.15    -15.38%   $    348,523    -13.11%
Shorewood                   496       140   $     308,408         28        8     128       $     259,192  10.24    13.12   -21.90%   $    274,031      -5.42%
Skokie                       76       268   $     415,088         73      30      276       $     303,852  8.49     13.61   -37.65%   $    358,432    -15.23%
South Elgin                 177       110   $     343,406         21        7     118       $     257,803  9.04     10.01    -9.69%   $    295,811    -12.85%
South Holland               473       204   $     166,710         25      42      232       $     109,628  8.19     11.37   -27.97%   $    156,945    -30.15%
St. Charles                 174       545   $     644,358         67        6     371       $     401,602  14.73    13.79     6.80%   $    476,067    -15.64%
Steger                      475        82   $     157,369           8       3       59      $      92,736  14.06    8.67     62.07%   $    137,927    -32.76%
Stickney                    404        63   $     220,263         13      13        61      $     152,148  8.69     15.43   -43.68%   $    216,482    -29.72%
Streamwood                  107       213   $     252,461         56      26      217       $     182,883  8.55     13.22   -35.35%   $    237,581    -23.02%
Sugar Grove                 554       103   $     393,410         17        1       68      $     316,753  14.37    13.75     4.54%   $    364,823    -13.18%
Summit                      501        44   $     173,615           5       4       27      $     112,144  14.67    30.92   -52.57%   $    159,852    -29.84%
Thornton                    476        26   $     125,481           2       0       18      $     116,500  15.60    16.17    -3.55%   $    137,243    -15.11%
Tinley Park                 477       226   $     320,046         39        4     198       $     253,854  11.25    9.87     13.97%   $    280,926      -9.64%
University Park            5466        55   $     135,559           7       6       67      $      72,722  8.25     15.05   -45.17%   $    139,495    -47.87%


       Data Source: MRED LLC
       Midwest Real Estate Data, LLC                        (C) Copyright 2009, A. L. Wagner Appraisal Group                                   Page 5
October 1, 2009 Statistics                                              October 1, 2008 Statistics
                                                                       Under    Under # of Sales                                                                            12 mo SP
                                     MLS                 Average      Contract Contract  Last            Average    MONTHS           MONTHS        Percent      Average       Percent
Town                                 Area   Actives     List Price     (Ctg.)   (Pend) 12 mos.          Sale Price  SUPPLY           SUPPLY        Change      Sale Price    Change
Vernon Hills                           61       121   $     507,895         14        0     114       $     435,921  11.34            10.18         11.46%   $    500,543    -12.91%
Villa Park                            186       133   $     266,292         32        7     157       $     207,579  8.14             12.30        -33.79%   $    257,509    -19.39%
Warrenville                           555        65   $     393,629         13        4       64      $     213,196  9.63             12.66        -23.92%   $    289,714    -26.41%
Waukegan & Park City                   85       411   $     136,936         61      42      491       $     88,714   8.30             13.22        -37.17%   $    135,606    -34.58%
Wayne                                 184        49   $ 1,023,973             6       1       17      $     536,853  24.50            51.00        -51.96%   $    531,111       1.08%
West Chicago                          185       239   $     326,333         50      15      163       $     208,646  12.58            18.32        -31.32%   $    280,638    -25.65%
Westchester                           154       159   $     268,942         24      11      129       $     225,559  11.63            16.09        -27.68%   $    270,408    -16.59%
Western Springs                       558        99   $     729,652         14        1       90      $     598,784  11.31            10.96          3.19%   $    655,376      -8.63%
Westmont                              559       114   $     362,734         17        7     104       $     356,208  10.69            12.86        -16.88%   $    353,384       0.80%
Wheaton                               187       388   $     535,193         72        6     337       $     398,017  11.22            10.03         11.90%   $    416,396      -4.41%
Wheeling                               90       126   $     279,486         27        2     109       $     222,159  10.96            18.20        -39.79%   $    271,602    -18.20%
Willow Springs                        480        39   $     483,518           0       1       27      $     405,259  16.71            17.29         -3.35%   $    373,119       8.61%
Willowbrook                           516        47   $     841,545           7       0       39      $     423,926  12.26            18.95        -35.29%   $    515,532    -17.77%
Wilmette                               91       203   $     904,164         38      11      198       $     799,746  9.86             9.71           1.54%   $    925,797    -13.62%
Winfield                              190        80   $     475,221           8       1       61      $     370,826  13.71            10.86         26.32%   $    357,243       3.80%
Winnetka                               93       215   $ 1,978,457           18      16      132       $ 1,449,169    15.54            13.42         15.85%   $ 1,602,897       -9.59%
Wood Dale                             191        97   $     361,242         19        6       63      $     240,836  13.23            19.11        -30.77%   $    339,406    -29.04%
Woodridge                             517       128   $     357,484         20        4     159       $     268,907  8.39             10.34        -18.86%   $    315,273    -14.71%
Woodstock & Greenwood                  98       279   $     424,723         39        5     153       $     223,586  16.99            17.19         -1.16%   $    275,411    -18.82%
Worth                                 482        51   $     233,889           6       8       38      $     179,890  11.77            14.93        -21.19%   $    229,773    -21.71%
Yorkville                             560       262   $     371,736         36        6     195       $     251,495  13.27            17.64        -24.78%   $    297,222    -15.38%
Zion                                   99       240   $     160,870         40      24      228       $     99,660   9.86             12.18        -18.99%   $    124,537    -19.98%

City of CHICAGO                      8000     6,780 $      390,533        1,071     1,034      7,434 $     227,756       8.53          13.77       -38.04% $     333,246     -31.66%
                           :
TOTALS (all areas in report)         8099    40,100 $      437,600        6,622     3,348     37,402 $     272,839       10.16         13.40       -24.17% $     345,986     -21.14%

ALL AREAS                            ALL     44,895 $      430,160        7,279     3,591     40,772 $     269,073       10.43         13.54       -22.95% $     338,962     -20.62%
(including areas not listed above)

A balanced market typically has a 3.00 to 4.00 months supply. Less than that is undersupplied, more is oversupplied
Average Sales Price changes may be exaggerated if significant amount of New Construction is reported in the MLS.
Average Sales Price noted from previous year to current year should not be construed as Appreciation - it is percent of change of average sales price.


         Data Source: MRED LLC
         Midwest Real Estate Data, LLC                                (C) Copyright 2009, A. L. Wagner Appraisal Group                                                Page 6

More Related Content

What's hot

The US Housing Market - Housing Supply & Demand
The US Housing Market - Housing Supply & DemandThe US Housing Market - Housing Supply & Demand
The US Housing Market - Housing Supply & DemandAltos Research
 
August 2011 Market Pulse - Attached Homes
August 2011 Market Pulse - Attached HomesAugust 2011 Market Pulse - Attached Homes
August 2011 Market Pulse - Attached Homeschipwags
 
Electronic Security Expo 2012 Attrition Toolbox
Electronic Security Expo 2012 Attrition ToolboxElectronic Security Expo 2012 Attrition Toolbox
Electronic Security Expo 2012 Attrition Toolboxstevespott
 
February 2011 Austin Real Estate Stats
February 2011 Austin Real Estate StatsFebruary 2011 Austin Real Estate Stats
February 2011 Austin Real Estate StatsKristee Leonard
 
Dallas Market Update January 2008
Dallas Market Update January 2008Dallas Market Update January 2008
Dallas Market Update January 2008Dee Patience
 
Math in the News: 11/21/11
Math in the News: 11/21/11Math in the News: 11/21/11
Math in the News: 11/21/11Media4math
 
Builder 100 \'07
Builder 100 \'07Builder 100 \'07
Builder 100 \'07guest2a50d8
 
Https _doc-0c-78-apps-viewer.googleusercontent
Https  _doc-0c-78-apps-viewer.googleusercontentHttps  _doc-0c-78-apps-viewer.googleusercontent
Https _doc-0c-78-apps-viewer.googleusercontentfoilicj1
 
Metro Area Monthly Mortgage Payments: 2005 vs 2010
Metro Area Monthly Mortgage Payments: 2005 vs 2010Metro Area Monthly Mortgage Payments: 2005 vs 2010
Metro Area Monthly Mortgage Payments: 2005 vs 2010NAR Research
 
Metro Monthly Payments 2005 vs 2010
Metro Monthly Payments 2005 vs 2010Metro Monthly Payments 2005 vs 2010
Metro Monthly Payments 2005 vs 2010NAR Research
 
Recording Fee and Tax Certification Chart July 2014
Recording Fee and Tax Certification Chart July 2014Recording Fee and Tax Certification Chart July 2014
Recording Fee and Tax Certification Chart July 2014Patty Meadows-Smith
 

What's hot (20)

Taller 13
Taller 13Taller 13
Taller 13
 
The US Housing Market - Housing Supply & Demand
The US Housing Market - Housing Supply & DemandThe US Housing Market - Housing Supply & Demand
The US Housing Market - Housing Supply & Demand
 
August 2011 Market Pulse - Attached Homes
August 2011 Market Pulse - Attached HomesAugust 2011 Market Pulse - Attached Homes
August 2011 Market Pulse - Attached Homes
 
Tmo Feb
Tmo FebTmo Feb
Tmo Feb
 
Forecast
ForecastForecast
Forecast
 
Electronic Security Expo 2012 Attrition Toolbox
Electronic Security Expo 2012 Attrition ToolboxElectronic Security Expo 2012 Attrition Toolbox
Electronic Security Expo 2012 Attrition Toolbox
 
Heart Disease
Heart DiseaseHeart Disease
Heart Disease
 
Total Market Overview
Total Market OverviewTotal Market Overview
Total Market Overview
 
February 2011 Austin Real Estate Stats
February 2011 Austin Real Estate StatsFebruary 2011 Austin Real Estate Stats
February 2011 Austin Real Estate Stats
 
Jan Tmo
Jan TmoJan Tmo
Jan Tmo
 
Dallas Market Update January 2008
Dallas Market Update January 2008Dallas Market Update January 2008
Dallas Market Update January 2008
 
Montana Housing Outlook 2011
Montana Housing Outlook 2011Montana Housing Outlook 2011
Montana Housing Outlook 2011
 
Math in the News: 11/21/11
Math in the News: 11/21/11Math in the News: 11/21/11
Math in the News: 11/21/11
 
Builder 100 \'07
Builder 100 \'07Builder 100 \'07
Builder 100 \'07
 
Https _doc-0c-78-apps-viewer.googleusercontent
Https  _doc-0c-78-apps-viewer.googleusercontentHttps  _doc-0c-78-apps-viewer.googleusercontent
Https _doc-0c-78-apps-viewer.googleusercontent
 
Demographics & Housing - Lake Elsinore CA 8-20-15
Demographics & Housing - Lake Elsinore CA 8-20-15Demographics & Housing - Lake Elsinore CA 8-20-15
Demographics & Housing - Lake Elsinore CA 8-20-15
 
Metro Area Monthly Mortgage Payments: 2005 vs 2010
Metro Area Monthly Mortgage Payments: 2005 vs 2010Metro Area Monthly Mortgage Payments: 2005 vs 2010
Metro Area Monthly Mortgage Payments: 2005 vs 2010
 
Metro Monthly Payments 2005 vs 2010
Metro Monthly Payments 2005 vs 2010Metro Monthly Payments 2005 vs 2010
Metro Monthly Payments 2005 vs 2010
 
Total Market overview for Portland
Total Market overview for PortlandTotal Market overview for Portland
Total Market overview for Portland
 
Recording Fee and Tax Certification Chart July 2014
Recording Fee and Tax Certification Chart July 2014Recording Fee and Tax Certification Chart July 2014
Recording Fee and Tax Certification Chart July 2014
 

Similar to Wag Report 2009 Q4 De 12 Mo

Rebgv stats package%2_c_october_2011_%282%29
Rebgv stats package%2_c_october_2011_%282%29Rebgv stats package%2_c_october_2011_%282%29
Rebgv stats package%2_c_october_2011_%282%29vancouverhomesteam
 
October 2011 REBGV Stats Mike Stewart
October 2011 REBGV Stats Mike StewartOctober 2011 REBGV Stats Mike Stewart
October 2011 REBGV Stats Mike StewartMike Stewart
 
Rebgv stats package%2_c_october_2011_%282%29
Rebgv stats package%2_c_october_2011_%282%29Rebgv stats package%2_c_october_2011_%282%29
Rebgv stats package%2_c_october_2011_%282%29vancouverhomesteam
 
November 2011-rebgv-stats-adam scalena
November 2011-rebgv-stats-adam scalenaNovember 2011-rebgv-stats-adam scalena
November 2011-rebgv-stats-adam scalenavancouverhomesteam
 
Vancouver real estate stats package, December 2011
Vancouver real estate stats package, December 2011Vancouver real estate stats package, December 2011
Vancouver real estate stats package, December 2011Matt Collinge
 
REBGV Stats for December 2011 Courtesy Mike Stewart Vancouver Realtor
REBGV Stats for December 2011 Courtesy Mike Stewart Vancouver RealtorREBGV Stats for December 2011 Courtesy Mike Stewart Vancouver Realtor
REBGV Stats for December 2011 Courtesy Mike Stewart Vancouver RealtorMike Stewart
 
Vancouver real estate stats package September 2011
Vancouver real estate stats package September 2011Vancouver real estate stats package September 2011
Vancouver real estate stats package September 2011Matt Collinge
 
REBGV Stats for Sept 2011 Mike Stewart
REBGV Stats for Sept 2011 Mike StewartREBGV Stats for Sept 2011 Mike Stewart
REBGV Stats for Sept 2011 Mike StewartMike Stewart
 
Vancouver real estate stats package, june 2011
Vancouver real estate stats package, june 2011Vancouver real estate stats package, june 2011
Vancouver real estate stats package, june 2011Matt Collinge
 
Wag Report 2009 11 De
Wag Report 2009 11 DeWag Report 2009 11 De
Wag Report 2009 11 Dechipwags
 
March 2099 Stats Real Estate Board Of Greater Vancouver
March 2099 Stats Real Estate Board Of Greater VancouverMarch 2099 Stats Real Estate Board Of Greater Vancouver
March 2099 Stats Real Estate Board Of Greater VancouverChristopher R Anderson
 
H W 2010 07 De
H W 2010 07 DeH W 2010 07 De
H W 2010 07 Dechipwags
 
Vancouver real estate rebgv stats package january 2011
Vancouver real estate rebgv stats package january 2011Vancouver real estate rebgv stats package january 2011
Vancouver real estate rebgv stats package january 2011Matt Collinge
 
Chicagoland Monthly Maket Pulse -Feb 2010 Detached
Chicagoland Monthly Maket Pulse -Feb 2010 DetachedChicagoland Monthly Maket Pulse -Feb 2010 Detached
Chicagoland Monthly Maket Pulse -Feb 2010 Detachedchipwags
 
Boston Real Estate Report
Boston Real Estate ReportBoston Real Estate Report
Boston Real Estate ReportJoshua Stiles
 
BORRELL Mobile ad spend by dma
BORRELL Mobile ad spend by dmaBORRELL Mobile ad spend by dma
BORRELL Mobile ad spend by dmaWhere10
 
Napco Better Result
Napco Better ResultNapco Better Result
Napco Better Resultpmoskie
 

Similar to Wag Report 2009 Q4 De 12 Mo (20)

Rebgv stats package%2_c_october_2011_%282%29
Rebgv stats package%2_c_october_2011_%282%29Rebgv stats package%2_c_october_2011_%282%29
Rebgv stats package%2_c_october_2011_%282%29
 
Stats Oct 11
Stats Oct 11Stats Oct 11
Stats Oct 11
 
October 2011 REBGV Stats Mike Stewart
October 2011 REBGV Stats Mike StewartOctober 2011 REBGV Stats Mike Stewart
October 2011 REBGV Stats Mike Stewart
 
Rebgv stats package%2_c_october_2011_%282%29
Rebgv stats package%2_c_october_2011_%282%29Rebgv stats package%2_c_october_2011_%282%29
Rebgv stats package%2_c_october_2011_%282%29
 
November 2011-rebgv-stats-adam scalena
November 2011-rebgv-stats-adam scalenaNovember 2011-rebgv-stats-adam scalena
November 2011-rebgv-stats-adam scalena
 
Vancouver real estate stats package, December 2011
Vancouver real estate stats package, December 2011Vancouver real estate stats package, December 2011
Vancouver real estate stats package, December 2011
 
REBGV Stats for December 2011 Courtesy Mike Stewart Vancouver Realtor
REBGV Stats for December 2011 Courtesy Mike Stewart Vancouver RealtorREBGV Stats for December 2011 Courtesy Mike Stewart Vancouver Realtor
REBGV Stats for December 2011 Courtesy Mike Stewart Vancouver Realtor
 
Vancouver real estate stats package September 2011
Vancouver real estate stats package September 2011Vancouver real estate stats package September 2011
Vancouver real estate stats package September 2011
 
September 2011 REBGV
September 2011 REBGV September 2011 REBGV
September 2011 REBGV
 
REBGV Stats for Sept 2011 Mike Stewart
REBGV Stats for Sept 2011 Mike StewartREBGV Stats for Sept 2011 Mike Stewart
REBGV Stats for Sept 2011 Mike Stewart
 
Vancouver real estate stats package, june 2011
Vancouver real estate stats package, june 2011Vancouver real estate stats package, june 2011
Vancouver real estate stats package, june 2011
 
Wag Report 2009 11 De
Wag Report 2009 11 DeWag Report 2009 11 De
Wag Report 2009 11 De
 
March 2099 Stats Real Estate Board Of Greater Vancouver
March 2099 Stats Real Estate Board Of Greater VancouverMarch 2099 Stats Real Estate Board Of Greater Vancouver
March 2099 Stats Real Estate Board Of Greater Vancouver
 
H W 2010 07 De
H W 2010 07 DeH W 2010 07 De
H W 2010 07 De
 
Vancouver real estate rebgv stats package january 2011
Vancouver real estate rebgv stats package january 2011Vancouver real estate rebgv stats package january 2011
Vancouver real estate rebgv stats package january 2011
 
Chicagoland Monthly Maket Pulse -Feb 2010 Detached
Chicagoland Monthly Maket Pulse -Feb 2010 DetachedChicagoland Monthly Maket Pulse -Feb 2010 Detached
Chicagoland Monthly Maket Pulse -Feb 2010 Detached
 
Boston Real Estate Report
Boston Real Estate ReportBoston Real Estate Report
Boston Real Estate Report
 
BORRELL Mobile ad spend by dma
BORRELL Mobile ad spend by dmaBORRELL Mobile ad spend by dma
BORRELL Mobile ad spend by dma
 
U.S. States Median Rent
U.S. States Median RentU.S. States Median Rent
U.S. States Median Rent
 
Napco Better Result
Napco Better ResultNapco Better Result
Napco Better Result
 

More from chipwags

H W 2011 10 At
H W 2011 10 AtH W 2011 10 At
H W 2011 10 Atchipwags
 
E Newsletter7 2010
E Newsletter7 2010E Newsletter7 2010
E Newsletter7 2010chipwags
 
H W 2010 07 At
H W 2010 07 AtH W 2010 07 At
H W 2010 07 Atchipwags
 
Chicagoland Monthly Maket Pulse -Feb 2010 Attached
Chicagoland Monthly Maket Pulse -Feb 2010 AttachedChicagoland Monthly Maket Pulse -Feb 2010 Attached
Chicagoland Monthly Maket Pulse -Feb 2010 Attachedchipwags
 
H W 2010 01 At
H W 2010 01 AtH W 2010 01 At
H W 2010 01 Atchipwags
 
Appraisal Foundation Presentation 2007
Appraisal Foundation Presentation 2007Appraisal Foundation Presentation 2007
Appraisal Foundation Presentation 2007chipwags
 

More from chipwags (6)

H W 2011 10 At
H W 2011 10 AtH W 2011 10 At
H W 2011 10 At
 
E Newsletter7 2010
E Newsletter7 2010E Newsletter7 2010
E Newsletter7 2010
 
H W 2010 07 At
H W 2010 07 AtH W 2010 07 At
H W 2010 07 At
 
Chicagoland Monthly Maket Pulse -Feb 2010 Attached
Chicagoland Monthly Maket Pulse -Feb 2010 AttachedChicagoland Monthly Maket Pulse -Feb 2010 Attached
Chicagoland Monthly Maket Pulse -Feb 2010 Attached
 
H W 2010 01 At
H W 2010 01 AtH W 2010 01 At
H W 2010 01 At
 
Appraisal Foundation Presentation 2007
Appraisal Foundation Presentation 2007Appraisal Foundation Presentation 2007
Appraisal Foundation Presentation 2007
 

Recently uploaded

Monte Carlo simulation : Simulation using MCSM
Monte Carlo simulation : Simulation using MCSMMonte Carlo simulation : Simulation using MCSM
Monte Carlo simulation : Simulation using MCSMRavindra Nath Shukla
 
The Coffee Bean & Tea Leaf(CBTL), Business strategy case study
The Coffee Bean & Tea Leaf(CBTL), Business strategy case studyThe Coffee Bean & Tea Leaf(CBTL), Business strategy case study
The Coffee Bean & Tea Leaf(CBTL), Business strategy case studyEthan lee
 
Lucknow 💋 Escorts in Lucknow - 450+ Call Girl Cash Payment 8923113531 Neha Th...
Lucknow 💋 Escorts in Lucknow - 450+ Call Girl Cash Payment 8923113531 Neha Th...Lucknow 💋 Escorts in Lucknow - 450+ Call Girl Cash Payment 8923113531 Neha Th...
Lucknow 💋 Escorts in Lucknow - 450+ Call Girl Cash Payment 8923113531 Neha Th...anilsa9823
 
Pharma Works Profile of Karan Communications
Pharma Works Profile of Karan CommunicationsPharma Works Profile of Karan Communications
Pharma Works Profile of Karan Communicationskarancommunications
 
A DAY IN THE LIFE OF A SALESMAN / WOMAN
A DAY IN THE LIFE OF A  SALESMAN / WOMANA DAY IN THE LIFE OF A  SALESMAN / WOMAN
A DAY IN THE LIFE OF A SALESMAN / WOMANIlamathiKannappan
 
Mysore Call Girls 8617370543 WhatsApp Number 24x7 Best Services
Mysore Call Girls 8617370543 WhatsApp Number 24x7 Best ServicesMysore Call Girls 8617370543 WhatsApp Number 24x7 Best Services
Mysore Call Girls 8617370543 WhatsApp Number 24x7 Best ServicesDipal Arora
 
Best VIP Call Girls Noida Sector 40 Call Me: 8448380779
Best VIP Call Girls Noida Sector 40 Call Me: 8448380779Best VIP Call Girls Noida Sector 40 Call Me: 8448380779
Best VIP Call Girls Noida Sector 40 Call Me: 8448380779Delhi Call girls
 
Famous Olympic Siblings from the 21st Century
Famous Olympic Siblings from the 21st CenturyFamous Olympic Siblings from the 21st Century
Famous Olympic Siblings from the 21st Centuryrwgiffor
 
KYC-Verified Accounts: Helping Companies Handle Challenging Regulatory Enviro...
KYC-Verified Accounts: Helping Companies Handle Challenging Regulatory Enviro...KYC-Verified Accounts: Helping Companies Handle Challenging Regulatory Enviro...
KYC-Verified Accounts: Helping Companies Handle Challenging Regulatory Enviro...Any kyc Account
 
Call Girls in Gomti Nagar - 7388211116 - With room Service
Call Girls in Gomti Nagar - 7388211116  - With room ServiceCall Girls in Gomti Nagar - 7388211116  - With room Service
Call Girls in Gomti Nagar - 7388211116 - With room Servicediscovermytutordmt
 
Call Girls In Panjim North Goa 9971646499 Genuine Service
Call Girls In Panjim North Goa 9971646499 Genuine ServiceCall Girls In Panjim North Goa 9971646499 Genuine Service
Call Girls In Panjim North Goa 9971646499 Genuine Serviceritikaroy0888
 
Grateful 7 speech thanking everyone that has helped.pdf
Grateful 7 speech thanking everyone that has helped.pdfGrateful 7 speech thanking everyone that has helped.pdf
Grateful 7 speech thanking everyone that has helped.pdfPaul Menig
 
Monthly Social Media Update April 2024 pptx.pptx
Monthly Social Media Update April 2024 pptx.pptxMonthly Social Media Update April 2024 pptx.pptx
Monthly Social Media Update April 2024 pptx.pptxAndy Lambert
 
VIP Call Girls Gandi Maisamma ( Hyderabad ) Phone 8250192130 | ₹5k To 25k Wit...
VIP Call Girls Gandi Maisamma ( Hyderabad ) Phone 8250192130 | ₹5k To 25k Wit...VIP Call Girls Gandi Maisamma ( Hyderabad ) Phone 8250192130 | ₹5k To 25k Wit...
VIP Call Girls Gandi Maisamma ( Hyderabad ) Phone 8250192130 | ₹5k To 25k Wit...Suhani Kapoor
 
Creating Low-Code Loan Applications using the Trisotech Mortgage Feature Set
Creating Low-Code Loan Applications using the Trisotech Mortgage Feature SetCreating Low-Code Loan Applications using the Trisotech Mortgage Feature Set
Creating Low-Code Loan Applications using the Trisotech Mortgage Feature SetDenis Gagné
 
It will be International Nurses' Day on 12 May
It will be International Nurses' Day on 12 MayIt will be International Nurses' Day on 12 May
It will be International Nurses' Day on 12 MayNZSG
 
7.pdf This presentation captures many uses and the significance of the number...
7.pdf This presentation captures many uses and the significance of the number...7.pdf This presentation captures many uses and the significance of the number...
7.pdf This presentation captures many uses and the significance of the number...Paul Menig
 
Insurers' journeys to build a mastery in the IoT usage
Insurers' journeys to build a mastery in the IoT usageInsurers' journeys to build a mastery in the IoT usage
Insurers' journeys to build a mastery in the IoT usageMatteo Carbone
 

Recently uploaded (20)

Monte Carlo simulation : Simulation using MCSM
Monte Carlo simulation : Simulation using MCSMMonte Carlo simulation : Simulation using MCSM
Monte Carlo simulation : Simulation using MCSM
 
The Coffee Bean & Tea Leaf(CBTL), Business strategy case study
The Coffee Bean & Tea Leaf(CBTL), Business strategy case studyThe Coffee Bean & Tea Leaf(CBTL), Business strategy case study
The Coffee Bean & Tea Leaf(CBTL), Business strategy case study
 
Lucknow 💋 Escorts in Lucknow - 450+ Call Girl Cash Payment 8923113531 Neha Th...
Lucknow 💋 Escorts in Lucknow - 450+ Call Girl Cash Payment 8923113531 Neha Th...Lucknow 💋 Escorts in Lucknow - 450+ Call Girl Cash Payment 8923113531 Neha Th...
Lucknow 💋 Escorts in Lucknow - 450+ Call Girl Cash Payment 8923113531 Neha Th...
 
Pharma Works Profile of Karan Communications
Pharma Works Profile of Karan CommunicationsPharma Works Profile of Karan Communications
Pharma Works Profile of Karan Communications
 
A DAY IN THE LIFE OF A SALESMAN / WOMAN
A DAY IN THE LIFE OF A  SALESMAN / WOMANA DAY IN THE LIFE OF A  SALESMAN / WOMAN
A DAY IN THE LIFE OF A SALESMAN / WOMAN
 
Mysore Call Girls 8617370543 WhatsApp Number 24x7 Best Services
Mysore Call Girls 8617370543 WhatsApp Number 24x7 Best ServicesMysore Call Girls 8617370543 WhatsApp Number 24x7 Best Services
Mysore Call Girls 8617370543 WhatsApp Number 24x7 Best Services
 
Best VIP Call Girls Noida Sector 40 Call Me: 8448380779
Best VIP Call Girls Noida Sector 40 Call Me: 8448380779Best VIP Call Girls Noida Sector 40 Call Me: 8448380779
Best VIP Call Girls Noida Sector 40 Call Me: 8448380779
 
Famous Olympic Siblings from the 21st Century
Famous Olympic Siblings from the 21st CenturyFamous Olympic Siblings from the 21st Century
Famous Olympic Siblings from the 21st Century
 
KYC-Verified Accounts: Helping Companies Handle Challenging Regulatory Enviro...
KYC-Verified Accounts: Helping Companies Handle Challenging Regulatory Enviro...KYC-Verified Accounts: Helping Companies Handle Challenging Regulatory Enviro...
KYC-Verified Accounts: Helping Companies Handle Challenging Regulatory Enviro...
 
Call Girls in Gomti Nagar - 7388211116 - With room Service
Call Girls in Gomti Nagar - 7388211116  - With room ServiceCall Girls in Gomti Nagar - 7388211116  - With room Service
Call Girls in Gomti Nagar - 7388211116 - With room Service
 
unwanted pregnancy Kit [+918133066128] Abortion Pills IN Dubai UAE Abudhabi
unwanted pregnancy Kit [+918133066128] Abortion Pills IN Dubai UAE Abudhabiunwanted pregnancy Kit [+918133066128] Abortion Pills IN Dubai UAE Abudhabi
unwanted pregnancy Kit [+918133066128] Abortion Pills IN Dubai UAE Abudhabi
 
Call Girls In Panjim North Goa 9971646499 Genuine Service
Call Girls In Panjim North Goa 9971646499 Genuine ServiceCall Girls In Panjim North Goa 9971646499 Genuine Service
Call Girls In Panjim North Goa 9971646499 Genuine Service
 
Grateful 7 speech thanking everyone that has helped.pdf
Grateful 7 speech thanking everyone that has helped.pdfGrateful 7 speech thanking everyone that has helped.pdf
Grateful 7 speech thanking everyone that has helped.pdf
 
Monthly Social Media Update April 2024 pptx.pptx
Monthly Social Media Update April 2024 pptx.pptxMonthly Social Media Update April 2024 pptx.pptx
Monthly Social Media Update April 2024 pptx.pptx
 
VIP Call Girls Gandi Maisamma ( Hyderabad ) Phone 8250192130 | ₹5k To 25k Wit...
VIP Call Girls Gandi Maisamma ( Hyderabad ) Phone 8250192130 | ₹5k To 25k Wit...VIP Call Girls Gandi Maisamma ( Hyderabad ) Phone 8250192130 | ₹5k To 25k Wit...
VIP Call Girls Gandi Maisamma ( Hyderabad ) Phone 8250192130 | ₹5k To 25k Wit...
 
Creating Low-Code Loan Applications using the Trisotech Mortgage Feature Set
Creating Low-Code Loan Applications using the Trisotech Mortgage Feature SetCreating Low-Code Loan Applications using the Trisotech Mortgage Feature Set
Creating Low-Code Loan Applications using the Trisotech Mortgage Feature Set
 
It will be International Nurses' Day on 12 May
It will be International Nurses' Day on 12 MayIt will be International Nurses' Day on 12 May
It will be International Nurses' Day on 12 May
 
7.pdf This presentation captures many uses and the significance of the number...
7.pdf This presentation captures many uses and the significance of the number...7.pdf This presentation captures many uses and the significance of the number...
7.pdf This presentation captures many uses and the significance of the number...
 
Insurers' journeys to build a mastery in the IoT usage
Insurers' journeys to build a mastery in the IoT usageInsurers' journeys to build a mastery in the IoT usage
Insurers' journeys to build a mastery in the IoT usage
 
VVVIP Call Girls In Greater Kailash ➡️ Delhi ➡️ 9999965857 🚀 No Advance 24HRS...
VVVIP Call Girls In Greater Kailash ➡️ Delhi ➡️ 9999965857 🚀 No Advance 24HRS...VVVIP Call Girls In Greater Kailash ➡️ Delhi ➡️ 9999965857 🚀 No Advance 24HRS...
VVVIP Call Girls In Greater Kailash ➡️ Delhi ➡️ 9999965857 🚀 No Advance 24HRS...
 

Wag Report 2009 Q4 De 12 Mo

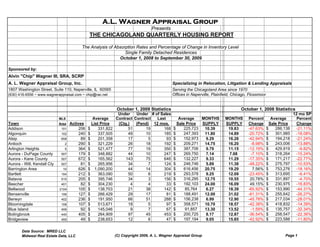
  • 1. A.L. Wagner Appraisal Group Presents THE CHICAGOLAND QUARTERLY HOUSING REPORT The Analysis of Absorption Rates and Percentage of Change in Inventory Level Single Family Detached Residences October 1, 2008 to September 30, 2009 Sponsored by: Alvin "Chip" Wagner III, SRA, SCRP A. L. Wagner Appraisal Group, Inc. Specializing in Relocation, Litigation & Lending Appraisals 1807 Washington Street, Suite 110, Naperville, IL 60565 Serving the Chicagoland Area since 1970 (630) 416-6556 ~ www.wagnerappraisal.com ~ chip@rac.net Offices in Naperville, Plainfield, Chicago, Flossmoor October 1, 2009 Statistics October 1, 2008 Statistics Under Under # of Sales 12 mo SP MLS Average Contract Contract Last Average MONTHS MONTHS Percent Average Percent Town Area Actives List Price (Ctg.) (Pend) 12 mos. Sale Price SUPPLY SUPPLY Change Sale Price Change Addison 101 206 $ 331,822 51 19 168 $ 225,723 10.39 19.83 -47.63% $ 286,138 -21.11% Algonquin 102 240 $ 337,505 49 10 185 $ 247,393 11.80 14.89 -20.72% $ 301,985 -18.08% Alsip 658 89 $ 201,358 17 5 93 $ 152,973 9.29 16.28 -42.94% $ 194,218 -21.24% Antioch 2 290 $ 321,229 26 18 192 $ 209,271 14.75 16.20 -8.98% $ 243,006 -13.88% Arlington Heights 5 364 $ 521,477 77 19 350 $ 387,706 9.79 11.15 -12.19% $ 429,919 -9.82% Aurora - DuPage County 507 179 $ 348,882 44 10 247 $ 269,750 7.14 7.68 -7.10% $ 318,264 -15.24% Aurora - Kane County 507 672 $ 165,562 143 75 646 $ 132,227 9.33 11.29 -17.35% $ 171,217 -22.77% Aurora - Will, Kendall Cty 507 81 $ 265,956 34 7 124 $ 246,746 5.89 11.38 -48.22% $ 275,797 -10.53% Barrington Area 10 626 $ 1,090,200 44 14 304 $ 616,456 20.75 19.29 7.56% $ 753,276 -18.16% Bartlett 104 212 $ 363,090 50 6 219 $ 293,578 9.25 12.09 -23.45% $ 313,695 -6.41% Batavia 510 205 $ 395,746 34 3 156 $ 316,295 12.75 10.55 20.78% $ 331,897 -4.70% Beecher 401 82 $ 304,230 4 4 33 $ 192,103 24.00 16.09 49.15% $ 230,975 -16.83% Bellwood 2104 105 $ 138,703 21 38 142 $ 85,764 6.27 18.39 -65.92% $ 153,990 -44.31% Bensenville 106 127 $ 266,429 29 17 81 $ 188,491 12.00 31.02 -61.31% $ 255,642 -26.27% Berwyn 402 236 $ 191,950 66 51 288 $ 156,238 6.99 12.90 -45.78% $ 217,034 -28.01% Bloomingdale 108 107 $ 513,671 18 5 97 $ 358,571 10.70 18.57 -42.38% $ 418,832 -14.39% Blue Island 406 92 $ 145,046 9 7 67 $ 91,857 13.30 13.52 -1.59% $ 135,757 -32.34% Bolingbrook 440 405 $ 264,909 97 45 453 $ 200,725 8.17 12.87 -36.54% $ 258,547 -22.36% Bridgeview 455 49 $ 238,653 12 6 47 $ 197,194 9.05 15.85 -42.92% $ 223,588 -11.80% Data Source: MRED LLC Midwest Real Estate Data, LLC (C) Copyright 2009, A. L. Wagner Appraisal Group Page 1
  • 2. October 1, 2009 Statistics October 1, 2008 Statistics Under Under # of Sales 12 mo SP MLS Average Contract Contract Last Average MONTHS MONTHS Percent Average Percent Town Area Actives List Price (Ctg.) (Pend) 12 mos. Sale Price SUPPLY SUPPLY Change Sale Price Change Broadview 155 64 $ 177,324 8 7 56 $ 109,564 10.82 15.62 -30.76% $ 171,300 -36.04% Brookfield 513 117 $ 271,959 18 5 115 $ 225,883 10.17 7.60 33.87% $ 262,464 -13.94% Buffalo Grove 89 159 $ 421,665 37 7 196 $ 353,821 7.95 8.90 -10.69% $ 406,391 -12.94% Burbank 454 197 $ 251,322 40 20 158 $ 186,445 10.84 19.22 -43.57% $ 231,573 -19.49% Burnham 633 17 $ 99,609 0 8 24 $ 45,417 6.38 16.36 -61.04% $ 100,105 -54.63% Burr Ridge 522 195 $ 1,349,298 18 4 69 $ 752,216 25.71 43.79 -41.28% $ 997,810 -24.61% Calumet City 409 277 $ 105,172 23 56 301 $ 65,512 8.75 13.39 -34.67% $ 98,646 -33.59% Calumet Park 643 31 $ 90,330 9 12 71 $ 50,204 4.04 10.29 -60.69% $ 135,740 -63.01% Carol Stream 188 127 $ 286,352 27 8 133 $ 239,411 9.07 11.03 -17.77% $ 278,889 -14.16% Carpentersville 110 280 $ 182,220 42 18 245 $ 132,218 11.02 10.47 5.25% $ 170,741 -22.56% Cary 13 208 $ 348,818 32 8 169 $ 250,526 11.94 10.78 10.83% $ 289,962 -13.60% Channahon 410 107 $ 289,323 15 7 86 $ 218,998 11.89 17.03 -30.20% $ 247,944 -11.67% Chicago Heights 411 213 $ 115,008 21 28 238 $ 56,605 8.91 16.05 -44.52% $ 99,217 -42.95% Chicago Ridge 415 29 $ 245,883 4 3 37 $ 181,288 7.91 10.72 -26.24% $ 215,498 -15.87% Cicero 650 214 $ 137,245 59 49 270 $ 96,495 6.79 21.58 -68.51% $ 167,747 -42.48% Clarendon Hills 514 94 $ 757,971 22 3 71 $ 577,595 11.75 16.66 -29.47% $ 690,483 -16.35% Country Club Hills 478 151 $ 158,958 33 33 187 $ 109,093 7.16 12.79 -43.99% $ 154,544 -29.41% Countryside 527 36 $ 424,025 5 0 16 $ 383,844 20.57 21.50 -4.32% $ 354,992 8.13% Crestwood 446 28 $ 238,132 5 2 34 $ 193,083 8.20 8.00 2.44% $ 218,596 -11.67% Crete 417 176 $ 269,737 26 13 124 $ 163,899 12.96 14.06 -7.87% $ 211,416 -22.48% Crystal Lake (& Lakewood) 14 518 $ 389,352 97 21 392 $ 260,146 12.19 15.94 -23.52% $ 306,539 -15.13% Darien 562 98 $ 409,948 13 1 97 $ 326,081 10.59 14.50 -26.91% $ 355,803 -8.35% Deerfield 15 161 $ 743,608 14 8 139 $ 542,121 12.00 16.68 -28.05% $ 698,915 -22.43% Des Plaines 16 345 $ 346,498 67 18 312 $ 252,085 10.43 18.13 -42.49% $ 309,638 -18.59% Dolton 419 245 $ 91,459 21 40 262 $ 52,396 9.10 11.03 -17.48% $ 96,551 -45.73% Downers Grove 515 365 $ 530,533 45 6 318 $ 396,285 11.87 13.02 -8.84% $ 458,595 -13.59% Elgin 123 859 $ 274,140 152 59 650 $ 180,972 11.97 16.55 -27.65% $ 224,969 -19.56% Elk Grove Village 7 142 $ 312,343 28 9 110 $ 286,706 11.59 11.84 -2.06% $ 319,400 -10.24% Elmhurst 126 311 $ 583,146 67 9 312 $ 429,523 9.62 10.67 -9.88% $ 510,524 -15.87% Elmwood Park 635 133 $ 302,746 37 23 116 $ 226,436 9.07 19.22 -52.82% $ 269,305 -15.92% Evanston 201 264 $ 677,599 41 20 299 $ 498,103 8.80 9.73 -9.53% $ 633,911 -21.42% Evergreen Park 642 140 $ 209,372 23 9 150 $ 175,813 9.23 14.90 -38.03% $ 204,482 -14.02% Flossmoor 422 147 $ 376,894 21 7 111 $ 231,249 12.69 19.93 -36.31% $ 321,973 -28.18% Forest Park 130 55 $ 305,581 8 3 48 $ 255,250 11.19 15.18 -26.33% $ 326,283 -21.77% Fox Lake 20 100 $ 315,945 14 3 48 $ 175,370 18.46 18.00 2.56% $ 240,477 -27.07% Fox River Grove 21 55 $ 289,813 4 1 25 $ 253,312 22.00 10.53 108.91% $ 291,325 -13.05% Data Source: MRED LLC Midwest Real Estate Data, LLC (C) Copyright 2009, A. L. Wagner Appraisal Group Page 2
  • 3. October 1, 2009 Statistics October 1, 2008 Statistics Under Under # of Sales 12 mo SP MLS Average Contract Contract Last Average MONTHS MONTHS Percent Average Percent Town Area Actives List Price (Ctg.) (Pend) 12 mos. Sale Price SUPPLY SUPPLY Change Sale Price Change Frankfort 423 298 $ 480,343 27 5 201 $ 345,194 15.35 14.34 7.06% $ 365,901 -5.66% Franklin Park 131 136 $ 209,911 38 18 99 $ 163,246 10.53 19.96 -47.26% $ 212,720 -23.26% Geneva 134 198 $ 455,649 49 4 251 $ 354,975 7.82 9.68 -19.25% $ 377,411 -5.94% Glen Ellyn 137 297 $ 635,668 60 2 232 $ 412,950 12.12 11.29 7.37% $ 507,913 -18.70% Glencoe 22 104 $ 1,903,174 18 8 90 $ 1,094,468 10.76 14.60 -26.33% $ 1,388,150 -21.16% Glendale Heights 139 135 $ 225,552 37 11 170 $ 166,431 7.43 17.51 -57.56% $ 220,173 -24.41% Glenview 25 447 $ 804,066 50 20 290 $ 573,527 14.90 16.12 -7.56% $ 777,723 -26.26% Glenwood 425 55 $ 145,743 14 14 75 $ 101,166 6.41 9.76 -34.33% $ 136,584 -25.93% Gurnee 31 257 $ 351,718 42 9 220 $ 288,301 11.38 11.96 -4.84% $ 335,226 -14.00% Hanover Park 103 136 $ 209,786 46 10 168 $ 173,815 7.29 10.90 -33.15% $ 217,793 -20.19% Harvey 426 185 $ 65,015 11 47 240 $ 20,910 7.45 14.20 -47.54% $ 53,426 -60.86% Harwood Heights 656 56 $ 358,438 4 3 37 $ 258,446 15.27 30.00 -49.09% $ 295,840 -12.64% Hazel Crest 429 121 $ 123,746 12 12 137 $ 66,906 9.02 11.63 -22.45% $ 113,632 -41.12% Hickory Hills 457 73 $ 277,332 10 4 43 $ 218,316 15.37 23.23 -33.85% $ 273,756 -20.25% Highland Park 35 375 $ 1,005,686 30 13 196 $ 618,647 18.83 14.61 28.85% $ 788,672 -21.56% Hillside 162 47 $ 212,534 10 9 45 $ 149,771 8.81 20.27 -56.52% $ 202,542 -26.05% Hinkley 520 25 $ 274,148 1 1 11 $ 190,182 23.08 14.73 56.70% $ 235,474 -19.23% Hinsdale 521 280 $ 1,368,971 34 11 205 $ 938,144 13.44 18.05 -25.55% $ 1,263,886 -25.77% Hoffman Estates 194 207 $ 370,568 34 13 227 $ 292,073 9.07 10.30 -11.95% $ 342,769 -14.79% Homer Glen 500 217 $ 518,603 24 9 107 $ 342,280 18.60 25.06 -25.77% $ 400,178 -14.47% Homewood 430 133 $ 186,573 27 13 172 $ 157,217 7.53 8.34 -9.77% $ 189,057 -16.84% Indian Head Park 531 16 $ 472,634 0 0 3 $ 725,500 64.00 27.43 133.33% $ 461,167 57.32% Inverness 7167 107 $ 1,002,971 5 0 39 $ 645,671 29.18 18.21 60.28% $ 727,810 -11.29% Itasca 143 72 $ 535,274 11 1 34 $ 337,221 18.78 22.09 -14.98% $ 425,869 -20.82% Joliet 499 713 $ 172,296 121 75 719 $ 135,890 9.35 11.09 -15.69% $ 165,377 -17.83% Justice 458 39 $ 272,750 8 7 27 $ 183,067 11.14 32.57 -65.79% $ 236,210 -22.50% Kenilworth 43 58 $ 2,127,672 1 3 20 $ 1,444,873 29.00 16.29 78.07% $ 1,961,687 -26.35% LaGrange Park 526 62 $ 402,562 7 3 96 $ 345,326 7.02 8.95 -21.55% $ 374,878 -7.88% LaGrange 525 118 $ 597,829 16 3 128 $ 455,757 9.63 12.60 -23.52% $ 567,969 -19.76% Lake Bluff 44 113 $ 1,345,604 10 3 55 $ 653,342 19.94 15.28 30.47% $ 676,338 -3.40% Lake Forest 45 347 $ 1,896,487 24 9 138 $ 1,181,319 24.35 22.33 9.05% $ 1,319,945 -10.50% Lake In The Hills 156 150 $ 294,129 54 9 214 $ 214,065 6.50 10.41 -37.59% $ 240,389 -10.95% Lake Villa & Lindenhurst 46 258 $ 298,285 36 13 240 $ 237,006 10.71 12.63 -15.18% $ 292,878 -19.08% Lansing 438 252 $ 157,729 30 22 202 $ 111,692 11.91 14.33 -16.92% $ 145,195 -23.07% Lemont 439 185 $ 551,271 25 8 111 $ 399,862 15.42 19.65 -21.52% $ 431,266 -7.28% Libertyville & Green Oaks 48 275 $ 703,547 34 9 191 $ 480,111 14.10 16.78 -15.95% $ 539,398 -10.99% Data Source: MRED LLC Midwest Real Estate Data, LLC (C) Copyright 2009, A. L. Wagner Appraisal Group Page 3
  • 4. October 1, 2009 Statistics October 1, 2008 Statistics Under Under # of Sales 12 mo SP MLS Average Contract Contract Last Average MONTHS MONTHS Percent Average Percent Town Area Actives List Price (Ctg.) (Pend) 12 mos. Sale Price SUPPLY SUPPLY Change Sale Price Change Lincolnshire 69 91 $ 867,011 11 3 48 $ 544,083 17.61 20.79 -15.26% $ 667,606 -18.50% Lincolnwood 645 116 $ 701,959 21 13 81 $ 422,857 12.10 22.20 -45.48% $ 572,778 -26.17% Lisle 532 117 $ 467,699 14 2 103 $ 347,196 11.80 9.79 20.55% $ 371,256 -6.48% Lockport 495 281 $ 281,896 36 15 172 $ 214,527 15.12 11.82 27.93% $ 242,275 -11.45% Lombard 148 224 $ 355,599 46 6 262 $ 266,967 8.56 11.09 -22.83% $ 307,809 -13.27% Lynwood 5411 75 $ 240,303 15 6 38 $ 184,957 15.25 16.60 -8.12% $ 236,714 -21.86% Lyons 534 58 $ 188,716 9 11 52 $ 131,383 9.67 15.33 -36.96% $ 189,447 -30.65% Markham 4426 111 $ 111,962 12 16 192 $ 44,472 6.05 14.25 -57.51% $ 85,350 -47.89% Matteson 443 155 $ 203,881 35 18 170 $ 171,624 8.34 11.20 -25.55% $ 207,718 -17.38% Maywood 153 129 $ 122,629 20 29 146 $ 65,427 7.94 15.88 -50.01% $ 128,576 -49.11% Medinah 157 33 $ 414,209 5 3 15 $ 395,327 17.22 46.91 -63.30% $ 336,700 17.41% Melrose Park 160 89 $ 214,151 16 15 81 $ 140,744 9.54 29.04 -67.16% $ 210,965 -33.29% McHenry 50 578 $ 325,941 85 19 346 $ 197,299 15.41 13.66 12.80% $ 220,023 -10.33% Minooka 447 115 $ 319,706 14 7 76 $ 201,011 14.23 17.87 -20.39% $ 231,977 -13.35% Midlothian 445 77 $ 189,543 15 10 91 $ 125,395 7.97 11.45 -30.46% $ 167,270 -25.03% Mokena 448 124 $ 472,584 21 5 101 $ 341,750 11.72 11.66 0.47% $ 373,821 -8.58% Monee 449 82 $ 386,025 10 5 102 $ 207,994 8.41 17.75 -52.62% $ 280,243 -25.78% Montgomery 538 166 $ 194,965 56 20 238 $ 183,108 6.34 10.42 -39.14% $ 206,103 -11.16% Morton Grove 53 153 $ 418,731 26 13 135 $ 307,562 10.55 14.79 -28.68% $ 389,285 -20.99% Mt. Prospect 56 234 $ 369,234 40 14 252 $ 315,282 9.18 12.63 -27.37% $ 365,913 -13.84% Mundelein 60 283 $ 359,392 45 17 213 $ 246,998 12.35 14.22 -13.13% $ 317,188 -22.13% Naperville 540 905 $ 668,504 167 28 1,025 $ 443,896 8.90 9.45 -5.77% $ 495,515 -10.42% New Lenox 451 213 $ 371,208 32 6 161 $ 302,451 12.84 10.43 23.14% $ 295,900 2.21% Niles 648 159 $ 405,558 29 12 123 $ 302,803 11.63 20.64 -43.64% $ 355,910 -14.92% Norridge 634 107 $ 419,818 20 14 86 $ 278,993 10.70 17.78 -39.83% $ 338,564 -17.60% North Aurora 542 130 $ 291,434 18 3 97 $ 263,516 13.22 11.45 15.45% $ 282,753 -6.80% North Chicago 64 78 $ 121,331 9 8 90 $ 56,569 8.75 15.20 -42.45% $ 87,887 -35.63% North Riverside 547 26 $ 254,210 1 0 43 $ 218,980 7.09 8.60 -17.58% $ 256,463 -14.62% Northbrook 62 306 $ 801,854 42 16 244 $ 603,991 12.16 13.44 -9.50% $ 673,082 -10.26% Northfield 7193 77 $ 904,305 2 5 35 $ 897,889 22.00 20.20 8.94% $ 982,165 -8.58% Northlake 164 73 $ 206,754 16 15 70 $ 138,187 8.67 16.25 -46.64% $ 200,660 -31.13% Oak Brook 523 121 $ 1,724,370 8 1 44 $ 1,318,124 27.40 25.50 7.44% $ 1,033,564 27.53% Oak Forest 452 129 $ 227,449 27 8 150 $ 181,798 8.37 10.99 -23.85% $ 210,359 -13.58% Oak Lawn 453 263 $ 263,178 40 16 270 $ 199,441 9.68 13.17 -26.51% $ 246,386 -19.05% Oak Park 302 185 $ 521,713 47 15 295 $ 422,827 6.22 8.20 -24.13% $ 487,186 -13.21% Olympia Fields 461 61 $ 310,770 16 2 54 $ 203,368 10.17 14.90 -31.78% $ 225,001 -9.61% Data Source: MRED LLC Midwest Real Estate Data, LLC (C) Copyright 2009, A. L. Wagner Appraisal Group Page 4
  • 5. October 1, 2009 Statistics October 1, 2008 Statistics Under Under # of Sales 12 mo SP MLS Average Contract Contract Last Average MONTHS MONTHS Percent Average Percent Town Area Actives List Price (Ctg.) (Pend) 12 mos. Sale Price SUPPLY SUPPLY Change Sale Price Change Orland Park 462 281 $ 520,007 43 10 274 $ 360,230 10.31 11.40 -9.53% $ 380,564 -5.34% Oswego 543 255 $ 342,297 52 15 288 $ 257,616 8.62 11.64 -25.95% $ 287,553 -10.41% Palatine 67 316 $ 474,662 36 7 280 $ 372,740 11.74 13.25 -11.43% $ 432,020 -13.72% Palos Heights 463 93 $ 459,816 8 4 61 $ 309,008 15.29 10.76 42.10% $ 357,495 -13.56% Palos Hills 465 49 $ 314,629 13 1 53 $ 238,969 8.78 11.45 -23.38% $ 274,622 -12.98% Palos Park 464 80 $ 757,367 9 1 42 $ 527,345 18.46 29.29 -36.98% $ 568,019 -7.16% Park Forest 466 190 $ 106,073 26 44 221 $ 64,890 7.84 13.54 -42.12% $ 99,386 -34.71% Park Ridge 68 330 $ 654,576 49 13 231 $ 473,406 13.52 16.49 -18.06% $ 521,972 -9.30% Peotone 468 64 $ 347,377 7 4 28 $ 230,267 19.69 20.00 -1.54% $ 235,924 -2.40% Plainfield 544 755 $ 309,492 153 45 839 $ 243,485 8.74 11.34 -22.92% $ 281,183 -13.41% Posen 469 45 $ 128,770 4 4 39 $ 93,682 11.49 14.40 -20.21% $ 137,436 -31.84% Prospect Heights 70 57 $ 524,561 8 2 45 $ 365,376 12.44 28.80 -56.82% $ 454,476 -19.61% Richton Park 471 94 $ 159,026 17 16 100 $ 116,679 8.48 13.98 -39.34% $ 168,703 -30.84% River Forest 305 82 $ 898,599 10 1 73 $ 793,904 11.71 10.81 8.32% $ 875,926 -9.36% River Grove 171 66 $ 224,371 12 8 44 $ 199,393 12.38 15.76 -21.50% $ 245,724 -18.85% Riverdale 627 88 $ 71,451 5 18 104 $ 38,291 8.31 13.08 -36.44% $ 78,910 -51.48% Riverside 546 87 $ 561,211 13 3 48 $ 412,564 16.31 16.30 0.09% $ 458,535 -10.03% Rolling Meadows 8 71 $ 319,131 16 5 102 $ 248,075 6.93 10.57 -34.46% $ 300,472 -17.44% Romeoville 494 223 $ 197,410 80 28 291 $ 158,923 6.71 12.91 -48.03% $ 194,652 -18.36% Roselle & Keeneyville 172 120 $ 387,360 21 8 99 $ 291,523 11.25 10.72 4.91% $ 336,825 -13.45% Round Lake 73 400 $ 177,907 90 35 437 $ 134,566 8.54 13.71 -37.72% $ 174,991 -23.10% Sauk Village 414 83 $ 101,501 8 19 134 $ 48,259 6.19 12.65 -51.08% $ 92,497 -47.83% Schaumburg 193 171 $ 425,439 42 11 212 $ 302,816 7.74 9.15 -15.38% $ 348,523 -13.11% Shorewood 496 140 $ 308,408 28 8 128 $ 259,192 10.24 13.12 -21.90% $ 274,031 -5.42% Skokie 76 268 $ 415,088 73 30 276 $ 303,852 8.49 13.61 -37.65% $ 358,432 -15.23% South Elgin 177 110 $ 343,406 21 7 118 $ 257,803 9.04 10.01 -9.69% $ 295,811 -12.85% South Holland 473 204 $ 166,710 25 42 232 $ 109,628 8.19 11.37 -27.97% $ 156,945 -30.15% St. Charles 174 545 $ 644,358 67 6 371 $ 401,602 14.73 13.79 6.80% $ 476,067 -15.64% Steger 475 82 $ 157,369 8 3 59 $ 92,736 14.06 8.67 62.07% $ 137,927 -32.76% Stickney 404 63 $ 220,263 13 13 61 $ 152,148 8.69 15.43 -43.68% $ 216,482 -29.72% Streamwood 107 213 $ 252,461 56 26 217 $ 182,883 8.55 13.22 -35.35% $ 237,581 -23.02% Sugar Grove 554 103 $ 393,410 17 1 68 $ 316,753 14.37 13.75 4.54% $ 364,823 -13.18% Summit 501 44 $ 173,615 5 4 27 $ 112,144 14.67 30.92 -52.57% $ 159,852 -29.84% Thornton 476 26 $ 125,481 2 0 18 $ 116,500 15.60 16.17 -3.55% $ 137,243 -15.11% Tinley Park 477 226 $ 320,046 39 4 198 $ 253,854 11.25 9.87 13.97% $ 280,926 -9.64% University Park 5466 55 $ 135,559 7 6 67 $ 72,722 8.25 15.05 -45.17% $ 139,495 -47.87% Data Source: MRED LLC Midwest Real Estate Data, LLC (C) Copyright 2009, A. L. Wagner Appraisal Group Page 5
  • 6. October 1, 2009 Statistics October 1, 2008 Statistics Under Under # of Sales 12 mo SP MLS Average Contract Contract Last Average MONTHS MONTHS Percent Average Percent Town Area Actives List Price (Ctg.) (Pend) 12 mos. Sale Price SUPPLY SUPPLY Change Sale Price Change Vernon Hills 61 121 $ 507,895 14 0 114 $ 435,921 11.34 10.18 11.46% $ 500,543 -12.91% Villa Park 186 133 $ 266,292 32 7 157 $ 207,579 8.14 12.30 -33.79% $ 257,509 -19.39% Warrenville 555 65 $ 393,629 13 4 64 $ 213,196 9.63 12.66 -23.92% $ 289,714 -26.41% Waukegan & Park City 85 411 $ 136,936 61 42 491 $ 88,714 8.30 13.22 -37.17% $ 135,606 -34.58% Wayne 184 49 $ 1,023,973 6 1 17 $ 536,853 24.50 51.00 -51.96% $ 531,111 1.08% West Chicago 185 239 $ 326,333 50 15 163 $ 208,646 12.58 18.32 -31.32% $ 280,638 -25.65% Westchester 154 159 $ 268,942 24 11 129 $ 225,559 11.63 16.09 -27.68% $ 270,408 -16.59% Western Springs 558 99 $ 729,652 14 1 90 $ 598,784 11.31 10.96 3.19% $ 655,376 -8.63% Westmont 559 114 $ 362,734 17 7 104 $ 356,208 10.69 12.86 -16.88% $ 353,384 0.80% Wheaton 187 388 $ 535,193 72 6 337 $ 398,017 11.22 10.03 11.90% $ 416,396 -4.41% Wheeling 90 126 $ 279,486 27 2 109 $ 222,159 10.96 18.20 -39.79% $ 271,602 -18.20% Willow Springs 480 39 $ 483,518 0 1 27 $ 405,259 16.71 17.29 -3.35% $ 373,119 8.61% Willowbrook 516 47 $ 841,545 7 0 39 $ 423,926 12.26 18.95 -35.29% $ 515,532 -17.77% Wilmette 91 203 $ 904,164 38 11 198 $ 799,746 9.86 9.71 1.54% $ 925,797 -13.62% Winfield 190 80 $ 475,221 8 1 61 $ 370,826 13.71 10.86 26.32% $ 357,243 3.80% Winnetka 93 215 $ 1,978,457 18 16 132 $ 1,449,169 15.54 13.42 15.85% $ 1,602,897 -9.59% Wood Dale 191 97 $ 361,242 19 6 63 $ 240,836 13.23 19.11 -30.77% $ 339,406 -29.04% Woodridge 517 128 $ 357,484 20 4 159 $ 268,907 8.39 10.34 -18.86% $ 315,273 -14.71% Woodstock & Greenwood 98 279 $ 424,723 39 5 153 $ 223,586 16.99 17.19 -1.16% $ 275,411 -18.82% Worth 482 51 $ 233,889 6 8 38 $ 179,890 11.77 14.93 -21.19% $ 229,773 -21.71% Yorkville 560 262 $ 371,736 36 6 195 $ 251,495 13.27 17.64 -24.78% $ 297,222 -15.38% Zion 99 240 $ 160,870 40 24 228 $ 99,660 9.86 12.18 -18.99% $ 124,537 -19.98% City of CHICAGO 8000 6,780 $ 390,533 1,071 1,034 7,434 $ 227,756 8.53 13.77 -38.04% $ 333,246 -31.66% : TOTALS (all areas in report) 8099 40,100 $ 437,600 6,622 3,348 37,402 $ 272,839 10.16 13.40 -24.17% $ 345,986 -21.14% ALL AREAS ALL 44,895 $ 430,160 7,279 3,591 40,772 $ 269,073 10.43 13.54 -22.95% $ 338,962 -20.62% (including areas not listed above) A balanced market typically has a 3.00 to 4.00 months supply. Less than that is undersupplied, more is oversupplied Average Sales Price changes may be exaggerated if significant amount of New Construction is reported in the MLS. Average Sales Price noted from previous year to current year should not be construed as Appreciation - it is percent of change of average sales price. Data Source: MRED LLC Midwest Real Estate Data, LLC (C) Copyright 2009, A. L. Wagner Appraisal Group Page 6