SlideShare a Scribd company logo
1 of 12
Presented by: Dave Jay S. Manriquez, RN.
CHAPTER II
PRESENTATION, ANALYSIS AND INTERPRETATION OF
DATA
The data gathered, scored, tabulated and statistically treated are presented and interpreted
in this chapter. The presentation and analysis of findings are discussed in the order presented in
the statement of the problem. Implications derived from the study are also presented in this
chapter. The results were based on the answers to the questionnaires distributed to the
respondents and interviews done from the different individual Koreans here in Cebu City.
Table 1
What brought you here in Cebu?
N = 100
RESPONSE FREQUENCY PERCENTAGE
EDUCATION
VACATION/TRAVEL
BUSINESS
FOR JOB OPPORTUNITIES
PARENTS
58
21
10
5
6
58%
21%
10%
5%
6%
TOTAL: N = 100 100%
Table 1 shows the reasons behind the growing population of Koreans here in Cebu City,
the reasons that brought them here in Cebu. The table is divided into 3 columns; the first column
refers to the responses of different Koreans answering the questionnaires. The second and third
column refers to the frequency and percentages, respectively.
Analysis
Each response is divided into the total number of respondents, 100, and is multiplied by
100 thereby garnering their percentage. Among the 100 Koreans, 58% of them went here in
Cebu City for education, 21% for vacation or travel, 10% for doing a business here in Cebu City,
6% because their parents was already here in Cebu and 5% went here in Cebu City for getting a
job.
Interpretation
The data implies that most of the respondents who come here in Cebu City are students
who will be studying English. We all knew the fact that studying English here in the Philippines
is much more cheaper compare to other countries that caters English education. Studying English
in other countries who caters English like Canada, Australia, and USA is more expensive
compare to our country. The growing population of Koreans here in Cebu City is not surprising
because in their country, the one who knows how to speak English are getting more job
opportunities. South Korean tourists often enroll in short term courses in English language to
cope with South Korea’s growing demand for English proficiency. Mostly Koreans under 20
years old arrive in the Philippines every month to study English. Some Koreans also are coming
here in Cebu City because the Department of Tourism introduces Cebu as a place of destination
for Koreans in the Philippines. Since our place has many tourists spot, it is easy to sell to
Koreans tourists because of our good beaches and resorts and hospitable people. Some Koreans
do business here in Cebu City since business opportunities are great. Market competition is
healthy and also the Philippine’s location and less expensive manpower makes it one of the best
destinations for Koreans business. Some of the respondents come here in Cebu to stay for good,
live and work here in Cebu since their parents was already here. Also some of them come in
Cebu City for job opportunities since lots of establishments are offering high payment jobs like
call centers.
Table 2
How do you find out about Cebu?
N = 100
RESPONSE FREQUENCY PERCENTAGE
RELATIVES, FRIENDS
MEDIA (tv, radio, print ads)
OTHERS (school, internet,
travel agency)
64
16
20
64%
16%
20%
TOTAL: N = 100 100%
Table 2 corresponds to table 1, on how did the Koreans find out about Cebu City. The
table is divided into 3 columns; the first column refers to the responses of different Koreans
answering the questionnaires. The second and third column refers to the frequency and
percentages, respectively.
Analysis
Each response is divided into the total number of respondents, 100, and is multiplied by
100 thereby garnering their percentage. Among the 100 Koreans, 64% knows about Cebu City
through their relatives and friends, 21% knows about Cebu City through school, Internet, and
travel agency, and 16% knows about Cebu City through the media.
Interpretation
The data implies that most of the Koreans knows about Cebu City because of their
friends and relatives who already visited here in Cebu. Starting 2004 there have been an
increased Korean population in Cebu City and most of them have told their relatives about Cebu
City about cheaper English education, nice places, good people, and cheaper cost of living. Some
of the respondents able to find out Cebu City through Media advertisement done by the
Department of Tourism, and other respondents know about Cebu City through school, internet
like the Korean language tourism website, and promotion done by Korean travel agency.
Table 3
Why did you choose Cebu City among other cities in the Philippines?
N = 100
RESPONSE FREQUENCY PERCENTAGE
SAFE
CHEAP
CATERS ENGLISH
FAMOUS
RECOMMENDED
FRINEDLY/NICE PLACE
13
26
9
22
14
16
13%
26%
9%
22%
14%
16%
TOTAL: N = 100 100%
Table 3 shows the reasons why did most of the Koreans choose Cebu City among other
cities in the Philippines as place of their destination. The table is divided into 3 columns; the first
column refers to the responses of different Koreans answering the questionnaires. The second
and third column refers to the frequency and percentages, respectively.
Analysis
Each response is divided into the total number of respondents, 100, and is multiplied by
100 thereby garnering their percentage. Among the 100 Koreans, 26% said that they choose
Cebu City among other cities in the Philippines because of the cheap price of our goods, 22%
said that Cebu City is famous in their country and it was well advertise by the Department of
Tourism as the place of destination for the Koreans, 16% said that they choose Cebu City
because of the warm friendly people and also there are lots of beautiful tourist spot that is found
in Cebu City, 14% said it was recommended by their friends and relatives as place of destination,
13% said that it is more safer for them to stay here in Cebu than other cities in the Philippines,
and 9% said that there are lot of schools who caters English education.
Interpretation
The data implies that most of the Korean respondents choose Cebu City among other
cities in the Philippines because of the cheaper cost of living, education, attractive tourist spots,
one of the safest cities in the Philippines and the positive attitude of the Cebuanos towards
Korean migrants.
Table 4
For how long have you been staying here in Cebu?
N = 100
RESPONSE FREQUENCY PERCENTAGE
1 MONTH OR LESS
2 MONTHS
3 MONTHS
6 MONTHS
1 YEAR
MORE THAN A YEAR
5
10
56
7
10
12
5%
10%
56%
7%
10%
12%
TOTAL: N = 100 100%
Table 4 shows the length of time most of the Koreans respondents stayed here in Cebu
City. The table is divided into 3 columns; the first column refers to the responses of different
Koreans answering the questionnaires. The second and third column refers to the frequency and
percentages, respectively.
Analysis
Each response is divided into the total number of respondents, 100, and is multiplied by
100 thereby garnering their percentage. Among the 100 Koreans, 56% of them stay here for 3
months already here in Cebu City, 12% of them stay here for more than a year, 10% of them stay
here for 1 year, 10% of them stay here for 2 months, 7% of them stay here for 6 months, and 5%
of them stay here in Cebu City for only 1 month or less.
Interpretation
The data shows that most of the respondents stay in Cebu City for three months and only
5% stays for one month or less. This implies that most of the respondents take three months
crash courses in conversational or business English or other courses in Cebu City, attracted by
the affordable tuition and even cheaper cost of living.
Table 5
Where are you staying?
N = 100
RESPONSE FREQUENCY PERCENTAGE
HOTEL
PENSION HOUSE
APARTMENT
BOARDING HOUSE
DORMITORY
HOUSE
30
12
8
8
34
8
30%
12%
8%
8%
34%
8%
TOTAL: N = 100 100%
Table 5 shows where did most of the Koreans respondents are staying while they are here
in Cebu City. The table is divided into 3 columns; the first column refers to the responses of
different Koreans answering the questionnaires. The second and third column refers to the
frequency and percentages, respectively.
Analysis
Each response is divided into the total number of respondents, 100, and is multiplied by
100 thereby garnering their percentage. Among the 100 Koreans, 34% of them are staying in a
dormitory, 30% of them are staying in a hotel, 12% of them are staying in a pension house, and
8% of them are staying in an apartment, boarding house, and owned house while they are staying
here in Cebu City.
Interpretation
The data implies that most of the Korean respondents are students, and they usually stay
in a dormitory for it is cheaper, and usually they stay in a dormitory that is located near the
school for easy travel and accessible. Some of Korean respondents are tourists having their
vacation/travel here in Cebu and mostly of them stay in a Hotel and Pension House since most of
the Korean tourists can afford luxurious establishment. Commonly, some of the Korean
respondents stay in apartments, boarding houses, and owned house.
Table 6
How much are you paying for lodging?
N = 100
RESPONSE FREQUENCY PERCENTAGE
Less than 1,000/day
1,000 – 2,000/day
2,000 or more/day
Not sure
38
32
12
10
41%
35%
13%
11%
TOTAL: N = 92 100%
Table 6 corresponds to table 5 that refers to the amount they are expending for their
lodging per day. The table is divided into 3 columns; the first column refers to the responses of
different Koreans answering the questionnaires. The second and third column refers to the
frequency and percentages, respectively.
Analysis
Each response is divided into the total number of respondents, 92, and is multiplied by
100 thereby garnering their percentage. Among the 92 Koreans who pay for their lodging, 38%
pay less than P1, 000 per day, 32% pay P1, 000-2,000 per day, 12% pay P2, 000 or more per
day, 10% are not sure for how much they expend for their lodging.
Interpretation
The data implies that most of the respondents are paying less than 1,000 per day for lodging
due to the cheaper cost of living in Cebu City.
Table 7
How many visits have you made here in Cebu?
N = 100
RESPONSE FREQUENCY PERCENTAGE
1 TIME
2 TIMES
3 TIMES
4 TIMES
5 TIMES
MORE THAN 5 TIMES
75
25
0
0
0
0
75%
25%
0%
0%
0%
0%
TOTAL: N = 100 100%
Table 7 shows how many times they have already visited Cebu City. The table is divided
into 3 columns; the first column refers to the responses of different Koreans answering the
questionnaires. The second and third column refers to the frequency and percentages,
respectively.
Analysis
Each response is divided into the total number of respondents, 100, and is multiplied by
100 thereby garnering their percentage. Among the 100 Koreans, 75% of them have visit Cebu
City for the first time, and 25% of them have visited Cebu City for the second time.
Interpretation
The data implies that most of the Korean respondents have visited Cebu for the first time
and the rest of the respondents have visited Cebu for the second time. This implies that most of
the respondents came here for vacation, to explore Cebu City, and learn English language. For
those respondents who visited Cebu City for the second time, are interested to learn English,
liked the cebuanos’ hospitality, attractive tourist spots, and engaged in business.
Table 8
State the reasons that made you come back here in Cebu?
N = 100
RESPONSE FREQUENCY PERCENTAGE
BUSINESS
STUDY ENGLISH
GOOD PLACE/PEOPLE
5
10
10
20%
40%
40%
TOTAL: N = 25 100%
Table 8 corresponds to table 7, on what are their reasons why they come back here in
Cebu City. The table is divided into 3 columns; the first column refers to the responses of
different Koreans answering the questionnaires. The second and third column refers to the
frequency and percentages, respectively.
Analysis
Each response is divided into the total number of respondents, 25, and is multiplied by
100 thereby garnering their percentage. Among the 25 Koreans who have their visit for the
second time in Cebu City, 10% of them come back in Cebu City for studying English, 10% of
them said that Cebu City is a nice place and the people are very warm and friendly also
hospitable, and 5% of them said that they come back here to do business.
Interpretation
The data implies that more Koreans come to Cebu to study English because the cost of
English education is less expensive and so is the cost of living. Cebu City is also advertised by
the Department of Tourism as one of the best tourist destination due to its beaches and hospitable
locals. Lastly, Koreans come to Cebu for business because the cost of manpower is less
expensive.
Table 9
What do you like most about Cebu?
N = 100
RESPONSE FREQUENCY PERCENTAGE
FOOD
CULTURE
PRICE
PEOPLE
PLACES
19
16
10
28
27
19%
16%
10%
28%
27%
TOTAL: N = 100 100%
Table 9 shows the things that most Koreans like about Cebu City. The table is divided
into 3 columns; the first column refers to the responses of different Koreans answering the
questionnaires. The second and third column refers to the frequency and percentages,
respectively.
Analysis
Each response is divided into the total number of respondents, 100, and is multiplied by
100 thereby garnering their percentage. Among the 100 Koreans, 28% of them said that the
things they like most about Cebu City is their people on the way they treat them, their being
warm and friendly to the Koreans. 24% of them said it was the place that they like most about
Cebu City; there are lots of tourist’s spot and good beaches. 19% of them said it was the food
that is being served to them, 16% of them said that it was our unique culture, and 10% of them
said that the price of our goods is much more cheaper compare to other places.
Interpretation
The data implies that 28% of the Korean respondents says that they like the people of
Cebu City most because of the Cebuanos positive response to Korean migrants and hospitality.
Aside from the people, Korean respondents also prefers the places found in Cebu City like the
common tourist destinations like beaches, Korean’s churches and shopping center, which offers
variety of cheaper and fashionable items. The Korean respondents also like the food in Cebu
because there are many Korean restaurants having prominent Korean language signs and few
offer any English explanation. The respondents also like the unique culture of the Cebuanos.
Table 10
Do you feel safe staying here in Cebu?
N = 100
RESPONSE FREQUENCY PERCENTAGE
YES
NO
70
30
70%
30%
TOTAL: N = 100 100%
Table 10 shows their feelings about their safety while they are staying here in Cebu City.
The table is divided into 3 columns; the first column refers to the responses of different Koreans
answering the questionnaires, the first column is answerable by yes or no. The second and third
column refers to the frequency and percentages, respectively.
Analysis
Each response is divided into the total number of respondents, 100, and is multiplied by
100 thereby garnering their percentage. Among the 100 Koreans, 70% of them said that they are
safe in Cebu City compared to other cities in the Philippines, and only 30% of them said that
they are not safe in Cebu City.
Interpretation
The data implies that most of the respondents feels safe about coming to Cebu City
because it is one of the cities with low crime rates. Since 2006, the Philippine National Police
statistics show a consistent drop in crime rates in the Philippines, particularly in Cebu City. This
attracts tourist and foreign investors to come to Cebu City.
Table 11
What bad experiences have you encountered while staying in Cebu?
N = 100
RESPONSE FREQUENCY PERCENTAGE
NOT YET
ABUSIVE DRIVER
TRAFFIC
LOST ITEMS
58
26
6
10
58%
26%
6%
10%
TOTAL: N = 100 100%
Table 11 shows the bad experiences most of the respondents encountered while staying
here in Cebu City. The table is divided into 3 columns; the first column refers to the responses of
different Koreans answering the questionnaires. The second and third column refers to the
frequency and percentages, respectively.
Analysis
Each response is divided into the total number of respondents, 100, and is multiplied by
100 thereby garnering their percentage. Among the 100 Koreans, 58% of them said that they
have not yet encountered bad experiences while they are staying here in Cebu City, 26% of them
said that they are being abuse by our drivers regarding the payment for our public transportation
and taxi fares, 10% of them said that their bad experiences while staying here in Cebu City is lost
of valuable items, and 6% of them said that they have already experience heavy traffic.
Interpretation
The data implies that most Korean visitors have not yet encountered bad experiences
during stay in Cebu City. They treated Cebu as one of the safest city across the region. While
some other Korean visitors have encountered minimal problem on some abusive drivers. This
problem poses more danger in life that could lead accident resulted to sudden death. Unattended
personal belongings resulting to stealing is not a threat on most Korean respondents. Some of the
Korean respondents have experience less problem regarding to traffic situation in Cebu City.
Table 12
If given the chance, would you like to stay here for good?
N = 100
RESPONSE FREQUNECY PERCENTAGE
YES
NO
49
51
49%
51%
TOTAL: N = 100 100%
Table 12 shows the respondents responses whether they like to stay in Cebu City for
good if they will be given the chance to stay. The table is divided into 3 columns; the first
column refers to the responses of different Koreans answering the questionnaires the, first
column is answerable by yes or no. The second and third column refers to the frequency and
percentages, respectively.
Analysis
Each response is divided into the total number of respondents, 100, and is multiplied by
100 thereby garnering their percentage. Among the 100 Koreans, 49% of them said that they
would like to stay in Cebu City for good if they will be given the chance, and 51% of them said
that that they will be returning home.
Interpretation
The data implies that a greater number of respondents prefers to return to Korea to work
and apply what they have learned in the Philippines while a few number of respondents say’s
that they prefer to do business in Cebu City and further study.
Table 13
Are you going to recommend Cebu as a choice of Destination to others?
N = 100
RESPONSE FREQUENCY PERCENTAGE
YES
NO
87
13
87%
13%
TOTAL: N = 100 100%
Table 13 shows the respondents responses if they will be going to recommend Cebu City
as a place of destination to other Koreans in their country. The table is divided into 3 columns;
the first column refers to the responses of different Koreans answering the questionnaires the,
first column is answerable by yes or no. The second and third column refers to the frequency and
percentages, respectively.
Analysis
Each response is divided into the total number of respondents, 100, and is multiplied by
100 thereby garnering their percentage. Among the 100 Koreans, 87% of them said that they are
going to recommend Cebu City as a place of destination of Koreans in the Philippines to others,
and 13% of them said they would not.
Interpretation
The data implies that most of the Korean respondents says that they will recommend
Cebu City as a choice of destination because of the cheaper cost of living, affordable cost of
education and attractive tourist spots. A few of the respondents don’t recommend Cebu City as a
place of destination because of the negative experience they have.
Treatment of Data:
The results of the questionnaires distributed were sorted out, tallied and tabulated. The
questionnaires are answerable by checking the options that the respondents feel appropriate.
Some questions are also answerable by yes or no. In each table, options were arranged to the
number of respondents by which it is represented as N. The percentage was computed with the
formula: % = f/N x 100.
Where:
f = the number of options checked by a respondents
N = the total number of respondents
The percentage was used in statistical treatment, the percentages were taken by dividing
the number of options checked by the total number of respondents, and then the quotient was
multiplied by one hundred.

More Related Content

Similar to Thesis Ncm 105, the reason behind the growing population of Koreans here in the Philippines

TACLOBAN-CITY-DIVISION-POPQUIZ-2023.pptx
TACLOBAN-CITY-DIVISION-POPQUIZ-2023.pptxTACLOBAN-CITY-DIVISION-POPQUIZ-2023.pptx
TACLOBAN-CITY-DIVISION-POPQUIZ-2023.pptxKathlynVillar
 
University Of San Francisco Essay. PDF San Francisco Declaration on Research ...
University Of San Francisco Essay. PDF San Francisco Declaration on Research ...University Of San Francisco Essay. PDF San Francisco Declaration on Research ...
University Of San Francisco Essay. PDF San Francisco Declaration on Research ...Brandy Johnson
 
Genre analysis and cultural variation
Genre analysis and cultural variationGenre analysis and cultural variation
Genre analysis and cultural variationbikashtaly
 
New York City Public School Demographics
New York City Public School DemographicsNew York City Public School Demographics
New York City Public School DemographicsLuis Taveras EMBA, MS
 
Demo presentation.pptx
Demo presentation.pptxDemo presentation.pptx
Demo presentation.pptxEkmarSakib
 
Verbal expressions in giving and receiving presents in English and Vietnamese...
Verbal expressions in giving and receiving presents in English and Vietnamese...Verbal expressions in giving and receiving presents in English and Vietnamese...
Verbal expressions in giving and receiving presents in English and Vietnamese...HanaTiti
 
Week 9 writing discussion
Week 9 writing discussionWeek 9 writing discussion
Week 9 writing discussionHafizul Mukhlis
 
차트 디스커션 수업 교재(Chart Discussion)
차트 디스커션 수업 교재(Chart Discussion) 차트 디스커션 수업 교재(Chart Discussion)
차트 디스커션 수업 교재(Chart Discussion) inoEnglish
 
Chart Discussion
Chart Discussion Chart Discussion
Chart Discussion inoEnglish
 
Korea be there presentation copy
Korea be there presentation copyKorea be there presentation copy
Korea be there presentation copybollendorf
 
Bbbe paper 2(form 4) with answer
Bbbe paper 2(form 4) with answerBbbe paper 2(form 4) with answer
Bbbe paper 2(form 4) with answerJamuna Mogan
 
Evaluation of the Impact of Presence of Knowledge Channel on Students Perception
Evaluation of the Impact of Presence of Knowledge Channel on Students PerceptionEvaluation of the Impact of Presence of Knowledge Channel on Students Perception
Evaluation of the Impact of Presence of Knowledge Channel on Students PerceptionKnowledgeChannel5
 
Buy Basildon Bond Air Mail Writing Paper Envelopes Jespers Of Harr
Buy Basildon Bond Air Mail Writing Paper Envelopes Jespers Of HarrBuy Basildon Bond Air Mail Writing Paper Envelopes Jespers Of Harr
Buy Basildon Bond Air Mail Writing Paper Envelopes Jespers Of HarrJulie Morales
 
Briefing Book: English to Speakers of Other Languages (ESOL) Programs in Boston
Briefing Book: English to Speakers of Other Languages (ESOL) Programs in BostonBriefing Book: English to Speakers of Other Languages (ESOL) Programs in Boston
Briefing Book: English to Speakers of Other Languages (ESOL) Programs in BostonInstituto Diáspora Brasil (IDB)
 
presentation fair.pptx
presentation fair.pptxpresentation fair.pptx
presentation fair.pptxJoshua Pang
 

Similar to Thesis Ncm 105, the reason behind the growing population of Koreans here in the Philippines (20)

TACLOBAN-CITY-DIVISION-POPQUIZ-2023.pptx
TACLOBAN-CITY-DIVISION-POPQUIZ-2023.pptxTACLOBAN-CITY-DIVISION-POPQUIZ-2023.pptx
TACLOBAN-CITY-DIVISION-POPQUIZ-2023.pptx
 
Temerity of Hope
Temerity of HopeTemerity of Hope
Temerity of Hope
 
University Of San Francisco Essay. PDF San Francisco Declaration on Research ...
University Of San Francisco Essay. PDF San Francisco Declaration on Research ...University Of San Francisco Essay. PDF San Francisco Declaration on Research ...
University Of San Francisco Essay. PDF San Francisco Declaration on Research ...
 
Genre analysis and cultural variation
Genre analysis and cultural variationGenre analysis and cultural variation
Genre analysis and cultural variation
 
New York City Public School Demographics
New York City Public School DemographicsNew York City Public School Demographics
New York City Public School Demographics
 
Demo presentation.pptx
Demo presentation.pptxDemo presentation.pptx
Demo presentation.pptx
 
Verbal expressions in giving and receiving presents in English and Vietnamese...
Verbal expressions in giving and receiving presents in English and Vietnamese...Verbal expressions in giving and receiving presents in English and Vietnamese...
Verbal expressions in giving and receiving presents in English and Vietnamese...
 
Week 9 writing discussion
Week 9 writing discussionWeek 9 writing discussion
Week 9 writing discussion
 
차트 디스커션 수업 교재(Chart Discussion)
차트 디스커션 수업 교재(Chart Discussion) 차트 디스커션 수업 교재(Chart Discussion)
차트 디스커션 수업 교재(Chart Discussion)
 
Chart Discussion
Chart Discussion Chart Discussion
Chart Discussion
 
Korea be there presentation copy
Korea be there presentation copyKorea be there presentation copy
Korea be there presentation copy
 
Graphic Essay.pdf
Graphic Essay.pdfGraphic Essay.pdf
Graphic Essay.pdf
 
Graphic Essay
Graphic EssayGraphic Essay
Graphic Essay
 
CHAPTER-IV.pptx
CHAPTER-IV.pptxCHAPTER-IV.pptx
CHAPTER-IV.pptx
 
Bbbe paper 2(form 4) with answer
Bbbe paper 2(form 4) with answerBbbe paper 2(form 4) with answer
Bbbe paper 2(form 4) with answer
 
Evaluation of the Impact of Presence of Knowledge Channel on Students Perception
Evaluation of the Impact of Presence of Knowledge Channel on Students PerceptionEvaluation of the Impact of Presence of Knowledge Channel on Students Perception
Evaluation of the Impact of Presence of Knowledge Channel on Students Perception
 
Buy Basildon Bond Air Mail Writing Paper Envelopes Jespers Of Harr
Buy Basildon Bond Air Mail Writing Paper Envelopes Jespers Of HarrBuy Basildon Bond Air Mail Writing Paper Envelopes Jespers Of Harr
Buy Basildon Bond Air Mail Writing Paper Envelopes Jespers Of Harr
 
Briefing Book: English to Speakers of Other Languages (ESOL) Programs in Boston
Briefing Book: English to Speakers of Other Languages (ESOL) Programs in BostonBriefing Book: English to Speakers of Other Languages (ESOL) Programs in Boston
Briefing Book: English to Speakers of Other Languages (ESOL) Programs in Boston
 
Njhs Essay Help
Njhs Essay HelpNjhs Essay Help
Njhs Essay Help
 
presentation fair.pptx
presentation fair.pptxpresentation fair.pptx
presentation fair.pptx
 

More from Jack Frost

Preceptorship meds
Preceptorship medsPreceptorship meds
Preceptorship medsJack Frost
 
Research for queens park common cases
Research for queens park common casesResearch for queens park common cases
Research for queens park common casesJack Frost
 
Diagnosis and medications research
Diagnosis and medications researchDiagnosis and medications research
Diagnosis and medications researchJack Frost
 
Jeopardy Game
Jeopardy Game Jeopardy Game
Jeopardy Game Jack Frost
 
Jeopardy 2016 - Handout
Jeopardy 2016 - HandoutJeopardy 2016 - Handout
Jeopardy 2016 - HandoutJack Frost
 
Cheat sheet - Plan of Care
Cheat sheet - Plan of CareCheat sheet - Plan of Care
Cheat sheet - Plan of CareJack Frost
 
Professional communication 4 simulation
Professional communication 4   simulationProfessional communication 4   simulation
Professional communication 4 simulationJack Frost
 
L 4 sims prep student 2016
L 4 sims prep student 2016L 4 sims prep student 2016
L 4 sims prep student 2016Jack Frost
 
Weekly reflections 2 and 3
Weekly reflections 2 and 3Weekly reflections 2 and 3
Weekly reflections 2 and 3Jack Frost
 
Horizontal violence prof comm4
Horizontal violence prof comm4Horizontal violence prof comm4
Horizontal violence prof comm4Jack Frost
 
Ethical dilemma class presentation
Ethical dilemma   class presentationEthical dilemma   class presentation
Ethical dilemma class presentationJack Frost
 
Teaching narcan injection
Teaching narcan injectionTeaching narcan injection
Teaching narcan injectionJack Frost
 
Journal (Week 3) CPE 3
Journal (Week 3) CPE 3Journal (Week 3) CPE 3
Journal (Week 3) CPE 3Jack Frost
 
Professional communication 3
Professional communication 3Professional communication 3
Professional communication 3Jack Frost
 
Professional Communication 3 sample case study
Professional Communication 3 sample case studyProfessional Communication 3 sample case study
Professional Communication 3 sample case studyJack Frost
 
Template for self assessment - Professional Communication 3
Template for self assessment - Professional Communication 3Template for self assessment - Professional Communication 3
Template for self assessment - Professional Communication 3Jack Frost
 
INP drama case scenario - Mental Disorder
INP drama case scenario - Mental DisorderINP drama case scenario - Mental Disorder
INP drama case scenario - Mental DisorderJack Frost
 

More from Jack Frost (20)

Preceptorship meds
Preceptorship medsPreceptorship meds
Preceptorship meds
 
Plan of care
Plan of carePlan of care
Plan of care
 
Research for queens park common cases
Research for queens park common casesResearch for queens park common cases
Research for queens park common cases
 
Diagnosis and medications research
Diagnosis and medications researchDiagnosis and medications research
Diagnosis and medications research
 
Plan of care
Plan of carePlan of care
Plan of care
 
Jeopardy Game
Jeopardy Game Jeopardy Game
Jeopardy Game
 
Jeopardy 2016 - Handout
Jeopardy 2016 - HandoutJeopardy 2016 - Handout
Jeopardy 2016 - Handout
 
Cheat sheet - Plan of Care
Cheat sheet - Plan of CareCheat sheet - Plan of Care
Cheat sheet - Plan of Care
 
Professional communication 4 simulation
Professional communication 4   simulationProfessional communication 4   simulation
Professional communication 4 simulation
 
L 4 sims prep student 2016
L 4 sims prep student 2016L 4 sims prep student 2016
L 4 sims prep student 2016
 
Weekly reflections 2 and 3
Weekly reflections 2 and 3Weekly reflections 2 and 3
Weekly reflections 2 and 3
 
Horizontal violence prof comm4
Horizontal violence prof comm4Horizontal violence prof comm4
Horizontal violence prof comm4
 
Ethical dilemma class presentation
Ethical dilemma   class presentationEthical dilemma   class presentation
Ethical dilemma class presentation
 
Teaching narcan injection
Teaching narcan injectionTeaching narcan injection
Teaching narcan injection
 
Journal (Week 3) CPE 3
Journal (Week 3) CPE 3Journal (Week 3) CPE 3
Journal (Week 3) CPE 3
 
Professional communication 3
Professional communication 3Professional communication 3
Professional communication 3
 
Professional Communication 3 sample case study
Professional Communication 3 sample case studyProfessional Communication 3 sample case study
Professional Communication 3 sample case study
 
Template for self assessment - Professional Communication 3
Template for self assessment - Professional Communication 3Template for self assessment - Professional Communication 3
Template for self assessment - Professional Communication 3
 
INP drama case scenario - Mental Disorder
INP drama case scenario - Mental DisorderINP drama case scenario - Mental Disorder
INP drama case scenario - Mental Disorder
 
Goals
GoalsGoals
Goals
 

Recently uploaded

Influencing policy (training slides from Fast Track Impact)
Influencing policy (training slides from Fast Track Impact)Influencing policy (training slides from Fast Track Impact)
Influencing policy (training slides from Fast Track Impact)Mark Reed
 
Difference Between Search & Browse Methods in Odoo 17
Difference Between Search & Browse Methods in Odoo 17Difference Between Search & Browse Methods in Odoo 17
Difference Between Search & Browse Methods in Odoo 17Celine George
 
4.18.24 Movement Legacies, Reflection, and Review.pptx
4.18.24 Movement Legacies, Reflection, and Review.pptx4.18.24 Movement Legacies, Reflection, and Review.pptx
4.18.24 Movement Legacies, Reflection, and Review.pptxmary850239
 
Earth Day Presentation wow hello nice great
Earth Day Presentation wow hello nice greatEarth Day Presentation wow hello nice great
Earth Day Presentation wow hello nice greatYousafMalik24
 
Keynote by Prof. Wurzer at Nordex about IP-design
Keynote by Prof. Wurzer at Nordex about IP-designKeynote by Prof. Wurzer at Nordex about IP-design
Keynote by Prof. Wurzer at Nordex about IP-designMIPLM
 
HỌC TỐT TIẾNG ANH 11 THEO CHƯƠNG TRÌNH GLOBAL SUCCESS ĐÁP ÁN CHI TIẾT - CẢ NĂ...
HỌC TỐT TIẾNG ANH 11 THEO CHƯƠNG TRÌNH GLOBAL SUCCESS ĐÁP ÁN CHI TIẾT - CẢ NĂ...HỌC TỐT TIẾNG ANH 11 THEO CHƯƠNG TRÌNH GLOBAL SUCCESS ĐÁP ÁN CHI TIẾT - CẢ NĂ...
HỌC TỐT TIẾNG ANH 11 THEO CHƯƠNG TRÌNH GLOBAL SUCCESS ĐÁP ÁN CHI TIẾT - CẢ NĂ...Nguyen Thanh Tu Collection
 
Visit to a blind student's school🧑‍🦯🧑‍🦯(community medicine)
Visit to a blind student's school🧑‍🦯🧑‍🦯(community medicine)Visit to a blind student's school🧑‍🦯🧑‍🦯(community medicine)
Visit to a blind student's school🧑‍🦯🧑‍🦯(community medicine)lakshayb543
 
ISYU TUNGKOL SA SEKSWLADIDA (ISSUE ABOUT SEXUALITY
ISYU TUNGKOL SA SEKSWLADIDA (ISSUE ABOUT SEXUALITYISYU TUNGKOL SA SEKSWLADIDA (ISSUE ABOUT SEXUALITY
ISYU TUNGKOL SA SEKSWLADIDA (ISSUE ABOUT SEXUALITYKayeClaireEstoconing
 
MULTIDISCIPLINRY NATURE OF THE ENVIRONMENTAL STUDIES.pptx
MULTIDISCIPLINRY NATURE OF THE ENVIRONMENTAL STUDIES.pptxMULTIDISCIPLINRY NATURE OF THE ENVIRONMENTAL STUDIES.pptx
MULTIDISCIPLINRY NATURE OF THE ENVIRONMENTAL STUDIES.pptxAnupkumar Sharma
 
ACC 2024 Chronicles. Cardiology. Exam.pdf
ACC 2024 Chronicles. Cardiology. Exam.pdfACC 2024 Chronicles. Cardiology. Exam.pdf
ACC 2024 Chronicles. Cardiology. Exam.pdfSpandanaRallapalli
 
AMERICAN LANGUAGE HUB_Level2_Student'sBook_Answerkey.pdf
AMERICAN LANGUAGE HUB_Level2_Student'sBook_Answerkey.pdfAMERICAN LANGUAGE HUB_Level2_Student'sBook_Answerkey.pdf
AMERICAN LANGUAGE HUB_Level2_Student'sBook_Answerkey.pdfphamnguyenenglishnb
 
ECONOMIC CONTEXT - PAPER 1 Q3: NEWSPAPERS.pptx
ECONOMIC CONTEXT - PAPER 1 Q3: NEWSPAPERS.pptxECONOMIC CONTEXT - PAPER 1 Q3: NEWSPAPERS.pptx
ECONOMIC CONTEXT - PAPER 1 Q3: NEWSPAPERS.pptxiammrhaywood
 
How to Add Barcode on PDF Report in Odoo 17
How to Add Barcode on PDF Report in Odoo 17How to Add Barcode on PDF Report in Odoo 17
How to Add Barcode on PDF Report in Odoo 17Celine George
 
Judging the Relevance and worth of ideas part 2.pptx
Judging the Relevance  and worth of ideas part 2.pptxJudging the Relevance  and worth of ideas part 2.pptx
Judging the Relevance and worth of ideas part 2.pptxSherlyMaeNeri
 
FILIPINO PSYCHology sikolohiyang pilipino
FILIPINO PSYCHology sikolohiyang pilipinoFILIPINO PSYCHology sikolohiyang pilipino
FILIPINO PSYCHology sikolohiyang pilipinojohnmickonozaleda
 
Inclusivity Essentials_ Creating Accessible Websites for Nonprofits .pdf
Inclusivity Essentials_ Creating Accessible Websites for Nonprofits .pdfInclusivity Essentials_ Creating Accessible Websites for Nonprofits .pdf
Inclusivity Essentials_ Creating Accessible Websites for Nonprofits .pdfTechSoup
 
Barangay Council for the Protection of Children (BCPC) Orientation.pptx
Barangay Council for the Protection of Children (BCPC) Orientation.pptxBarangay Council for the Protection of Children (BCPC) Orientation.pptx
Barangay Council for the Protection of Children (BCPC) Orientation.pptxCarlos105
 

Recently uploaded (20)

Influencing policy (training slides from Fast Track Impact)
Influencing policy (training slides from Fast Track Impact)Influencing policy (training slides from Fast Track Impact)
Influencing policy (training slides from Fast Track Impact)
 
Difference Between Search & Browse Methods in Odoo 17
Difference Between Search & Browse Methods in Odoo 17Difference Between Search & Browse Methods in Odoo 17
Difference Between Search & Browse Methods in Odoo 17
 
4.18.24 Movement Legacies, Reflection, and Review.pptx
4.18.24 Movement Legacies, Reflection, and Review.pptx4.18.24 Movement Legacies, Reflection, and Review.pptx
4.18.24 Movement Legacies, Reflection, and Review.pptx
 
FINALS_OF_LEFT_ON_C'N_EL_DORADO_2024.pptx
FINALS_OF_LEFT_ON_C'N_EL_DORADO_2024.pptxFINALS_OF_LEFT_ON_C'N_EL_DORADO_2024.pptx
FINALS_OF_LEFT_ON_C'N_EL_DORADO_2024.pptx
 
Earth Day Presentation wow hello nice great
Earth Day Presentation wow hello nice greatEarth Day Presentation wow hello nice great
Earth Day Presentation wow hello nice great
 
LEFT_ON_C'N_ PRELIMS_EL_DORADO_2024.pptx
LEFT_ON_C'N_ PRELIMS_EL_DORADO_2024.pptxLEFT_ON_C'N_ PRELIMS_EL_DORADO_2024.pptx
LEFT_ON_C'N_ PRELIMS_EL_DORADO_2024.pptx
 
Keynote by Prof. Wurzer at Nordex about IP-design
Keynote by Prof. Wurzer at Nordex about IP-designKeynote by Prof. Wurzer at Nordex about IP-design
Keynote by Prof. Wurzer at Nordex about IP-design
 
HỌC TỐT TIẾNG ANH 11 THEO CHƯƠNG TRÌNH GLOBAL SUCCESS ĐÁP ÁN CHI TIẾT - CẢ NĂ...
HỌC TỐT TIẾNG ANH 11 THEO CHƯƠNG TRÌNH GLOBAL SUCCESS ĐÁP ÁN CHI TIẾT - CẢ NĂ...HỌC TỐT TIẾNG ANH 11 THEO CHƯƠNG TRÌNH GLOBAL SUCCESS ĐÁP ÁN CHI TIẾT - CẢ NĂ...
HỌC TỐT TIẾNG ANH 11 THEO CHƯƠNG TRÌNH GLOBAL SUCCESS ĐÁP ÁN CHI TIẾT - CẢ NĂ...
 
Visit to a blind student's school🧑‍🦯🧑‍🦯(community medicine)
Visit to a blind student's school🧑‍🦯🧑‍🦯(community medicine)Visit to a blind student's school🧑‍🦯🧑‍🦯(community medicine)
Visit to a blind student's school🧑‍🦯🧑‍🦯(community medicine)
 
ISYU TUNGKOL SA SEKSWLADIDA (ISSUE ABOUT SEXUALITY
ISYU TUNGKOL SA SEKSWLADIDA (ISSUE ABOUT SEXUALITYISYU TUNGKOL SA SEKSWLADIDA (ISSUE ABOUT SEXUALITY
ISYU TUNGKOL SA SEKSWLADIDA (ISSUE ABOUT SEXUALITY
 
MULTIDISCIPLINRY NATURE OF THE ENVIRONMENTAL STUDIES.pptx
MULTIDISCIPLINRY NATURE OF THE ENVIRONMENTAL STUDIES.pptxMULTIDISCIPLINRY NATURE OF THE ENVIRONMENTAL STUDIES.pptx
MULTIDISCIPLINRY NATURE OF THE ENVIRONMENTAL STUDIES.pptx
 
ACC 2024 Chronicles. Cardiology. Exam.pdf
ACC 2024 Chronicles. Cardiology. Exam.pdfACC 2024 Chronicles. Cardiology. Exam.pdf
ACC 2024 Chronicles. Cardiology. Exam.pdf
 
AMERICAN LANGUAGE HUB_Level2_Student'sBook_Answerkey.pdf
AMERICAN LANGUAGE HUB_Level2_Student'sBook_Answerkey.pdfAMERICAN LANGUAGE HUB_Level2_Student'sBook_Answerkey.pdf
AMERICAN LANGUAGE HUB_Level2_Student'sBook_Answerkey.pdf
 
ECONOMIC CONTEXT - PAPER 1 Q3: NEWSPAPERS.pptx
ECONOMIC CONTEXT - PAPER 1 Q3: NEWSPAPERS.pptxECONOMIC CONTEXT - PAPER 1 Q3: NEWSPAPERS.pptx
ECONOMIC CONTEXT - PAPER 1 Q3: NEWSPAPERS.pptx
 
How to Add Barcode on PDF Report in Odoo 17
How to Add Barcode on PDF Report in Odoo 17How to Add Barcode on PDF Report in Odoo 17
How to Add Barcode on PDF Report in Odoo 17
 
YOUVE GOT EMAIL_FINALS_EL_DORADO_2024.pptx
YOUVE GOT EMAIL_FINALS_EL_DORADO_2024.pptxYOUVE GOT EMAIL_FINALS_EL_DORADO_2024.pptx
YOUVE GOT EMAIL_FINALS_EL_DORADO_2024.pptx
 
Judging the Relevance and worth of ideas part 2.pptx
Judging the Relevance  and worth of ideas part 2.pptxJudging the Relevance  and worth of ideas part 2.pptx
Judging the Relevance and worth of ideas part 2.pptx
 
FILIPINO PSYCHology sikolohiyang pilipino
FILIPINO PSYCHology sikolohiyang pilipinoFILIPINO PSYCHology sikolohiyang pilipino
FILIPINO PSYCHology sikolohiyang pilipino
 
Inclusivity Essentials_ Creating Accessible Websites for Nonprofits .pdf
Inclusivity Essentials_ Creating Accessible Websites for Nonprofits .pdfInclusivity Essentials_ Creating Accessible Websites for Nonprofits .pdf
Inclusivity Essentials_ Creating Accessible Websites for Nonprofits .pdf
 
Barangay Council for the Protection of Children (BCPC) Orientation.pptx
Barangay Council for the Protection of Children (BCPC) Orientation.pptxBarangay Council for the Protection of Children (BCPC) Orientation.pptx
Barangay Council for the Protection of Children (BCPC) Orientation.pptx
 

Thesis Ncm 105, the reason behind the growing population of Koreans here in the Philippines

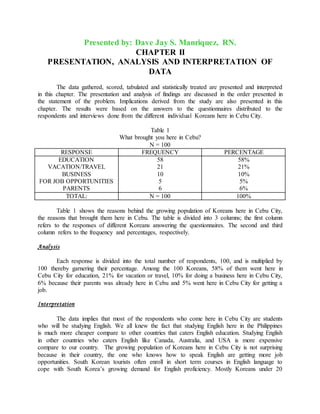
  • 1. Presented by: Dave Jay S. Manriquez, RN. CHAPTER II PRESENTATION, ANALYSIS AND INTERPRETATION OF DATA The data gathered, scored, tabulated and statistically treated are presented and interpreted in this chapter. The presentation and analysis of findings are discussed in the order presented in the statement of the problem. Implications derived from the study are also presented in this chapter. The results were based on the answers to the questionnaires distributed to the respondents and interviews done from the different individual Koreans here in Cebu City. Table 1 What brought you here in Cebu? N = 100 RESPONSE FREQUENCY PERCENTAGE EDUCATION VACATION/TRAVEL BUSINESS FOR JOB OPPORTUNITIES PARENTS 58 21 10 5 6 58% 21% 10% 5% 6% TOTAL: N = 100 100% Table 1 shows the reasons behind the growing population of Koreans here in Cebu City, the reasons that brought them here in Cebu. The table is divided into 3 columns; the first column refers to the responses of different Koreans answering the questionnaires. The second and third column refers to the frequency and percentages, respectively. Analysis Each response is divided into the total number of respondents, 100, and is multiplied by 100 thereby garnering their percentage. Among the 100 Koreans, 58% of them went here in Cebu City for education, 21% for vacation or travel, 10% for doing a business here in Cebu City, 6% because their parents was already here in Cebu and 5% went here in Cebu City for getting a job. Interpretation The data implies that most of the respondents who come here in Cebu City are students who will be studying English. We all knew the fact that studying English here in the Philippines is much more cheaper compare to other countries that caters English education. Studying English in other countries who caters English like Canada, Australia, and USA is more expensive compare to our country. The growing population of Koreans here in Cebu City is not surprising because in their country, the one who knows how to speak English are getting more job opportunities. South Korean tourists often enroll in short term courses in English language to cope with South Korea’s growing demand for English proficiency. Mostly Koreans under 20
  • 2. years old arrive in the Philippines every month to study English. Some Koreans also are coming here in Cebu City because the Department of Tourism introduces Cebu as a place of destination for Koreans in the Philippines. Since our place has many tourists spot, it is easy to sell to Koreans tourists because of our good beaches and resorts and hospitable people. Some Koreans do business here in Cebu City since business opportunities are great. Market competition is healthy and also the Philippine’s location and less expensive manpower makes it one of the best destinations for Koreans business. Some of the respondents come here in Cebu to stay for good, live and work here in Cebu since their parents was already here. Also some of them come in Cebu City for job opportunities since lots of establishments are offering high payment jobs like call centers. Table 2 How do you find out about Cebu? N = 100 RESPONSE FREQUENCY PERCENTAGE RELATIVES, FRIENDS MEDIA (tv, radio, print ads) OTHERS (school, internet, travel agency) 64 16 20 64% 16% 20% TOTAL: N = 100 100% Table 2 corresponds to table 1, on how did the Koreans find out about Cebu City. The table is divided into 3 columns; the first column refers to the responses of different Koreans answering the questionnaires. The second and third column refers to the frequency and percentages, respectively. Analysis Each response is divided into the total number of respondents, 100, and is multiplied by 100 thereby garnering their percentage. Among the 100 Koreans, 64% knows about Cebu City through their relatives and friends, 21% knows about Cebu City through school, Internet, and travel agency, and 16% knows about Cebu City through the media. Interpretation The data implies that most of the Koreans knows about Cebu City because of their friends and relatives who already visited here in Cebu. Starting 2004 there have been an increased Korean population in Cebu City and most of them have told their relatives about Cebu City about cheaper English education, nice places, good people, and cheaper cost of living. Some of the respondents able to find out Cebu City through Media advertisement done by the Department of Tourism, and other respondents know about Cebu City through school, internet like the Korean language tourism website, and promotion done by Korean travel agency.
  • 3. Table 3 Why did you choose Cebu City among other cities in the Philippines? N = 100 RESPONSE FREQUENCY PERCENTAGE SAFE CHEAP CATERS ENGLISH FAMOUS RECOMMENDED FRINEDLY/NICE PLACE 13 26 9 22 14 16 13% 26% 9% 22% 14% 16% TOTAL: N = 100 100% Table 3 shows the reasons why did most of the Koreans choose Cebu City among other cities in the Philippines as place of their destination. The table is divided into 3 columns; the first column refers to the responses of different Koreans answering the questionnaires. The second and third column refers to the frequency and percentages, respectively. Analysis Each response is divided into the total number of respondents, 100, and is multiplied by 100 thereby garnering their percentage. Among the 100 Koreans, 26% said that they choose Cebu City among other cities in the Philippines because of the cheap price of our goods, 22% said that Cebu City is famous in their country and it was well advertise by the Department of Tourism as the place of destination for the Koreans, 16% said that they choose Cebu City because of the warm friendly people and also there are lots of beautiful tourist spot that is found in Cebu City, 14% said it was recommended by their friends and relatives as place of destination, 13% said that it is more safer for them to stay here in Cebu than other cities in the Philippines, and 9% said that there are lot of schools who caters English education. Interpretation The data implies that most of the Korean respondents choose Cebu City among other cities in the Philippines because of the cheaper cost of living, education, attractive tourist spots, one of the safest cities in the Philippines and the positive attitude of the Cebuanos towards Korean migrants.
  • 4. Table 4 For how long have you been staying here in Cebu? N = 100 RESPONSE FREQUENCY PERCENTAGE 1 MONTH OR LESS 2 MONTHS 3 MONTHS 6 MONTHS 1 YEAR MORE THAN A YEAR 5 10 56 7 10 12 5% 10% 56% 7% 10% 12% TOTAL: N = 100 100% Table 4 shows the length of time most of the Koreans respondents stayed here in Cebu City. The table is divided into 3 columns; the first column refers to the responses of different Koreans answering the questionnaires. The second and third column refers to the frequency and percentages, respectively. Analysis Each response is divided into the total number of respondents, 100, and is multiplied by 100 thereby garnering their percentage. Among the 100 Koreans, 56% of them stay here for 3 months already here in Cebu City, 12% of them stay here for more than a year, 10% of them stay here for 1 year, 10% of them stay here for 2 months, 7% of them stay here for 6 months, and 5% of them stay here in Cebu City for only 1 month or less. Interpretation The data shows that most of the respondents stay in Cebu City for three months and only 5% stays for one month or less. This implies that most of the respondents take three months crash courses in conversational or business English or other courses in Cebu City, attracted by the affordable tuition and even cheaper cost of living.
  • 5. Table 5 Where are you staying? N = 100 RESPONSE FREQUENCY PERCENTAGE HOTEL PENSION HOUSE APARTMENT BOARDING HOUSE DORMITORY HOUSE 30 12 8 8 34 8 30% 12% 8% 8% 34% 8% TOTAL: N = 100 100% Table 5 shows where did most of the Koreans respondents are staying while they are here in Cebu City. The table is divided into 3 columns; the first column refers to the responses of different Koreans answering the questionnaires. The second and third column refers to the frequency and percentages, respectively. Analysis Each response is divided into the total number of respondents, 100, and is multiplied by 100 thereby garnering their percentage. Among the 100 Koreans, 34% of them are staying in a dormitory, 30% of them are staying in a hotel, 12% of them are staying in a pension house, and 8% of them are staying in an apartment, boarding house, and owned house while they are staying here in Cebu City. Interpretation The data implies that most of the Korean respondents are students, and they usually stay in a dormitory for it is cheaper, and usually they stay in a dormitory that is located near the school for easy travel and accessible. Some of Korean respondents are tourists having their vacation/travel here in Cebu and mostly of them stay in a Hotel and Pension House since most of the Korean tourists can afford luxurious establishment. Commonly, some of the Korean respondents stay in apartments, boarding houses, and owned house.
  • 6. Table 6 How much are you paying for lodging? N = 100 RESPONSE FREQUENCY PERCENTAGE Less than 1,000/day 1,000 – 2,000/day 2,000 or more/day Not sure 38 32 12 10 41% 35% 13% 11% TOTAL: N = 92 100% Table 6 corresponds to table 5 that refers to the amount they are expending for their lodging per day. The table is divided into 3 columns; the first column refers to the responses of different Koreans answering the questionnaires. The second and third column refers to the frequency and percentages, respectively. Analysis Each response is divided into the total number of respondents, 92, and is multiplied by 100 thereby garnering their percentage. Among the 92 Koreans who pay for their lodging, 38% pay less than P1, 000 per day, 32% pay P1, 000-2,000 per day, 12% pay P2, 000 or more per day, 10% are not sure for how much they expend for their lodging. Interpretation The data implies that most of the respondents are paying less than 1,000 per day for lodging due to the cheaper cost of living in Cebu City. Table 7 How many visits have you made here in Cebu? N = 100 RESPONSE FREQUENCY PERCENTAGE 1 TIME 2 TIMES 3 TIMES 4 TIMES 5 TIMES MORE THAN 5 TIMES 75 25 0 0 0 0 75% 25% 0% 0% 0% 0% TOTAL: N = 100 100% Table 7 shows how many times they have already visited Cebu City. The table is divided into 3 columns; the first column refers to the responses of different Koreans answering the questionnaires. The second and third column refers to the frequency and percentages, respectively.
  • 7. Analysis Each response is divided into the total number of respondents, 100, and is multiplied by 100 thereby garnering their percentage. Among the 100 Koreans, 75% of them have visit Cebu City for the first time, and 25% of them have visited Cebu City for the second time. Interpretation The data implies that most of the Korean respondents have visited Cebu for the first time and the rest of the respondents have visited Cebu for the second time. This implies that most of the respondents came here for vacation, to explore Cebu City, and learn English language. For those respondents who visited Cebu City for the second time, are interested to learn English, liked the cebuanos’ hospitality, attractive tourist spots, and engaged in business. Table 8 State the reasons that made you come back here in Cebu? N = 100 RESPONSE FREQUENCY PERCENTAGE BUSINESS STUDY ENGLISH GOOD PLACE/PEOPLE 5 10 10 20% 40% 40% TOTAL: N = 25 100% Table 8 corresponds to table 7, on what are their reasons why they come back here in Cebu City. The table is divided into 3 columns; the first column refers to the responses of different Koreans answering the questionnaires. The second and third column refers to the frequency and percentages, respectively. Analysis Each response is divided into the total number of respondents, 25, and is multiplied by 100 thereby garnering their percentage. Among the 25 Koreans who have their visit for the second time in Cebu City, 10% of them come back in Cebu City for studying English, 10% of them said that Cebu City is a nice place and the people are very warm and friendly also hospitable, and 5% of them said that they come back here to do business. Interpretation The data implies that more Koreans come to Cebu to study English because the cost of English education is less expensive and so is the cost of living. Cebu City is also advertised by the Department of Tourism as one of the best tourist destination due to its beaches and hospitable locals. Lastly, Koreans come to Cebu for business because the cost of manpower is less expensive.
  • 8. Table 9 What do you like most about Cebu? N = 100 RESPONSE FREQUENCY PERCENTAGE FOOD CULTURE PRICE PEOPLE PLACES 19 16 10 28 27 19% 16% 10% 28% 27% TOTAL: N = 100 100% Table 9 shows the things that most Koreans like about Cebu City. The table is divided into 3 columns; the first column refers to the responses of different Koreans answering the questionnaires. The second and third column refers to the frequency and percentages, respectively. Analysis Each response is divided into the total number of respondents, 100, and is multiplied by 100 thereby garnering their percentage. Among the 100 Koreans, 28% of them said that the things they like most about Cebu City is their people on the way they treat them, their being warm and friendly to the Koreans. 24% of them said it was the place that they like most about Cebu City; there are lots of tourist’s spot and good beaches. 19% of them said it was the food that is being served to them, 16% of them said that it was our unique culture, and 10% of them said that the price of our goods is much more cheaper compare to other places. Interpretation The data implies that 28% of the Korean respondents says that they like the people of Cebu City most because of the Cebuanos positive response to Korean migrants and hospitality. Aside from the people, Korean respondents also prefers the places found in Cebu City like the common tourist destinations like beaches, Korean’s churches and shopping center, which offers variety of cheaper and fashionable items. The Korean respondents also like the food in Cebu because there are many Korean restaurants having prominent Korean language signs and few offer any English explanation. The respondents also like the unique culture of the Cebuanos.
  • 9. Table 10 Do you feel safe staying here in Cebu? N = 100 RESPONSE FREQUENCY PERCENTAGE YES NO 70 30 70% 30% TOTAL: N = 100 100% Table 10 shows their feelings about their safety while they are staying here in Cebu City. The table is divided into 3 columns; the first column refers to the responses of different Koreans answering the questionnaires, the first column is answerable by yes or no. The second and third column refers to the frequency and percentages, respectively. Analysis Each response is divided into the total number of respondents, 100, and is multiplied by 100 thereby garnering their percentage. Among the 100 Koreans, 70% of them said that they are safe in Cebu City compared to other cities in the Philippines, and only 30% of them said that they are not safe in Cebu City. Interpretation The data implies that most of the respondents feels safe about coming to Cebu City because it is one of the cities with low crime rates. Since 2006, the Philippine National Police statistics show a consistent drop in crime rates in the Philippines, particularly in Cebu City. This attracts tourist and foreign investors to come to Cebu City. Table 11 What bad experiences have you encountered while staying in Cebu? N = 100 RESPONSE FREQUENCY PERCENTAGE NOT YET ABUSIVE DRIVER TRAFFIC LOST ITEMS 58 26 6 10 58% 26% 6% 10% TOTAL: N = 100 100% Table 11 shows the bad experiences most of the respondents encountered while staying here in Cebu City. The table is divided into 3 columns; the first column refers to the responses of different Koreans answering the questionnaires. The second and third column refers to the frequency and percentages, respectively.
  • 10. Analysis Each response is divided into the total number of respondents, 100, and is multiplied by 100 thereby garnering their percentage. Among the 100 Koreans, 58% of them said that they have not yet encountered bad experiences while they are staying here in Cebu City, 26% of them said that they are being abuse by our drivers regarding the payment for our public transportation and taxi fares, 10% of them said that their bad experiences while staying here in Cebu City is lost of valuable items, and 6% of them said that they have already experience heavy traffic. Interpretation The data implies that most Korean visitors have not yet encountered bad experiences during stay in Cebu City. They treated Cebu as one of the safest city across the region. While some other Korean visitors have encountered minimal problem on some abusive drivers. This problem poses more danger in life that could lead accident resulted to sudden death. Unattended personal belongings resulting to stealing is not a threat on most Korean respondents. Some of the Korean respondents have experience less problem regarding to traffic situation in Cebu City. Table 12 If given the chance, would you like to stay here for good? N = 100 RESPONSE FREQUNECY PERCENTAGE YES NO 49 51 49% 51% TOTAL: N = 100 100% Table 12 shows the respondents responses whether they like to stay in Cebu City for good if they will be given the chance to stay. The table is divided into 3 columns; the first column refers to the responses of different Koreans answering the questionnaires the, first column is answerable by yes or no. The second and third column refers to the frequency and percentages, respectively. Analysis Each response is divided into the total number of respondents, 100, and is multiplied by 100 thereby garnering their percentage. Among the 100 Koreans, 49% of them said that they would like to stay in Cebu City for good if they will be given the chance, and 51% of them said that that they will be returning home. Interpretation The data implies that a greater number of respondents prefers to return to Korea to work and apply what they have learned in the Philippines while a few number of respondents say’s that they prefer to do business in Cebu City and further study.
  • 11. Table 13 Are you going to recommend Cebu as a choice of Destination to others? N = 100 RESPONSE FREQUENCY PERCENTAGE YES NO 87 13 87% 13% TOTAL: N = 100 100% Table 13 shows the respondents responses if they will be going to recommend Cebu City as a place of destination to other Koreans in their country. The table is divided into 3 columns; the first column refers to the responses of different Koreans answering the questionnaires the, first column is answerable by yes or no. The second and third column refers to the frequency and percentages, respectively. Analysis Each response is divided into the total number of respondents, 100, and is multiplied by 100 thereby garnering their percentage. Among the 100 Koreans, 87% of them said that they are going to recommend Cebu City as a place of destination of Koreans in the Philippines to others, and 13% of them said they would not. Interpretation The data implies that most of the Korean respondents says that they will recommend Cebu City as a choice of destination because of the cheaper cost of living, affordable cost of education and attractive tourist spots. A few of the respondents don’t recommend Cebu City as a place of destination because of the negative experience they have.
  • 12. Treatment of Data: The results of the questionnaires distributed were sorted out, tallied and tabulated. The questionnaires are answerable by checking the options that the respondents feel appropriate. Some questions are also answerable by yes or no. In each table, options were arranged to the number of respondents by which it is represented as N. The percentage was computed with the formula: % = f/N x 100. Where: f = the number of options checked by a respondents N = the total number of respondents The percentage was used in statistical treatment, the percentages were taken by dividing the number of options checked by the total number of respondents, and then the quotient was multiplied by one hundred.