SlideShare a Scribd company logo
1 of 10
Total # Opportunities by Stage                                                                                    Total Collateral Created/Updated
     Prospecting                            Qualification                            Needs Analysis
                                                                                                                                              Current Fiscal Actual                           Current Fiscal Goal
     Value Proposition                      Proposal/Price Quote                     Negotiation/Review
                                                                                                                 7
3,000
                                                                                                                 6
2,500
                                                                                                                 5
2,000
                                                                                                                 4
1,500
                                                                                                                 3
1,000                                                                                                            2
 500                                                                                                             1
     0                                                                                                           0
           Jan    Feb    Mar         Apr    May        Jun     Jul    Aug     Sept       Oct     Nov       Dec          Jan       Feb     Mar      Apr     May        Jun      Jul      Aug    Sept     Oct    Nov    Dec


                                           Webcast Series                                                                                                      Brand Impressions
                                                 Webcast Attendees                                                                                                          Total Impressions

80                                                                                                               160,000
70                                                                                                               140,000

60                                                                                                               120,000

50                                                                                                               100,000

40                                                                                                                   80,000
                                                                                                                     60,000
30
                                                                                                                     40,000
20
                                                                                                                     20,000
10
                                                                                                                            0
0                                                                                                                                Jan     Feb     Mar     Apr    May     Jun      Jul     Aug Sept       Oct    Nov    Dec
         Jan    Feb    Mar     Apr      May      Jun     Jul       Aug     Sept    Oct     Nov       Dec


                              Budget/Total Revenue Ratio (%)                                                                                           Total Leads by Event Type
                                     Current Fiscal Actual           Current Fiscal Goal                                                                       Event Type #1 - Online Webinars
                                                                                                                                                               Event Type #2 - Tradeshows
8%                                                                                                                                                             Event Type #3 - Industry Conference
                                                                                                                     140
7%
                                                                                                                     120
6%
                                                                                                                     100
5%
4%                                                                                                                    80

3%                                                                                                                    60

2%                                                                                                                    40
1%                                                                                                                    20
0%                                                                                                                      0
          Jan    Feb    Mar     Apr        May    Jun        Jul     Aug    Sept     Oct       Nov     Dec                      Jan     Feb     Mar      Apr    May     Jun       Jul    Aug     Sept    Oct    Nov    Dec
Net New Customers                                                                                      Customer Retention Rate
                                           Number of New Customers Acquired                                                                     Current Fiscal Actual         Current Fiscal Goal
90
                                                                                                                       1
80                                                                                                                   0.9
70                                                                                                                   0.8
60                                                                                                                   0.7
50                                                                                                                   0.6
40                                                                                                                   0.5
                                                                                                                     0.4
30
                                                                                                                     0.3
20                                                                                                                   0.2
10                                                                                                                   0.1
 0                                                                                                                     0
       Jan       Feb     Mar       Apr     May       Jun       Jul         Aug     Sept     Oct     Nov    Dec              Jan    Feb    Mar      Apr    May     Jun   Jul    Aug    Sept    Oct   Nov   Dec


                                               Database Size                                                                             CRM Adoption Rate
                                                      Total Records                                                                                  % regular users

120,000
                                                                                                                  100%
100,000
                                                                                                                  80%
 80,000

 60,000                                                                                                           60%

 40,000                                                                                                           40%

 20,000                                                                                                           20%
       0
                                                                                                                   0%
             Jan       Feb    Mar        Apr    May      Jun         Jul     Aug     Sept     Oct    Nov    Dec
                                                                                                                           Jan    Feb    Mar      Apr    May     Jun    Jul    Aug    Sept    Oct   Nov   Dec


                                    Total Number of Custumers                                                                            Expected Lifetime Value/Customers
                                    Current Fiscal Actual                   Current Fiscal Goal                                                Current Fiscal Actual          Current Fiscal Goal
                                                                                                                   58500
9200
                                                                                                                   57000
8800
                                                                                                                   55500
8400
                                                                                                                   54000
8000                                                                                                               52500
7600                                                                                                               51000
7200                                                                                                               49500
6800                                                                                                               48000
           Jan     Feb       Mar     Apr       May     Jun      Jul         Aug     Sept    Oct     Nov    Dec              Jan    Feb    Mar      Apr    May     Jun   Jul    Aug    Sept    Oct   Nov   Dec
New Leads by Channel                                                                                             Opportunities in Pipeline ($)
Webcast Registrations                      Contact Center Appointments                Whitepaper Downloads                                                               Current Fiscal Actual
Free Trial on Website                      Channel Partners                           Tradeshows                        $1,000,000
 800
 700                                                                                                                      $800,000
 600
                                                                                                                          $600,000
 500
 400                                                                                                                      $400,000
 300
 200                                                                                                                      $200,000

 100
                                                                                                                                  $0
     0                                                                                                                                   Jan      Feb    Mar       Apr    May       Jun         Jul     Aug     Sep      Oct    Nov    Dec
             Jan     Feb       Mar     Apr       May     Jun         Jul       Aug    Sept    Oct        Nov    Dec


                               # Contacts in Database                                                                                                              Cost per lead ($)
                               Current Fiscal Actual                Current Fiscal Goal                                                                                   Current Fiscal Actual

25,000
                                                                                                                         $600

20,000                                                                                                                   $500

                                                                                                                         $400
15,000
                                                                                                                         $300
10,000
                                                                                                                         $200
 5,000                                                                                                                   $100

                                                                                                                           $0
         0
               Jan       Feb     Mar       Apr    May        Jun         Jul    Aug    Sep         Oct    Nov    Dec               Jan    Feb      Mar       Apr     May      Jun         Jul         Aug     Sep     Oct      Nov    Dec


                                 Landing Page Conversion Rate                                                                                       Email Campaign Click Through Rates
                                                   Current Fiscal Actual

4%                                                                                                                     Winback Program

                                                                                                                                Newsletter
3%
                                                                                                                           Campaign 4

2%                                                                                                                         Campaign 3

                                                                                                                           Campaign 2
1%
                                                                                                                           Campaign 1

0%                                                                                                                                           0%         1%         2%        3%           4%            5%          6%         7%      8%
         Jan       Feb     Mar       Apr     May       Jun         Jul     Aug       Sep     Oct     Nov       Dec
Social Network Reach                                                                                Blog Posting/Tweets by Topic
 Twitter (Followers)                 Facebook (Fans)                      Blog (RSS Feed Subscribers)        Company News          New Products          Thought Leadership             Financial       Industry Trends
 LinkedIn (Contacts)                 Myspace (Friends)
                                                                                                        16
                                                                                                        14
2500
                                                                                                        12
2000                                                                                                    10
1500                                                                                                    8
                                                                                                        6
1000
                                                                                                        4
 500                                                                                                    2
  0                                                                                                     0
       Jan     Feb     Mar     Apr     May    Jun      Jul       Aug    Sept    Oct     Nov   Dec                 Jan     Feb     Mar     Apr      May     Jun       Jul         Aug   Sept     Oct      Nov      Dec


                 Referral Traffic (All Social Media Channels)                                                                            Total Comments/Re-Tweets
                                                                                                                                                          Current Fiscal Actual
                         Current Fiscal Actual                    Current Fiscal Goal
                                                                                                             25
6000

5000                                                                                                         20

4000                                                                                                         15

3000
                                                                                                             10
2000
                                                                                                              5
1000

   0                                                                                                          0
        Jan    Feb     Mar     Apr     May    Jun      Jul       Aug    Sep     Oct     Nov   Dec                   Jan     Feb     Mar      Apr     May       Jun         Jul      Aug     Sep       Oct     Nov   Dec


                                      Facebook Fans                                                                                                Twitter Followers
                             Current Fiscal Actual             Current Fiscal Goal                                                       Current Fiscal Actual                    Current Fiscal Goal
                                                                                                        900
 700
                                                                                                        800
 600
                                                                                                        700
 500                                                                                                    600
 400                                                                                                    500
                                                                                                        400
 300
                                                                                                        300
 200
                                                                                                        200
 100                                                                                                    100
   0                                                                                                         0
        Jan     Feb    Mar     Apr     May    Jun        Jul     Aug    Sep     Oct     Nov   Dec                  Jan     Feb     Mar      Apr     May     Jun       Jul        Aug      Sep     Oct       Nov   Dec
Traffic Sources                                                                                            Top Pages & Total Page Views
                   Google          Direct         Yahoo          Bing          Ask          Twitter                              Home          Products           Catalogue          Company           Governance
 6000                                                                                                       8000
                                                                                                            7000
 5000
                                                                                                            6000
 4000
                                                                                                            5000
 3000                                                                                                       4000
                                                                                                            3000
 2000
                                                                                                            2000
 1000
                                                                                                            1000
      0                                                                                                       0
           Jan    Feb    Mar      Apr    May      Jun     Jul    Aug    Sept      Oct      Nov    Dec                  Jan       Feb     Mar        Apr     May        Jun     Jul     Aug      Sept     Oct    Nov    Dec


                                        Unique Visitors                                                                                                           Pages/Visit
                                  Current Fiscal Actual          Current Fiscal Goal                                                                              Current Fiscal Actual
25,000                                                                                                                 5

20,000                                                                                                                 4

15,000                                                                                                                 3

10,000                                                                                                                 2

 5,000                                                                                                                 1

      0                                                                                                                0
           Jan    Feb    Mar      Apr       May    Jun     Jul    Aug     Sep        Oct    Nov       Dec                    Jan       Feb    Mar         Apr    May     Jun     Jul      Aug     Sep     Oct    Nov    Dec


                                            Bounce Rate                                                                                                   Time on Site (Minutes)
                              Current Fiscal Actual         Current Fiscal Goal                                                                       Current Fiscal Actual            Current Fiscal Goal

60%                                                                                                                3

50%

40%                                                                                                                2

30%

20%                                                                                                                1

10%

 0%                                                                                                                0
          Jan    Feb    Mar     Apr     May       Jun     Jul    Aug     Sep      Oct      Nov    Dec                      Jan     Feb       Mar     Apr        May    Jun     Jul     Aug      Sep     Oct     Nov    Dec
Dashboard Data Input

Marketing Program Metrics                        Q1                         Q2                            Q3                            Q4
Total # Opportunities by Stage          Jan      Feb      Mar      Apr      May       Jun        Jul      Aug       Sept      Oct       Nov       Dec

 Prospecting                            893      902      911      920      929       938       947       956       965       974       983       992

 Qualification                          783      789      795      801      807       813       819       825       831       837       843       849

 Needs Analysis                         284      293      302      311      320       329       338       347       356       365       374       383

 Value Proposition                      103      106      109      112      115       118       121       124       127       130       133       136

 Proposal/Price Quote                   59       63       67       71        75        79        83        87        91        95        99       103

 Negotiation/Review                     23       25       27       29        31        33        35        37        39        41        43        45

Total Collateral Created/Updated        Jan      Feb      Mar      Apr      May       Jun        Jul      Aug       Sept      Oct       Nov       Dec

 Current Fiscal Actual                   3        2        2        1        4         5         4         3         4         5         6         4

 Current Fiscal Goal                     2        2        2        2        2         2         2         2         2         2         2         2

Webcast Series                          Jan      Feb      Mar      Apr      May       Jun        Jul      Aug       Sept      Oct       Nov       Dec

 Webcast Attendees                      13       18       24       15        28        35        67        46        58        63        41        69

Brand Impressions                       Jan      Feb      Mar      Apr      May       Jun        Jul      Aug       Sept      Oct       Nov       Dec

 Total Impressions                     78,495   80,394   93,040   96,049   104,950   123,144   103,940   104,059   130,455   129,405   149,856   129,450

Budget/Total Revenue Ratio (%)          Jan      Feb      Mar      Apr      May       Jun        Jul      Aug       Sept      Oct       Nov       Dec

 Current Fiscal Actual                 4.2%     3.8%     5.3%     6.4%      7.0%      4.3%      3.4%      6.4%      4.5%      6.3%      5.3%      3.9%

 Current Fiscal Goal                   6.0%     6.0%     6.0%     6.0%      6.0%      6.0%      6.0%      6.0%      6.0%      6.0%      6.0%      6.0%

Total Leads by Event Type               Jan      Feb      Mar      Apr      May       Jun        Jul      Aug       Sept      Oct       Nov       Dec

 Event Type #1 - Online Webinars        62       35       26       29        39        45        49        54        67        54        68        52

 Event Type #2 - Tradeshows              3        4        3       10        15        29        21        15        19        27        35        31

 Event Type #3 - Industry Conference     3        3        2        6        7         8         9         5         3         20        26        34
Customer Program Metrics                       Q1                            Q2                            Q3                            Q4
Net New Customers                    Jan       Feb       Mar       Apr       May       Jun        Jul      Aug       Sept      Oct       Nov       Dec

 Number of New Customers Acquired     62        67        65        69        71        72        74        76        78        80        82        84

Customer Retention Rate              Jan       Feb       Mar       Apr       May       Jun        Jul      Aug       Sept      Oct       Nov       Dec

 Current Fiscal Actual              78.0%     77.0%     79.0%     80.0%     76.0%     84.0%     89.0%     92.0%     85.0%     83.0%     89.0%     79.0%

 Current Fiscal Goal                85.0%     85.0%     85.0%     85.0%     85.0%     85.0%     85.0%     85.0%     85.0%     85.0%     85.0%     85.0%

Database Size                        Jan       Feb       Mar       Apr       May       Jun        Jul      Aug       Sept      Oct       Nov       Dec

 Total Records                      50,394    55,304    60,214    54,590    57,607    60,624    89,504    92,044    94,584    97,124    99,664    102,204

CRM Adoption Rate                    Jan       Feb       Mar       Apr       May       Jun        Jul      Aug       Sept      Oct       Nov       Dec

 % regular users                    46.0%     49.0%     57.0%     65.0%     68.0%     68.0%     68.0%     72.0%     75.0%     85.0%     95.0%     97.0%

Total Number of Customers            Jan       Feb       Mar       Apr       May       Jun        Jul      Aug       Sept      Oct       Nov       Dec

 Current Fiscal Actual               7,659     7,729     7,799     7,869     7,939     8,009     8,079     8,149     8,219     8,289     8,359     8,429

 Current Fiscal Goal                 7,750     7,850     7,950     8,050     8,150     8,250     8,350     8,450     8,550     8,650     8,750     8,850

Expected Lifetime Value/Customer     Jan       Feb       Mar       Apr       May       Jun        Jul      Aug       Sept      Oct       Nov       Dec

 Current Fiscal Actual              $51,034   $51,034   $51,034   $51,034   $51,034   $56,839   $56,839   $56,839   $56,839   $56,839   $56,839   $56,839

 Current Fiscal Goal                $56,000   $56,000   $56,000   $56,000   $56,000   $56,000   $57,000   $57,000   $57,000   $57,000   $57,000   $57,000

Lead Generation Metrics                        Q1                            Q2                            Q3                            Q4
New Leads by Channel                 Jan       Feb       Mar       Apr       May       Jun        Jul      Aug       Sept      Oct       Nov       Dec

 Webcast Registrations                34        45        49        55        48        89        34       139       219       174       175       184

 Contact Center Appointments          56        58        54        39        54        67        48        43        34        78        48        45

 Whitepaper Downloads                 31        34        37        40        43        46        49        52        55        58        61        64

 Free Trial on Website               234       245       256       267       278       289       300       311       322       333       344       355

 Channel Partners                     23        43        47        50        53        56        59        62        65        68        71        74

 Tradeshows                           24       142        0         28        58        21        0         4         35        21        17        8
Opportunities in Pipeline ($)     Jan           Feb       Mar        Apr       May         Jun        Jul        Aug        Sep        Oct        Nov        Dec

  Current Fiscal Actual         $234,950    $395,064    $506,348   $495,064   $294,054   $495,064   $384,950   $395,006   $604,860   $785,965   $895,694   $785,960

Contacts in Database              Jan           Feb       Mar        Apr       May         Jun        Jul        Aug        Sep        Oct        Nov        Dec

  Current Fiscal Actual          12995          13203    13411      13619      13827      16043      16940      17837      18734      19631      20528      21425

  Current Fiscal Goal            13000          13500    14000      14500      15000      15500      16000      16500      17000      17500      18000      17500

Cost Per Lead ($)                 Jan           Feb       Mar        Apr       May         Jun        Jul        Aug        Sep        Oct        Nov        Dec

  Current Fiscal Actual          $318           $375     $432       $489       $485       $323       $289       $483       $384       $328       $345       $343

Landing Page Conversion Rate      Jan           Feb       Mar        Apr       May         Jun        Jul        Aug        Sep        Oct        Nov        Dec

  Current Fiscal Actual          1.7%           1.9%     2.1%       2.3%       2.5%       2.7%       2.4%       2.4%       3.2%       3.6%       3.4%       3.3%

Email Marketing Campaigns       Click Through Rate

  Campaign 1                             3.1%

  Campaign 2                             3.6%

  Campaign 3                             2.5%

  Campaign 4                             2.0%

  Newsletter                             5.3%

  Winback Program                        7.3%


Social Media Metrics                             Q1                             Q2                               Q3                               Q4
Social Network Reach              Jan           Feb       Mar        Apr       May         Jun        Jul        Aug       Sept        Oct        Nov        Dec

  Twitter (Followers)             500            550      550        600        600        600        650        650        650        700        700        700

  Facebook (Fans)                 300            300      350        350        400        400        450        450        500        500        550        600

  Blog (RSS Feed Subscribers)     100            125      125        150        145        175        164        200        210        200        209        245

  LinkedIn (Contacts)             50             60       65         60         75         100        89         110        125        124        132        150

  Myspace (Friends)               200            210      220        215        220        210        230        240        235        245        250        254

Blog Postings/Tweets by Topic     Jan           Feb       Mar        Apr       May         Jun        Jul        Aug       Sept        Oct        Nov        Dec
Company News                            2      1      1      2      1      2      3      1      2      1      1      3

  New Products                            2      3      2      3      2      1      2      3      2      4      2      4

  Thought Leadership                      4      6      5      6      7      5      4      3      5      6      5      3

  Financial                               1      1      1      1      1      1      1      1      1      1      1      1

  Industry Trends                         2      2      2      2      2      2      2      2      2      2      2      2

Referral Traffic (All Social Channels)   Jan    Feb    Mar    Apr    May    Jun    Jul    Aug    Sep    Oct    Nov    Dec

  Current Fiscal Actual                  2500   2675   2700   3100   3097   3078   4201   4305   4650   4789   4970   5389

  Current Fiscal Goal                    3000   3000   3500   3500   4000   4000   4500   4500   5000   5000   5500   5500

Total Comments/Re-Tweets                 Jan    Feb    Mar    Apr    May    Jun    Jul    Aug    Sep    Oct    Nov    Dec

  Current Fiscal Actual                   10     6      15     9      11     6      7      9      17     14     21     12

New Facebook Fans                        Jan    Feb    Mar    Apr    May    Jun    Jul    Aug    Sep    Oct    Nov    Dec

  Current Fiscal Actual                  300    300    350    350    400    400    450    450    500    500    550    600

  Current Fiscal Goal                    400    400    400    400    450    450    500    500    600    600    600    600

New Twitter Followers                    Jan    Feb    Mar    Apr    May    Jun    Jul    Aug    Sep    Oct    Nov    Dec

  Current Fiscal Actual                  500    550    550    600    600    600    650    650    650    700    700    700

  Current Fiscal Goal                    550    550    550    600    650    650    700    700    700    800    800    800

Website Metrics                                 Q1                   Q2                   Q3                   Q4
Traffic Sources                          Jan    Feb    Mar    Apr    May    Jun    Jul    Aug    Sept   Oct    Nov    Dec

  Google                                 3404   3483   3562   3641   3720   3799   3878   3957   4036   4115   4194   4273

  Direct                                 294    302    310    318    326    334    342    350    358    366    374    382

  Yahoo                                  234    245    256    267    278    289    300    311    322    333    344    355

  Bing                                   139    145    151    157    163    169    175    181    187    193    199    205

  Ask                                     31     34     37     40     43     46     49     52     55     58     61     64

  Twitter                                 24     29     34     39     44     49     54     59     64     69     74     79
Top Pages                Jan     Feb     Mar     Apr     May     Jun      Jul    Aug     Sept    Oct     Nov     Dec

 Home                    2030    2100    2170    2240    2310    2380    2450    2520    2590    2660    2730    2800

 Products                1195    1239    1283    1327    1371    1415    1459    1503    1547    1591    1635    1679

 Catalogue                693     724     755     786     817     848     879     910     941     972    1003    1034

 Company                  280     340     400     460     520     580     640     700     760     820     880     940

 Governance               181     193     205     217     229     241     253     265     277     289     301     313

Unique Visitors          Jan     Feb     Mar     Apr     May     Jun      Jul    Aug     Sep     Oct     Nov     Dec

 Current Fiscal Actual   12995   13203   13411   13619   13827   17856   18496   19400   18734   19631   20528   21425

 Current Fiscal Goal     15000   15000   15000   15000   15000   15000   15000   17500   17500   17500   17500   17500

Pages/Visit              Jan     Feb     Mar     Apr     May     Jun      Jul    Aug     Sep     Oct     Nov     Dec

 Current Fiscal Actual    3.3     3.4     3.3     3.6     3.2     3.6     3.3     3.5     3.4     3.9     3.8     3.5

Bounce Rate              Jan     Feb     Mar     Apr     May     Jun      Jul    Aug     Sep     Oct     Nov     Dec

 Current Fiscal Actual   41.0%   39.0%   40.2%   46.0%   47.0%   39.0%   51.0%   48.0%   39.0%   51.0%   49.0%   48.0%

 Current Fiscal Goal     40.0%   40.0%   40.0%   40.0%   40.0%   40.0%   40.0%   40.0%   40.0%   40.0%   40.0%   40.0%

Time on Site (Minutes)   Jan     Feb     Mar     Apr     May     Jun      Jul    Aug     Sep     Oct     Nov     Dec

 Current Fiscal Actual    1.5     1.6     1.6     1.7     1.7     1.8     1.8     1.9     1.9     2.0     2.0     2.1

 Current Fiscal Goal      2.0     2.0     2.0     2.0     2.0     2.0     2.0     2.0     2.0     2.0     2.0     2.0

More Related Content

What's hot

Bido Trends August - November, 2009
Bido Trends August - November, 2009Bido Trends August - November, 2009
Bido Trends August - November, 2009BidoDotCom
 
Shelub cdc health care professional travel lecture
Shelub cdc health care professional travel lectureShelub cdc health care professional travel lecture
Shelub cdc health care professional travel lectureAaron Shelub
 
state online video 2010
state online video 2010state online video 2010
state online video 2010Juan Varela
 
fiserv annual reports 2005
fiserv annual reports 2005fiserv annual reports 2005
fiserv annual reports 2005finance47
 
Deal Consideration Study
Deal Consideration StudyDeal Consideration Study
Deal Consideration Studyjvance99
 
Baltimore city md march 2010 market minute
Baltimore city md march 2010 market minuteBaltimore city md march 2010 market minute
Baltimore city md march 2010 market minuteAK Stout
 
Kauffman fellows 2010-ssp
Kauffman fellows 2010-sspKauffman fellows 2010-ssp
Kauffman fellows 2010-sspSanjaySubhedar
 
Experience Of Fully Distributed Scrum With No Time Overlap
Experience Of Fully Distributed Scrum With No Time OverlapExperience Of Fully Distributed Scrum With No Time Overlap
Experience Of Fully Distributed Scrum With No Time OverlapXebia IT Architects
 
Us Commercial Real Estate The Next Drag Aug12
Us Commercial Real Estate The Next Drag Aug12Us Commercial Real Estate The Next Drag Aug12
Us Commercial Real Estate The Next Drag Aug12futlus
 
Poster presentation
Poster presentationPoster presentation
Poster presentationredsys
 
Line by environment interaction, yield stability and grouping of test locatio...
Line by environment interaction, yield stability and grouping of test locatio...Line by environment interaction, yield stability and grouping of test locatio...
Line by environment interaction, yield stability and grouping of test locatio...ILRI
 
Yariv Lotan Navy Sea Ls 2nd Rule In China Mit Forum Jan 2010
Yariv Lotan  Navy Sea Ls 2nd Rule In China   Mit Forum Jan 2010Yariv Lotan  Navy Sea Ls 2nd Rule In China   Mit Forum Jan 2010
Yariv Lotan Navy Sea Ls 2nd Rule In China Mit Forum Jan 2010MIT Forum of Israel
 
Pricing Curves Diagrams
Pricing Curves DiagramsPricing Curves Diagrams
Pricing Curves DiagramsDavid Tracy
 
Kevin Ms Web Platform
Kevin Ms Web PlatformKevin Ms Web Platform
Kevin Ms Web Platformrsnarayanan
 
Lead Generation Metrics Dashboard
Lead Generation Metrics DashboardLead Generation Metrics Dashboard
Lead Generation Metrics DashboardDemand Metric
 
Shelub cdc health care professional travel lecture
Shelub cdc health care professional travel lectureShelub cdc health care professional travel lecture
Shelub cdc health care professional travel lectureAaron Shelub
 

What's hot (19)

Bido Trends August - November, 2009
Bido Trends August - November, 2009Bido Trends August - November, 2009
Bido Trends August - November, 2009
 
Shelub cdc health care professional travel lecture
Shelub cdc health care professional travel lectureShelub cdc health care professional travel lecture
Shelub cdc health care professional travel lecture
 
state online video 2010
state online video 2010state online video 2010
state online video 2010
 
fiserv annual reports 2005
fiserv annual reports 2005fiserv annual reports 2005
fiserv annual reports 2005
 
Deal Consideration Study
Deal Consideration StudyDeal Consideration Study
Deal Consideration Study
 
Baltimore city md march 2010 market minute
Baltimore city md march 2010 market minuteBaltimore city md march 2010 market minute
Baltimore city md march 2010 market minute
 
Kauffman fellows 2010-ssp
Kauffman fellows 2010-sspKauffman fellows 2010-ssp
Kauffman fellows 2010-ssp
 
Experience Of Fully Distributed Scrum With No Time Overlap
Experience Of Fully Distributed Scrum With No Time OverlapExperience Of Fully Distributed Scrum With No Time Overlap
Experience Of Fully Distributed Scrum With No Time Overlap
 
Us Commercial Real Estate The Next Drag Aug12
Us Commercial Real Estate The Next Drag Aug12Us Commercial Real Estate The Next Drag Aug12
Us Commercial Real Estate The Next Drag Aug12
 
237 valeof tiersssp_june07dl
237 valeof tiersssp_june07dl237 valeof tiersssp_june07dl
237 valeof tiersssp_june07dl
 
Poster presentation
Poster presentationPoster presentation
Poster presentation
 
Line by environment interaction, yield stability and grouping of test locatio...
Line by environment interaction, yield stability and grouping of test locatio...Line by environment interaction, yield stability and grouping of test locatio...
Line by environment interaction, yield stability and grouping of test locatio...
 
Yariv Lotan Navy Sea Ls 2nd Rule In China Mit Forum Jan 2010
Yariv Lotan  Navy Sea Ls 2nd Rule In China   Mit Forum Jan 2010Yariv Lotan  Navy Sea Ls 2nd Rule In China   Mit Forum Jan 2010
Yariv Lotan Navy Sea Ls 2nd Rule In China Mit Forum Jan 2010
 
Pricing Curves Diagrams
Pricing Curves DiagramsPricing Curves Diagrams
Pricing Curves Diagrams
 
Kevin Ms Web Platform
Kevin Ms Web PlatformKevin Ms Web Platform
Kevin Ms Web Platform
 
Guest2Web Business Case
Guest2Web Business CaseGuest2Web Business Case
Guest2Web Business Case
 
Lead Generation Metrics Dashboard
Lead Generation Metrics DashboardLead Generation Metrics Dashboard
Lead Generation Metrics Dashboard
 
Shelub cdc health care professional travel lecture
Shelub cdc health care professional travel lectureShelub cdc health care professional travel lecture
Shelub cdc health care professional travel lecture
 
Booz&co
Booz&coBooz&co
Booz&co
 

Viewers also liked

Analises de Sentimentos nas Midias Sociais
Analises de Sentimentos nas Midias SociaisAnalises de Sentimentos nas Midias Sociais
Analises de Sentimentos nas Midias SociaisPaulo Henrique de Sousa
 
Marketing Strategy Scorecard
Marketing Strategy ScorecardMarketing Strategy Scorecard
Marketing Strategy ScorecardDemand Metric
 
Partnership Marketing Strategy Scorecard
Partnership Marketing Strategy ScorecardPartnership Marketing Strategy Scorecard
Partnership Marketing Strategy ScorecardDemand Metric
 
Social Media Marketing Plan methodology
Social Media Marketing Plan methodologySocial Media Marketing Plan methodology
Social Media Marketing Plan methodologyDemand Metric
 
Marketing Plan Presentation Template
Marketing Plan Presentation TemplateMarketing Plan Presentation Template
Marketing Plan Presentation TemplateDemand Metric
 

Viewers also liked (6)

Chap019
Chap019Chap019
Chap019
 
Analises de Sentimentos nas Midias Sociais
Analises de Sentimentos nas Midias SociaisAnalises de Sentimentos nas Midias Sociais
Analises de Sentimentos nas Midias Sociais
 
Marketing Strategy Scorecard
Marketing Strategy ScorecardMarketing Strategy Scorecard
Marketing Strategy Scorecard
 
Partnership Marketing Strategy Scorecard
Partnership Marketing Strategy ScorecardPartnership Marketing Strategy Scorecard
Partnership Marketing Strategy Scorecard
 
Social Media Marketing Plan methodology
Social Media Marketing Plan methodologySocial Media Marketing Plan methodology
Social Media Marketing Plan methodology
 
Marketing Plan Presentation Template
Marketing Plan Presentation TemplateMarketing Plan Presentation Template
Marketing Plan Presentation Template
 

Similar to Key Marketing Metrics Dashboard

Leon Zemel: Achieving Big Marketing Goals Through Big Data
Leon Zemel: Achieving Big Marketing Goals Through Big DataLeon Zemel: Achieving Big Marketing Goals Through Big Data
Leon Zemel: Achieving Big Marketing Goals Through Big Data[x+1]
 
Hot Summer case study Online Meet Up
Hot Summer case study Online Meet UpHot Summer case study Online Meet Up
Hot Summer case study Online Meet UpOrange Online Meetup
 
Lori Jacobwith Engage Your Board HFH March2011
Lori Jacobwith Engage Your Board HFH March2011Lori Jacobwith Engage Your Board HFH March2011
Lori Jacobwith Engage Your Board HFH March2011Ignited Fundraising
 
Sales Dummy report
Sales Dummy reportSales Dummy report
Sales Dummy reportramesh77uom
 
Comparison wz peer grps
Comparison wz peer grpsComparison wz peer grps
Comparison wz peer grpsArpita Shah
 
Public Relations Budget Template
Public Relations Budget Template Public Relations Budget Template
Public Relations Budget Template Demand Metric
 
Business Strategy Metrics Dashboard
Business Strategy Metrics DashboardBusiness Strategy Metrics Dashboard
Business Strategy Metrics DashboardDemand Metric
 
Gregg Weiss, New York Life Presentation - BDI 4/14/11 Financial Services Soci...
Gregg Weiss, New York Life Presentation - BDI 4/14/11 Financial Services Soci...Gregg Weiss, New York Life Presentation - BDI 4/14/11 Financial Services Soci...
Gregg Weiss, New York Life Presentation - BDI 4/14/11 Financial Services Soci...Business Development Institute
 
“SCORECARD” Incentive Remuneration System for Microfinance
“SCORECARD” Incentive Remuneration System for Microfinance“SCORECARD” Incentive Remuneration System for Microfinance
“SCORECARD” Incentive Remuneration System for MicrofinanceMABSIV
 
Marketing Communications Budget Template
Marketing Communications Budget TemplateMarketing Communications Budget Template
Marketing Communications Budget TemplateDemand Metric
 
Social Media Marketing Budget Template
Social Media Marketing Budget TemplateSocial Media Marketing Budget Template
Social Media Marketing Budget TemplateDemand Metric
 
Social Media Metrics Dashboard
Social Media Metrics DashboardSocial Media Metrics Dashboard
Social Media Metrics DashboardDemand Metric
 
Stock flow modelling and agent based modelling
Stock flow modelling and agent based modellingStock flow modelling and agent based modelling
Stock flow modelling and agent based modellingStephen Kinsella
 
Investor Pain Index 11302007 Thru 07072009
Investor Pain Index 11302007 Thru 07072009Investor Pain Index 11302007 Thru 07072009
Investor Pain Index 11302007 Thru 07072009Jonathan Smith
 
E2 financial oep report
E2 financial oep reportE2 financial oep report
E2 financial oep reportSteve Santora
 
CRM Program Metrics Dashboard
CRM Program Metrics DashboardCRM Program Metrics Dashboard
CRM Program Metrics DashboardDemand Metric
 

Similar to Key Marketing Metrics Dashboard (20)

Leon Zemel: Achieving Big Marketing Goals Through Big Data
Leon Zemel: Achieving Big Marketing Goals Through Big DataLeon Zemel: Achieving Big Marketing Goals Through Big Data
Leon Zemel: Achieving Big Marketing Goals Through Big Data
 
P& L(1)
P& L(1)P& L(1)
P& L(1)
 
Hot Summer case study Online Meet Up
Hot Summer case study Online Meet UpHot Summer case study Online Meet Up
Hot Summer case study Online Meet Up
 
Lori Jacobwith Engage Your Board HFH March2011
Lori Jacobwith Engage Your Board HFH March2011Lori Jacobwith Engage Your Board HFH March2011
Lori Jacobwith Engage Your Board HFH March2011
 
Sales Dummy report
Sales Dummy reportSales Dummy report
Sales Dummy report
 
Comparison wz peer grps
Comparison wz peer grpsComparison wz peer grps
Comparison wz peer grps
 
Parker Hannifin 2012 Annual Report
Parker Hannifin 2012 Annual ReportParker Hannifin 2012 Annual Report
Parker Hannifin 2012 Annual Report
 
Public Relations Budget Template
Public Relations Budget Template Public Relations Budget Template
Public Relations Budget Template
 
Business Strategy Metrics Dashboard
Business Strategy Metrics DashboardBusiness Strategy Metrics Dashboard
Business Strategy Metrics Dashboard
 
Gregg Weiss, New York Life Presentation - BDI 4/14/11 Financial Services Soci...
Gregg Weiss, New York Life Presentation - BDI 4/14/11 Financial Services Soci...Gregg Weiss, New York Life Presentation - BDI 4/14/11 Financial Services Soci...
Gregg Weiss, New York Life Presentation - BDI 4/14/11 Financial Services Soci...
 
Pawel karas
Pawel karasPawel karas
Pawel karas
 
“SCORECARD” Incentive Remuneration System for Microfinance
“SCORECARD” Incentive Remuneration System for Microfinance“SCORECARD” Incentive Remuneration System for Microfinance
“SCORECARD” Incentive Remuneration System for Microfinance
 
Marketing Communications Budget Template
Marketing Communications Budget TemplateMarketing Communications Budget Template
Marketing Communications Budget Template
 
Social Media Marketing Budget Template
Social Media Marketing Budget TemplateSocial Media Marketing Budget Template
Social Media Marketing Budget Template
 
Social Media Metrics Dashboard
Social Media Metrics DashboardSocial Media Metrics Dashboard
Social Media Metrics Dashboard
 
Stock flow modelling and agent based modelling
Stock flow modelling and agent based modellingStock flow modelling and agent based modelling
Stock flow modelling and agent based modelling
 
Investor Pain Index 11302007 Thru 07072009
Investor Pain Index 11302007 Thru 07072009Investor Pain Index 11302007 Thru 07072009
Investor Pain Index 11302007 Thru 07072009
 
E2 financial oep report
E2 financial oep reportE2 financial oep report
E2 financial oep report
 
Lindsay o’sullivan cci presentation
Lindsay o’sullivan   cci presentationLindsay o’sullivan   cci presentation
Lindsay o’sullivan cci presentation
 
CRM Program Metrics Dashboard
CRM Program Metrics DashboardCRM Program Metrics Dashboard
CRM Program Metrics Dashboard
 

More from Demand Metric

The Impact of COVID-19 in B2B Marketing
The Impact of COVID-19 in B2B MarketingThe Impact of COVID-19 in B2B Marketing
The Impact of COVID-19 in B2B MarketingDemand Metric
 
Infographic Return Path Email Engagement
Infographic Return Path Email EngagementInfographic Return Path Email Engagement
Infographic Return Path Email EngagementDemand Metric
 
Infographic Vidyard Video Marketing 2018
Infographic Vidyard Video Marketing 2018Infographic Vidyard Video Marketing 2018
Infographic Vidyard Video Marketing 2018Demand Metric
 
Digital Marketing Best Practices Guide
Digital Marketing Best Practices GuideDigital Marketing Best Practices Guide
Digital Marketing Best Practices GuideDemand Metric
 
Content Marketing Solution Study
Content Marketing Solution StudyContent Marketing Solution Study
Content Marketing Solution StudyDemand Metric
 
SEO Technology Overview
SEO Technology OverviewSEO Technology Overview
SEO Technology OverviewDemand Metric
 
State of Video Marketing 2017
State of Video Marketing 2017State of Video Marketing 2017
State of Video Marketing 2017Demand Metric
 
Sales Enablement Maturity Model
Sales Enablement Maturity ModelSales Enablement Maturity Model
Sales Enablement Maturity ModelDemand Metric
 
Public Relations Maturity Model
Public Relations Maturity ModelPublic Relations Maturity Model
Public Relations Maturity ModelDemand Metric
 
Email Marketing Maturity Model
Email Marketing Maturity ModelEmail Marketing Maturity Model
Email Marketing Maturity ModelDemand Metric
 
Customer Engagement Maturity Model
Customer Engagement Maturity ModelCustomer Engagement Maturity Model
Customer Engagement Maturity ModelDemand Metric
 
Formalizing the Sales Support Function How-To Guide
Formalizing the Sales Support Function How-To GuideFormalizing the Sales Support Function How-To Guide
Formalizing the Sales Support Function How-To GuideDemand Metric
 
How to Launch a Mobile App Guide How-To Guide
How to Launch a Mobile App Guide How-To GuideHow to Launch a Mobile App Guide How-To Guide
How to Launch a Mobile App Guide How-To GuideDemand Metric
 
Getting Started with Agile Marketing How-To Guide
Getting Started with Agile Marketing How-To GuideGetting Started with Agile Marketing How-To Guide
Getting Started with Agile Marketing How-To GuideDemand Metric
 
Entering the European Market Successfully How-To Guide
Entering the European Market Successfully How-To GuideEntering the European Market Successfully How-To Guide
Entering the European Market Successfully How-To GuideDemand Metric
 
Driving SEO with Press Releases How-To Guide
Driving SEO with Press Releases How-To GuideDriving SEO with Press Releases How-To Guide
Driving SEO with Press Releases How-To GuideDemand Metric
 
Calculating Customer Lifetime Value How-To Guide
Calculating Customer Lifetime Value How-To GuideCalculating Customer Lifetime Value How-To Guide
Calculating Customer Lifetime Value How-To GuideDemand Metric
 
Lead Scoring: Five Steps to Getting Started How-To Guide
Lead Scoring: Five Steps to Getting Started How-To GuideLead Scoring: Five Steps to Getting Started How-To Guide
Lead Scoring: Five Steps to Getting Started How-To GuideDemand Metric
 
Social CRM Best Practices How-To Guide
Social CRM Best Practices How-To GuideSocial CRM Best Practices How-To Guide
Social CRM Best Practices How-To GuideDemand Metric
 
Marketing Resource Management How-To Guide
Marketing Resource Management How-To GuideMarketing Resource Management How-To Guide
Marketing Resource Management How-To GuideDemand Metric
 

More from Demand Metric (20)

The Impact of COVID-19 in B2B Marketing
The Impact of COVID-19 in B2B MarketingThe Impact of COVID-19 in B2B Marketing
The Impact of COVID-19 in B2B Marketing
 
Infographic Return Path Email Engagement
Infographic Return Path Email EngagementInfographic Return Path Email Engagement
Infographic Return Path Email Engagement
 
Infographic Vidyard Video Marketing 2018
Infographic Vidyard Video Marketing 2018Infographic Vidyard Video Marketing 2018
Infographic Vidyard Video Marketing 2018
 
Digital Marketing Best Practices Guide
Digital Marketing Best Practices GuideDigital Marketing Best Practices Guide
Digital Marketing Best Practices Guide
 
Content Marketing Solution Study
Content Marketing Solution StudyContent Marketing Solution Study
Content Marketing Solution Study
 
SEO Technology Overview
SEO Technology OverviewSEO Technology Overview
SEO Technology Overview
 
State of Video Marketing 2017
State of Video Marketing 2017State of Video Marketing 2017
State of Video Marketing 2017
 
Sales Enablement Maturity Model
Sales Enablement Maturity ModelSales Enablement Maturity Model
Sales Enablement Maturity Model
 
Public Relations Maturity Model
Public Relations Maturity ModelPublic Relations Maturity Model
Public Relations Maturity Model
 
Email Marketing Maturity Model
Email Marketing Maturity ModelEmail Marketing Maturity Model
Email Marketing Maturity Model
 
Customer Engagement Maturity Model
Customer Engagement Maturity ModelCustomer Engagement Maturity Model
Customer Engagement Maturity Model
 
Formalizing the Sales Support Function How-To Guide
Formalizing the Sales Support Function How-To GuideFormalizing the Sales Support Function How-To Guide
Formalizing the Sales Support Function How-To Guide
 
How to Launch a Mobile App Guide How-To Guide
How to Launch a Mobile App Guide How-To GuideHow to Launch a Mobile App Guide How-To Guide
How to Launch a Mobile App Guide How-To Guide
 
Getting Started with Agile Marketing How-To Guide
Getting Started with Agile Marketing How-To GuideGetting Started with Agile Marketing How-To Guide
Getting Started with Agile Marketing How-To Guide
 
Entering the European Market Successfully How-To Guide
Entering the European Market Successfully How-To GuideEntering the European Market Successfully How-To Guide
Entering the European Market Successfully How-To Guide
 
Driving SEO with Press Releases How-To Guide
Driving SEO with Press Releases How-To GuideDriving SEO with Press Releases How-To Guide
Driving SEO with Press Releases How-To Guide
 
Calculating Customer Lifetime Value How-To Guide
Calculating Customer Lifetime Value How-To GuideCalculating Customer Lifetime Value How-To Guide
Calculating Customer Lifetime Value How-To Guide
 
Lead Scoring: Five Steps to Getting Started How-To Guide
Lead Scoring: Five Steps to Getting Started How-To GuideLead Scoring: Five Steps to Getting Started How-To Guide
Lead Scoring: Five Steps to Getting Started How-To Guide
 
Social CRM Best Practices How-To Guide
Social CRM Best Practices How-To GuideSocial CRM Best Practices How-To Guide
Social CRM Best Practices How-To Guide
 
Marketing Resource Management How-To Guide
Marketing Resource Management How-To GuideMarketing Resource Management How-To Guide
Marketing Resource Management How-To Guide
 

Recently uploaded

Module-2-Lesson-2-COMMUNICATION-AIDS-AND-STRATEGIES-USING-TOOLS-OF-TECHNOLOGY...
Module-2-Lesson-2-COMMUNICATION-AIDS-AND-STRATEGIES-USING-TOOLS-OF-TECHNOLOGY...Module-2-Lesson-2-COMMUNICATION-AIDS-AND-STRATEGIES-USING-TOOLS-OF-TECHNOLOGY...
Module-2-Lesson-2-COMMUNICATION-AIDS-AND-STRATEGIES-USING-TOOLS-OF-TECHNOLOGY...JeylaisaManabat1
 
(南达科他州立大学毕业证学位证成绩单-永久存档)
(南达科他州立大学毕业证学位证成绩单-永久存档)(南达科他州立大学毕业证学位证成绩单-永久存档)
(南达科他州立大学毕业证学位证成绩单-永久存档)oannq
 
E J Waggoner against Kellogg's Pantheism 8.pptx
E J Waggoner against Kellogg's Pantheism 8.pptxE J Waggoner against Kellogg's Pantheism 8.pptx
E J Waggoner against Kellogg's Pantheism 8.pptxJackieSparrow3
 
南新罕布什尔大学毕业证学位证成绩单-学历认证
南新罕布什尔大学毕业证学位证成绩单-学历认证南新罕布什尔大学毕业证学位证成绩单-学历认证
南新罕布什尔大学毕业证学位证成绩单-学历认证kbdhl05e
 
Authentic No 1 Amil Baba In Pakistan Amil Baba In Faisalabad Amil Baba In Kar...
Authentic No 1 Amil Baba In Pakistan Amil Baba In Faisalabad Amil Baba In Kar...Authentic No 1 Amil Baba In Pakistan Amil Baba In Faisalabad Amil Baba In Kar...
Authentic No 1 Amil Baba In Pakistan Amil Baba In Faisalabad Amil Baba In Kar...Authentic No 1 Amil Baba In Pakistan
 
Inspiring Through Words Power of Inspiration.pptx
Inspiring Through Words Power of Inspiration.pptxInspiring Through Words Power of Inspiration.pptx
Inspiring Through Words Power of Inspiration.pptxShubham Rawat
 

Recently uploaded (6)

Module-2-Lesson-2-COMMUNICATION-AIDS-AND-STRATEGIES-USING-TOOLS-OF-TECHNOLOGY...
Module-2-Lesson-2-COMMUNICATION-AIDS-AND-STRATEGIES-USING-TOOLS-OF-TECHNOLOGY...Module-2-Lesson-2-COMMUNICATION-AIDS-AND-STRATEGIES-USING-TOOLS-OF-TECHNOLOGY...
Module-2-Lesson-2-COMMUNICATION-AIDS-AND-STRATEGIES-USING-TOOLS-OF-TECHNOLOGY...
 
(南达科他州立大学毕业证学位证成绩单-永久存档)
(南达科他州立大学毕业证学位证成绩单-永久存档)(南达科他州立大学毕业证学位证成绩单-永久存档)
(南达科他州立大学毕业证学位证成绩单-永久存档)
 
E J Waggoner against Kellogg's Pantheism 8.pptx
E J Waggoner against Kellogg's Pantheism 8.pptxE J Waggoner against Kellogg's Pantheism 8.pptx
E J Waggoner against Kellogg's Pantheism 8.pptx
 
南新罕布什尔大学毕业证学位证成绩单-学历认证
南新罕布什尔大学毕业证学位证成绩单-学历认证南新罕布什尔大学毕业证学位证成绩单-学历认证
南新罕布什尔大学毕业证学位证成绩单-学历认证
 
Authentic No 1 Amil Baba In Pakistan Amil Baba In Faisalabad Amil Baba In Kar...
Authentic No 1 Amil Baba In Pakistan Amil Baba In Faisalabad Amil Baba In Kar...Authentic No 1 Amil Baba In Pakistan Amil Baba In Faisalabad Amil Baba In Kar...
Authentic No 1 Amil Baba In Pakistan Amil Baba In Faisalabad Amil Baba In Kar...
 
Inspiring Through Words Power of Inspiration.pptx
Inspiring Through Words Power of Inspiration.pptxInspiring Through Words Power of Inspiration.pptx
Inspiring Through Words Power of Inspiration.pptx
 

Key Marketing Metrics Dashboard

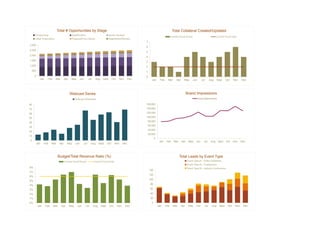
  • 1. Total # Opportunities by Stage Total Collateral Created/Updated Prospecting Qualification Needs Analysis Current Fiscal Actual Current Fiscal Goal Value Proposition Proposal/Price Quote Negotiation/Review 7 3,000 6 2,500 5 2,000 4 1,500 3 1,000 2 500 1 0 0 Jan Feb Mar Apr May Jun Jul Aug Sept Oct Nov Dec Jan Feb Mar Apr May Jun Jul Aug Sept Oct Nov Dec Webcast Series Brand Impressions Webcast Attendees Total Impressions 80 160,000 70 140,000 60 120,000 50 100,000 40 80,000 60,000 30 40,000 20 20,000 10 0 0 Jan Feb Mar Apr May Jun Jul Aug Sept Oct Nov Dec Jan Feb Mar Apr May Jun Jul Aug Sept Oct Nov Dec Budget/Total Revenue Ratio (%) Total Leads by Event Type Current Fiscal Actual Current Fiscal Goal Event Type #1 - Online Webinars Event Type #2 - Tradeshows 8% Event Type #3 - Industry Conference 140 7% 120 6% 100 5% 4% 80 3% 60 2% 40 1% 20 0% 0 Jan Feb Mar Apr May Jun Jul Aug Sept Oct Nov Dec Jan Feb Mar Apr May Jun Jul Aug Sept Oct Nov Dec
  • 2. Net New Customers Customer Retention Rate Number of New Customers Acquired Current Fiscal Actual Current Fiscal Goal 90 1 80 0.9 70 0.8 60 0.7 50 0.6 40 0.5 0.4 30 0.3 20 0.2 10 0.1 0 0 Jan Feb Mar Apr May Jun Jul Aug Sept Oct Nov Dec Jan Feb Mar Apr May Jun Jul Aug Sept Oct Nov Dec Database Size CRM Adoption Rate Total Records % regular users 120,000 100% 100,000 80% 80,000 60,000 60% 40,000 40% 20,000 20% 0 0% Jan Feb Mar Apr May Jun Jul Aug Sept Oct Nov Dec Jan Feb Mar Apr May Jun Jul Aug Sept Oct Nov Dec Total Number of Custumers Expected Lifetime Value/Customers Current Fiscal Actual Current Fiscal Goal Current Fiscal Actual Current Fiscal Goal 58500 9200 57000 8800 55500 8400 54000 8000 52500 7600 51000 7200 49500 6800 48000 Jan Feb Mar Apr May Jun Jul Aug Sept Oct Nov Dec Jan Feb Mar Apr May Jun Jul Aug Sept Oct Nov Dec
  • 3. New Leads by Channel Opportunities in Pipeline ($) Webcast Registrations Contact Center Appointments Whitepaper Downloads Current Fiscal Actual Free Trial on Website Channel Partners Tradeshows $1,000,000 800 700 $800,000 600 $600,000 500 400 $400,000 300 200 $200,000 100 $0 0 Jan Feb Mar Apr May Jun Jul Aug Sep Oct Nov Dec Jan Feb Mar Apr May Jun Jul Aug Sept Oct Nov Dec # Contacts in Database Cost per lead ($) Current Fiscal Actual Current Fiscal Goal Current Fiscal Actual 25,000 $600 20,000 $500 $400 15,000 $300 10,000 $200 5,000 $100 $0 0 Jan Feb Mar Apr May Jun Jul Aug Sep Oct Nov Dec Jan Feb Mar Apr May Jun Jul Aug Sep Oct Nov Dec Landing Page Conversion Rate Email Campaign Click Through Rates Current Fiscal Actual 4% Winback Program Newsletter 3% Campaign 4 2% Campaign 3 Campaign 2 1% Campaign 1 0% 0% 1% 2% 3% 4% 5% 6% 7% 8% Jan Feb Mar Apr May Jun Jul Aug Sep Oct Nov Dec
  • 4. Social Network Reach Blog Posting/Tweets by Topic Twitter (Followers) Facebook (Fans) Blog (RSS Feed Subscribers) Company News New Products Thought Leadership Financial Industry Trends LinkedIn (Contacts) Myspace (Friends) 16 14 2500 12 2000 10 1500 8 6 1000 4 500 2 0 0 Jan Feb Mar Apr May Jun Jul Aug Sept Oct Nov Dec Jan Feb Mar Apr May Jun Jul Aug Sept Oct Nov Dec Referral Traffic (All Social Media Channels) Total Comments/Re-Tweets Current Fiscal Actual Current Fiscal Actual Current Fiscal Goal 25 6000 5000 20 4000 15 3000 10 2000 5 1000 0 0 Jan Feb Mar Apr May Jun Jul Aug Sep Oct Nov Dec Jan Feb Mar Apr May Jun Jul Aug Sep Oct Nov Dec Facebook Fans Twitter Followers Current Fiscal Actual Current Fiscal Goal Current Fiscal Actual Current Fiscal Goal 900 700 800 600 700 500 600 400 500 400 300 300 200 200 100 100 0 0 Jan Feb Mar Apr May Jun Jul Aug Sep Oct Nov Dec Jan Feb Mar Apr May Jun Jul Aug Sep Oct Nov Dec
  • 5. Traffic Sources Top Pages & Total Page Views Google Direct Yahoo Bing Ask Twitter Home Products Catalogue Company Governance 6000 8000 7000 5000 6000 4000 5000 3000 4000 3000 2000 2000 1000 1000 0 0 Jan Feb Mar Apr May Jun Jul Aug Sept Oct Nov Dec Jan Feb Mar Apr May Jun Jul Aug Sept Oct Nov Dec Unique Visitors Pages/Visit Current Fiscal Actual Current Fiscal Goal Current Fiscal Actual 25,000 5 20,000 4 15,000 3 10,000 2 5,000 1 0 0 Jan Feb Mar Apr May Jun Jul Aug Sep Oct Nov Dec Jan Feb Mar Apr May Jun Jul Aug Sep Oct Nov Dec Bounce Rate Time on Site (Minutes) Current Fiscal Actual Current Fiscal Goal Current Fiscal Actual Current Fiscal Goal 60% 3 50% 40% 2 30% 20% 1 10% 0% 0 Jan Feb Mar Apr May Jun Jul Aug Sep Oct Nov Dec Jan Feb Mar Apr May Jun Jul Aug Sep Oct Nov Dec
  • 6. Dashboard Data Input Marketing Program Metrics Q1 Q2 Q3 Q4 Total # Opportunities by Stage Jan Feb Mar Apr May Jun Jul Aug Sept Oct Nov Dec Prospecting 893 902 911 920 929 938 947 956 965 974 983 992 Qualification 783 789 795 801 807 813 819 825 831 837 843 849 Needs Analysis 284 293 302 311 320 329 338 347 356 365 374 383 Value Proposition 103 106 109 112 115 118 121 124 127 130 133 136 Proposal/Price Quote 59 63 67 71 75 79 83 87 91 95 99 103 Negotiation/Review 23 25 27 29 31 33 35 37 39 41 43 45 Total Collateral Created/Updated Jan Feb Mar Apr May Jun Jul Aug Sept Oct Nov Dec Current Fiscal Actual 3 2 2 1 4 5 4 3 4 5 6 4 Current Fiscal Goal 2 2 2 2 2 2 2 2 2 2 2 2 Webcast Series Jan Feb Mar Apr May Jun Jul Aug Sept Oct Nov Dec Webcast Attendees 13 18 24 15 28 35 67 46 58 63 41 69 Brand Impressions Jan Feb Mar Apr May Jun Jul Aug Sept Oct Nov Dec Total Impressions 78,495 80,394 93,040 96,049 104,950 123,144 103,940 104,059 130,455 129,405 149,856 129,450 Budget/Total Revenue Ratio (%) Jan Feb Mar Apr May Jun Jul Aug Sept Oct Nov Dec Current Fiscal Actual 4.2% 3.8% 5.3% 6.4% 7.0% 4.3% 3.4% 6.4% 4.5% 6.3% 5.3% 3.9% Current Fiscal Goal 6.0% 6.0% 6.0% 6.0% 6.0% 6.0% 6.0% 6.0% 6.0% 6.0% 6.0% 6.0% Total Leads by Event Type Jan Feb Mar Apr May Jun Jul Aug Sept Oct Nov Dec Event Type #1 - Online Webinars 62 35 26 29 39 45 49 54 67 54 68 52 Event Type #2 - Tradeshows 3 4 3 10 15 29 21 15 19 27 35 31 Event Type #3 - Industry Conference 3 3 2 6 7 8 9 5 3 20 26 34
  • 7. Customer Program Metrics Q1 Q2 Q3 Q4 Net New Customers Jan Feb Mar Apr May Jun Jul Aug Sept Oct Nov Dec Number of New Customers Acquired 62 67 65 69 71 72 74 76 78 80 82 84 Customer Retention Rate Jan Feb Mar Apr May Jun Jul Aug Sept Oct Nov Dec Current Fiscal Actual 78.0% 77.0% 79.0% 80.0% 76.0% 84.0% 89.0% 92.0% 85.0% 83.0% 89.0% 79.0% Current Fiscal Goal 85.0% 85.0% 85.0% 85.0% 85.0% 85.0% 85.0% 85.0% 85.0% 85.0% 85.0% 85.0% Database Size Jan Feb Mar Apr May Jun Jul Aug Sept Oct Nov Dec Total Records 50,394 55,304 60,214 54,590 57,607 60,624 89,504 92,044 94,584 97,124 99,664 102,204 CRM Adoption Rate Jan Feb Mar Apr May Jun Jul Aug Sept Oct Nov Dec % regular users 46.0% 49.0% 57.0% 65.0% 68.0% 68.0% 68.0% 72.0% 75.0% 85.0% 95.0% 97.0% Total Number of Customers Jan Feb Mar Apr May Jun Jul Aug Sept Oct Nov Dec Current Fiscal Actual 7,659 7,729 7,799 7,869 7,939 8,009 8,079 8,149 8,219 8,289 8,359 8,429 Current Fiscal Goal 7,750 7,850 7,950 8,050 8,150 8,250 8,350 8,450 8,550 8,650 8,750 8,850 Expected Lifetime Value/Customer Jan Feb Mar Apr May Jun Jul Aug Sept Oct Nov Dec Current Fiscal Actual $51,034 $51,034 $51,034 $51,034 $51,034 $56,839 $56,839 $56,839 $56,839 $56,839 $56,839 $56,839 Current Fiscal Goal $56,000 $56,000 $56,000 $56,000 $56,000 $56,000 $57,000 $57,000 $57,000 $57,000 $57,000 $57,000 Lead Generation Metrics Q1 Q2 Q3 Q4 New Leads by Channel Jan Feb Mar Apr May Jun Jul Aug Sept Oct Nov Dec Webcast Registrations 34 45 49 55 48 89 34 139 219 174 175 184 Contact Center Appointments 56 58 54 39 54 67 48 43 34 78 48 45 Whitepaper Downloads 31 34 37 40 43 46 49 52 55 58 61 64 Free Trial on Website 234 245 256 267 278 289 300 311 322 333 344 355 Channel Partners 23 43 47 50 53 56 59 62 65 68 71 74 Tradeshows 24 142 0 28 58 21 0 4 35 21 17 8
  • 8. Opportunities in Pipeline ($) Jan Feb Mar Apr May Jun Jul Aug Sep Oct Nov Dec Current Fiscal Actual $234,950 $395,064 $506,348 $495,064 $294,054 $495,064 $384,950 $395,006 $604,860 $785,965 $895,694 $785,960 Contacts in Database Jan Feb Mar Apr May Jun Jul Aug Sep Oct Nov Dec Current Fiscal Actual 12995 13203 13411 13619 13827 16043 16940 17837 18734 19631 20528 21425 Current Fiscal Goal 13000 13500 14000 14500 15000 15500 16000 16500 17000 17500 18000 17500 Cost Per Lead ($) Jan Feb Mar Apr May Jun Jul Aug Sep Oct Nov Dec Current Fiscal Actual $318 $375 $432 $489 $485 $323 $289 $483 $384 $328 $345 $343 Landing Page Conversion Rate Jan Feb Mar Apr May Jun Jul Aug Sep Oct Nov Dec Current Fiscal Actual 1.7% 1.9% 2.1% 2.3% 2.5% 2.7% 2.4% 2.4% 3.2% 3.6% 3.4% 3.3% Email Marketing Campaigns Click Through Rate Campaign 1 3.1% Campaign 2 3.6% Campaign 3 2.5% Campaign 4 2.0% Newsletter 5.3% Winback Program 7.3% Social Media Metrics Q1 Q2 Q3 Q4 Social Network Reach Jan Feb Mar Apr May Jun Jul Aug Sept Oct Nov Dec Twitter (Followers) 500 550 550 600 600 600 650 650 650 700 700 700 Facebook (Fans) 300 300 350 350 400 400 450 450 500 500 550 600 Blog (RSS Feed Subscribers) 100 125 125 150 145 175 164 200 210 200 209 245 LinkedIn (Contacts) 50 60 65 60 75 100 89 110 125 124 132 150 Myspace (Friends) 200 210 220 215 220 210 230 240 235 245 250 254 Blog Postings/Tweets by Topic Jan Feb Mar Apr May Jun Jul Aug Sept Oct Nov Dec
  • 9. Company News 2 1 1 2 1 2 3 1 2 1 1 3 New Products 2 3 2 3 2 1 2 3 2 4 2 4 Thought Leadership 4 6 5 6 7 5 4 3 5 6 5 3 Financial 1 1 1 1 1 1 1 1 1 1 1 1 Industry Trends 2 2 2 2 2 2 2 2 2 2 2 2 Referral Traffic (All Social Channels) Jan Feb Mar Apr May Jun Jul Aug Sep Oct Nov Dec Current Fiscal Actual 2500 2675 2700 3100 3097 3078 4201 4305 4650 4789 4970 5389 Current Fiscal Goal 3000 3000 3500 3500 4000 4000 4500 4500 5000 5000 5500 5500 Total Comments/Re-Tweets Jan Feb Mar Apr May Jun Jul Aug Sep Oct Nov Dec Current Fiscal Actual 10 6 15 9 11 6 7 9 17 14 21 12 New Facebook Fans Jan Feb Mar Apr May Jun Jul Aug Sep Oct Nov Dec Current Fiscal Actual 300 300 350 350 400 400 450 450 500 500 550 600 Current Fiscal Goal 400 400 400 400 450 450 500 500 600 600 600 600 New Twitter Followers Jan Feb Mar Apr May Jun Jul Aug Sep Oct Nov Dec Current Fiscal Actual 500 550 550 600 600 600 650 650 650 700 700 700 Current Fiscal Goal 550 550 550 600 650 650 700 700 700 800 800 800 Website Metrics Q1 Q2 Q3 Q4 Traffic Sources Jan Feb Mar Apr May Jun Jul Aug Sept Oct Nov Dec Google 3404 3483 3562 3641 3720 3799 3878 3957 4036 4115 4194 4273 Direct 294 302 310 318 326 334 342 350 358 366 374 382 Yahoo 234 245 256 267 278 289 300 311 322 333 344 355 Bing 139 145 151 157 163 169 175 181 187 193 199 205 Ask 31 34 37 40 43 46 49 52 55 58 61 64 Twitter 24 29 34 39 44 49 54 59 64 69 74 79
  • 10. Top Pages Jan Feb Mar Apr May Jun Jul Aug Sept Oct Nov Dec Home 2030 2100 2170 2240 2310 2380 2450 2520 2590 2660 2730 2800 Products 1195 1239 1283 1327 1371 1415 1459 1503 1547 1591 1635 1679 Catalogue 693 724 755 786 817 848 879 910 941 972 1003 1034 Company 280 340 400 460 520 580 640 700 760 820 880 940 Governance 181 193 205 217 229 241 253 265 277 289 301 313 Unique Visitors Jan Feb Mar Apr May Jun Jul Aug Sep Oct Nov Dec Current Fiscal Actual 12995 13203 13411 13619 13827 17856 18496 19400 18734 19631 20528 21425 Current Fiscal Goal 15000 15000 15000 15000 15000 15000 15000 17500 17500 17500 17500 17500 Pages/Visit Jan Feb Mar Apr May Jun Jul Aug Sep Oct Nov Dec Current Fiscal Actual 3.3 3.4 3.3 3.6 3.2 3.6 3.3 3.5 3.4 3.9 3.8 3.5 Bounce Rate Jan Feb Mar Apr May Jun Jul Aug Sep Oct Nov Dec Current Fiscal Actual 41.0% 39.0% 40.2% 46.0% 47.0% 39.0% 51.0% 48.0% 39.0% 51.0% 49.0% 48.0% Current Fiscal Goal 40.0% 40.0% 40.0% 40.0% 40.0% 40.0% 40.0% 40.0% 40.0% 40.0% 40.0% 40.0% Time on Site (Minutes) Jan Feb Mar Apr May Jun Jul Aug Sep Oct Nov Dec Current Fiscal Actual 1.5 1.6 1.6 1.7 1.7 1.8 1.8 1.9 1.9 2.0 2.0 2.1 Current Fiscal Goal 2.0 2.0 2.0 2.0 2.0 2.0 2.0 2.0 2.0 2.0 2.0 2.0