India Pharmaceutical 2015 A McKinsey report
•
3 likes•2,363 views

Key statistics about the projected growth of Indian Phramaceutical industry
Recommended

Recommended
More Related Content
What's hot
What's hot (20)
Viewers also liked
Viewers also liked (15)
Similar to India Pharmaceutical 2015 A McKinsey report
Similar to India Pharmaceutical 2015 A McKinsey report (20)
More from Devansh Doshi
More from Devansh Doshi (20)
India Pharmaceutical 2015 A McKinsey report
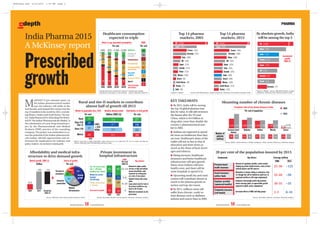
- 1. M cKINSEY’S just released report on the Indian pharmaceutical market says the industry will treble in the nextdecade,andcatapultthecountryintothe top 10 markets in the world by 2015, overtak- ing Mexico,Turkey and South Korea.The rep- ort,‘IndiaPharma2015:UnlockingThePoten- tial Of The Indian Pharmaceuticals Market’, is the culmination of a year-long research pro- ject by the Pharmaceuticals and Medical Products (PMP) practice of the consulting company.The project was undertaken to as- sess the potential of the Indian pharmaceuti- cals market, identify opportunities and un- derstand the implications for industry and policymakers.Anexclusivesneakpeek. BUSINESSWORLD 58 3 SEPTEMBER 2007 BUSINESSWORLD 59 3 SEPTEMBER 2007 KEY TAKEAWAYS G By 2015, India will be among the top 10 global pharma mar- kets by value. It will add revenues the fastest after the US and China, which is $14 billion in drug sales, more than double the country's pharmaceutical mar- ket in 2005. G Indians are expected to spend far more on healthcare than they are now. Healthcare’s share of the wallet will rise as fast as that of education and three times as much as the share of food, bever- ages and tobacco. G Rising incomes, healthcare insurance and better healthcare infrastructure will spur growth. Many more Indians will have health cover, and there will be more hospitals to spend it in. G Upcoming small city and rural centres will contribute almost as much to the pharma growth as metros and top-tier towns. G By 2015, millions more will suffer from chronic, costly-to- treat diseases such as diabetes, asthma and cancer than in 2005. PHARMAindepth Top 14 pharma markets, 2015 Top 14 pharma markets, 2005 US (248) Japan (68) France (32) Germany (31) Italy (20) UK (19) Spain (14) Canada (13) China (13) Mexico (10) Brazil (9) South Korea (8) Turkey (7) India (6) Figures in $billion Source: IMS World Review, analyst projections, McKinsey India Pharma demand model US (444) Japan (82) France (46) Germany (38) China (38) UK (32) Spain (25) Italy (25) Canada (25) India (20) Brazil (20) Mexico (19) South Korea (15) Turkey (15) Rural and tier-II markets to contribute almost half of growth till 2015 Mounting number of chronic diseases 20 per cent of the population insured by 2015 Premium-based health insurance Components Key drivers Coverage (million) Removal of regulatory hurdles; active market shaping by private health insurers; entry of inter- national players and life insurers Relaxation in income ceiling or enterprise crite- ria (though this will be limited by small size of organised workforce with wage employment) Employers increasingly preferring premium- based coverage plans; no appreciable growth expected in public sector employment Increased efforts of NGO/self-help groups 2006 2015 25-30 35-40 30-35 2-3 ~125 ~50 ~35 8-10 Social insurance/ welfare funds Employer provided (sponsored benefits) Community insurance (self-funded) Affordability and medical infra- structure to drive demand growth Private investment in hospital infrastructure Source: McKinsey India Pharmaceutical demand model Metros: more than 1 million population, Class I towns: 0.1-1 mn, Class II-IV: 5k- 0.1 mn, Rural: less than 5k Source: McKinsey India Pharmaceutical demand model Source: NCMH, Central Bureau of Health Intelligence, WHO, Decision Resources, McKinsey analysis Source: Secondary research annual reports; interviews; McKinsey analysis Source: Secondary research, interviews, McKinsey analysis 2005 6.3 ~20 ~14 2015 2005 34 26 12-14 5-6 9-10 ~2 14 26 19 30 11 40 2015 Growth bet 2005-15 Increase in prevalence Income growth Others Insurance penetration Medical infrastructure Market growth, 2005-15 $billion Market by geographic tiers, 2015 Per cent Rural Class II-IV (Tier 2) Class I/IA Metros Prevalence rates of key chronic diseases in India Per cent of population 2015 2005 Coronary heart disease Diabetes Asthma Obesity Cancer Number of patients (million) 36 62 31 46 27 34 14 34 2.0 2.5 Absolute demand growth $billion (2005-15) Contribution to total growth Per cent Key drivers CAGR Per cent 2005-15 Source of growth Top- tier private hospi- tals (>100 beds, including corp. chains) Medium-tier private hospitals (30-100 beds) Private nursing homes (<30 beds) Government hospitals Demand for higher quality services in high and medium income households; rapid expansion by existing play- ers; entry of new players Segment losing value propo- sition Large unmet need for beds in the primary healthcare seg- ment in tier-II towns Moderate investments by the government Per cent 2015 29 27 20 24 3.6 27 18 25 30 2.7 3.2 4.1 3.31 4.91 2.80 3.70 2.50 2.70 1.30 2.70 0.18 0.20 By absolute growth,India will be among the top 5 Figures in $billion Source: IMS World Review, analyst projections, McKinsey India Pharma demand model US (196) China (23) India (14) France (14) Japan (14) UK (13) Canada (12) Brazil (11) Germany (7) Figures have been rounded off; Figures in brackets are average household consumption in Rs thousand Source: McKinsey report 07 Healthcare consumption expected to triple 1995 2005E 2015F 2025F Share of avg. household consumption Per cent CAGR Per cent Healthcare Education & recreation Communication Transportation Personal products and services Household products Housing & utilities Apparel Food, beverages and tobacco 9(60) 56 14 5 11 4 3 1 4 2 17 8 7 5 2 19 9 20 11 9 6 6 9 13 12 12 10 42 34 25 (82) (140) (248) 9 12 7 8 5 5 5 3 3 6 5 3 3 3 5 20 40 15 10 15 Incremental growth 2005-15 India Pharma 2015 A McKinsey report Prescribed growth 100% =$20 billion McKinsey.qxd 8/23/2007 1:50 AM Page 2