Dr Dev Kambhampati | USDA- World Agricultural Production (July 2014)
•
1 like•1,020 views

The document summarizes wheat production prospects in several countries. Kazakhstan wheat production is forecast to decrease to 13.5 million tons due to dry weather reducing yields. Australia wheat production is forecast to increase to 26 million tons. EU wheat production is forecast to increase to 147.9 million tons, lifted by higher production in Germany despite drought in Spain. Canada wheat production is forecast to decrease to 28 million tons due to lower planted area.

Recommended
Recommended
More Related Content
What's hot
What's hot (20)
Similar to Dr Dev Kambhampati | USDA- World Agricultural Production (July 2014)
Similar to Dr Dev Kambhampati | USDA- World Agricultural Production (July 2014) (20)
More from Dr Dev Kambhampati
More from Dr Dev Kambhampati (20)
Recently uploaded
Recently uploaded (20)
Dr Dev Kambhampati | USDA- World Agricultural Production (July 2014)
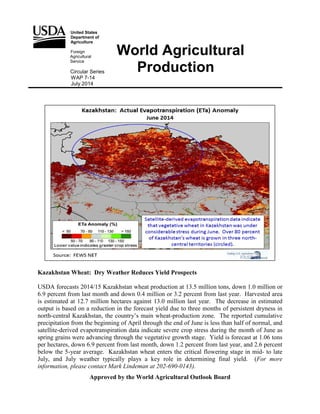
- 1. United States Department of Agriculture Foreign Agricultural Service Circular Series WAP 7-14 July 2014 Kazakhstan Wheat: Dry Weather Reduces Yield Prospects USDA forecasts 2014/15 Kazakhstan wheat production at 13.5 million tons, down 1.0 million or 6.9 percent from last month and down 0.4 million or 3.2 percent from last year. Harvested area is estimated at 12.7 million hectares against 13.0 million last year. The decrease in estimated output is based on a reduction in the forecast yield due to three months of persistent dryness in north-central Kazakhstan, the country’s main wheat-production zone. The reported cumulative precipitation from the beginning of April through the end of June is less than half of normal, and satellite-derived evapotranspiration data indicate severe crop stress during the month of June as spring grains were advancing through the vegetative growth stage. Yield is forecast at 1.06 tons per hectares, down 6.9 percent from last month, down 1.2 percent from last year, and 2.6 percent below the 5-year average. Kazakhstan wheat enters the critical flowering stage in mid- to late July, and July weather typically plays a key role in determining final yield. (For more information, please contact Mark Lindeman at 202-690-0143). World Agricultural Production Approved by the World Agricultural Outlook Board
- 2. Australia Wheat: Production Forecast Revised Up USDA forecasts the 2014/15 Australia wheat production at 26 million tons, up 0.5 million or 2.0 percent from last month, but down 1.0 million or 3.8 percent from last year. The area forecast is 13.8 million hectares, up 0.2 million or 1.5 percent from last month and up 0.3 million or 2.1 percent from last year. A favorable start to the season in most areas allowed sowing operations to be completed by June. The planted area increase is largely due to expectations of better gross margins as compared to other winter crops. Growing conditions for Australia’s 2014/15 wheat crop are favorable across most regions of the cropping zone. Continued normal rainfall during the growing season will be critical to achieving the forecast yield potential, particularly in those areas where soil moisture levels are presently low such as in Queensland. (For more information, please contact Jim Crutchfield at 202-690-0135). EU Wheat: German Production Lifts EU Crop, Despite Drought in Spain USDA estimates the 2014/15 European Union (EU) wheat crop at 147.9 million tons, up 1.6 million or 1.1 percent from last month and up 4.6 million or 3.2 percent from last year. Harvested area is estimated at 26.6 million hectares, up 0.1 million from last month and 0.8 million hectares or 3.2 percent above last year’s harvested area. Yield is estimated at 5.57 tons per hectare (MT/Ha), above last month’s 5.52 MT/Ha, but below last year’s 5.57 MT/Ha. The 5- year average yield is 5.34 MT/Ha. Mostly favorable weather during June in central Europe further improved prospects for a near- record EU wheat harvest. Prior concerns about winter and spring dryness in central Europe were alleviated by well-timed rain. Essential rainfall occurred at critical early development periods, followed by heavier rains during grain fill in May and June. June crop travel in Germany and Hungary by FAS staff confirmed the good condition of the wheat crop. As a result of beneficial weather, estimated production in the EU’s second largest producer, Germany, was raised 1.3 million tons. Additionally, relatively large changes were made to Czech Republic, Hungary, and Sweden – each up 0.3 million tons from the previous month. 2 July 2014 Foreign Agricultural Service/USDA Office of Global Analysis
- 3. The now harvested wheat crop in Spain experienced a sudden and early end to its rainy season, prior to the end of its growing season. Unfavorably dry conditions in Spain have led to a 0.6- million-ton reduction in estimated production. Meanwhile in the Balkan Peninsula, heavy rains and flooding reduced crop potential in the export countries of Romania and Bulgaria, likely damaging wheat and lowering quality to feed standards. (For more information, please contact Bryan Purcell at 202-690-0138). Canada Wheat: 2014/15 Area Harvested Down from 2013/14 USDA estimates 2014/15 Canada wheat production at 28.0 million tons, down 25 percent from last year record level and down 1.8 percent from last month. Area is estimated at 9.6 million hectares, down 8.0 percent from last year and down 2.0 percent from the previous month. Yield is forecast at 2.92 tons per hectare, down 19 percent from last year’s record but essentially unchanged from the previous month. Statistics Canada’s June Principal Field Crop Area report estimated wheat seeded area at 24.5 million acres or 9.9 million hectares, down nearly 2 percent from its previous report and down 7.4 percent from last year. Farmers seeded less wheat in 2014 from the previous year due to winter transportation and delivery problems, which resulted in significantly high carry-over stocks. Area seeded is forecast to return close to the 5-year average. All three major producers (Saskatchewan, Alberta, and Manitoba) reported roughly a 7.5 percent decrease in area seeded. Farmers were unable to fulfill their March planting intentions because of wet, cool weather that hampered fieldwork in Eastern Saskatchewan and Western Manitoba. Alberta, however, was able to fulfill its planting intentions because of nearly ideal planting conditions. Cool, wet weather is still impeding crop development across the Western Prairies. Despite these conditions, Saskatchewan and Alberta reported in early July that roughly 80 percent of the wheat is in good to excellent condition. (For more information, please contact Arnella Trent 202-720-0881). 3 July 2014 Foreign Agricultural Service/USDA Office of Global Analysis
- 4. Vietnam Rice: 2014/15 Production Forecast Higher USDA forecasts total milled rice production in Vietnam in 2014/15 at 28.2 million tons, up 0.4 million or 1.4 percent from last month and up 0.7 percent from last year. Harvested area is forecast at 7.8 million hectares, unchanged from both last month and last year. Yield is estimated at a record 5.80 tons per hectare, up nearly 1 percent from last year. Statistics from Vietnam’s Ministry of Agriculture and Rural Development (MARD) indicate that 2013/14 rice production was higher than previously expected, resulting in an upward revision of approximately 200,000 tons (milled basis). These historical seasonal estimates indicated that farmers achieved higher than expected yields for the spring crop, which is the largest of the three annual rice crops. The spring crop typically accounts for approximately 46 percent of total production, followed by the autumn crop at 35 percent and the winter crop at 19 percent. The new seasonal estimates altered the outlook for potential yields in 2014/15, as Vietnam has been able to achieve steady trend yield growth on an annual basis for the past 20 years. (For more information, please contact Michael Shean at 202-720-7366). Australia Cotton: Low Reservoir Levels Likely to Reduce Irrigated Area USDA forecasts the 2014/15 Australia cotton crop at 2.7 million bales, down 0.4 million or 13 percent from last month. Harvested area is forecast at 0.30 million hectares, down 0.02 million or 6.3 percent from last month. Yield is forecast at 1,960 kilograms per hectare, marginally below the 5-year average of 1,990 kilograms. Lower planted area is anticipated as a result of reduced irrigation availability at sowing, which will commence in September. Irrigated cotton area accounts for about 90 percent of Australia’s total cotton output. Dryland cotton planting tends to be more opportunistic and depends on the seasonal weather forecast, and conditions and prices at sowing. Irrigated cotton yields are substantially higher than dryland yields and the difference widens in low rainfall years. It is expected that reservoir levels will remain below 2013 levels thereby severely constraining the irrigated cotton area for the 2014 crop. Current reservoir levels are 40 to 70 percent below last year’s levels. Assuming normal rainfall and recharge from now until sowing, the available irrigation supply will be lower than in 2013. (For more information, please contact James Crutchfield at 202-690-0135). India Cotton: Poor Monsoon Rainfall Distribution Lowers Prospects for 2014/15 USDA has revised the forecast for the 2014/15 India cotton production to 28 million bales (480- pound bales), down 0.5 million bales from last month. The revision is primarily based on reports of significant delays in planting due to the late start and generally poor distribution of the 2014 monsoon rainfall across the country. Cotton sown area is forecast at 11.8 million hectares. Yield 4 July 2014 Foreign Agricultural Service/USDA Office of Global Analysis
- 5. is forecast at 517 kilograms per hectare (kg/Ha), down 1.7 percent from last month. In the past five years India’s cotton area and yields have averaged 11.5 million hectares and 530 kg/Ha. According to the Government of India’s Meteorological Department, the advance of the 2014 southwest monsoon into the major cotton growing areas of north central and northwestern India is now delayed by more than two weeks. Overall, at the end of June, the monsoon rainfall was 93 percent of normal across India. Regional estimates indicate that the monsoon is at 85 percent of normal in northwest India, 94 percent in central India, 93 percent in Southern Peninsula, and 99 percent in north east India. Generally, the Indian monsoon is classified as normal at 95 to 105 percent of the long-term- average (LTA). Below normal is defined at 90-95 percent of LTA and drought as less than 90 percent of LTA. The late start, somewhat erratic beginning and poor distribution of the monsoon rainfall is generally resulting in delayed planting of almost all kharif (monsoon) season crops including cotton. However, it is still too early to make objective and reliable seasonal planting predictions because the window of opportunity for cotton planting extends through July. The mid-July planting progress data and observations will be critical in estimating the 2014 cotton area planted. (For more information, please contact Dath Mita, PhD, at 202-720-7339). Spain Barley: Drought-Related Impacts Reduce Production USDA estimates barley production in Spain at 7.0 million tons, down 1.2 million or 15 percent from last month, and down 3.1 million or 30 percent from last year. Area is estimated at 2.8 million hectares, practically unchanged from both last month and last year. Yield is estimated at 2.54 tons per hectare (MT/Ha) compared to 2.96 MT/Ha last month and the 2.83 MT/Ha 5-year average. Spain is typically the EU’s third largest barley producer after France and Germany. Its crop is rainfed and therefore dependent on seasonal rainfall. Significant dryness occurred during April and May, however, with crops receiving only half their normal spring rainfall totals. High temperatures further diminished soil moisture, stressing plants during critical development months, resulting in yield loss. 5 July 2014 Foreign Agricultural Service/USDA Office of Global Analysis
- 6. Improved conditions in many central and east European countries such as Germany, Romania, Hungary and Lithuania offset Spain’s negative influence on barley production in the European Union (EU). Overall estimated production for 2014/15 EU barley remains unchanged from last month at 55.9 million tons, which is 3.7 million tons or 6.3 percent below last year’s harvest. (For more information, please contact Bryan Purcell at 202-690-0138.) China Corn: Record Crop Forecast in 2014/15 USDA forecasts China’s 2014/15 corn crop at a record 222.0 million tons, up 2 million or 0.9 percent from last month and up 3.5 million or 1.6 percent from last year’s revised output of 218.5 million tons. Area is estimated at 36.8 million hectares, up 0.8 percent from last month and 1.3 percent from last year’s record area of 36.3 million. Revisions to the 2013/14 area and production estimates this month were based on data published in China’s 2014 Statistical Abstract. Corn area has increased by more than 10 million hectares in the past decade, while planted area for rice and wheat has risen slightly. Most of the growth in corn area took place in Northeast China, where new farmland was developed and soybean and spring wheat acreage was converted to more-profitable corn. Corn area has also increased on the North China Plain, often at the expense of cotton area. Yield, forecast at 6.03 tons per hectare, is unchanged from last month and essentially equal to last year’s record yield. The spring-sown crop in Northeast China is now in the reproductive stage, while the summer-sown crop on the North China Plain will enter the reproductive stage in August. Weather and soil moisture conditions are currently close to normal, and no major flooding, droughts or pest/disease problems have occurred so far this season. (For more information, contact Paulette Sandene at 202-690-0133). 6 July 2014 Foreign Agricultural Service/USDA Office of Global Analysis
- 7. World Agricultural Production U.S. Department of Agriculture Foreign Agricultural Service / Office of Global Analysis International Production Assessment Division (IPAD / PECAD) Ag Box 1051, Room 4630, South Building Washington, DC 20250-1051 http://www.pecad.fas.usda.gov/ Telephone: (202) 720-1157 Fax: (202) 720-1158 This report uses information from the Foreign Agricultural Service’s (FAS) global network of agricultural attachés and counselors, official statistics of foreign governments and other foreign source materials, and the analysis of economic data and satellite imagery. Estimates of foreign area, yield, and production are from the International Production Assessment Division, FAS, and are reviewed by USDA’s Inter-Agency Commodity Estimates Committee. Estimates of U.S. area, yield, and production are from USDA’s National Agricultural Statistics Service. Numbers within the report may not add to totals because of rounding. This report reflects official USDA estimates released in the World Agricultural Supply and Demand Estimates (WASDE-531), July 11, 2014. Printed copies are available from the National Technical Information Service. Download an order form at http://www.ntis.gov/products/specialty/usda/fas_a-g.asp, or call NTIS at 1-800-363-2068. The FAS International Production Assessment Division prepared this report. The next issue of World Agricultural Production will be released after 12:00 p.m. Eastern Time, August 12, 2014. Conversion Table Metric tons to bushels Wheat, soybeans = MT * 36.7437 Corn, sorghum, rye = MT * 39.36825 Barley = MT * 45.929625 Oats = MT * 68.894438 Metric tons to 480-lb bales Cotton = MT * 4.592917 Metric tons to hundredweight Rice = MT * 22.04622 Area & weight 1 hectare = 2.471044 acres 1 kilogram = 2.204622 pounds 7 July 2014 Foreign Agricultural Service/USDA Office of Global Analysis
- 8. For further information, contact: U.S. Department of Agriculture Foreign Agricultural Service Office of Global Analysis International Production Assessment Division Ag Box 1051, Room 4630, South Building Washington, DC 20250-1051 Telephone: (202) 720-1157 Fax: (202) 720-1158 GENERAL INFORMATION Director Derrick Williams III 202-690-0131 derrick.williams@fas.usda.gov Deputy Director Paul Provance 202-720-2974 paul.provance@fas.usda.gov USDA Remote Sensing Advisor Glenn Bethel 202-720-1280 glenn.bethel@fas.usda.gov Sr. Analyst/Technical Lead Curt Reynolds, PhD 202-690-0134 curt.reynolds@fas.usda.gov Sr. Analyst/Satellite Imagery Dath Mita, PhD 202-720-7339 mita.dath@fas.usda.gov Archives Manager/Technical Lead Sr. Analyst/ Global Special Jim Crutchfield 202-690-0135 james.crutchfield@fas.usda.gov Projects Manager/Technical Lead Sr. Analyst/Technical Lead Robert Tetrault 202-720-1071 robert.tetrault@fas.usda.gov GIS Analyst/WAP Coordinator Justin Jenkins 202-720-0419 justin.jenkins@fas.usda.gov Program Analyst Mary Jackson 202-720-0886 mary.jackson@fas.usda.gov Management Analyst Rishan Chaudhry 202-720-1157 rishan.chaudhry@fas.usda.gov Administrative Assistant/COTR Terri Lagarde 202-720-1157 terri.lagarde@fas.usda.gov COUNTRY- AND REGION-SPECIFIC INFORMATION South América, Argentina and Colombia Denise McWilliams, PhD 202-720-0107 denise.mcwilliams@fas.usda.gov Western and Central Europe, Bryan Purcell 202-690-0138 bryan.purcell@fas.usda.gov and North Africa Russia, Kazakhstan, Ukraine, Mark Lindeman 202-690-0143 mark.lindeman@fas.usda.gov and other FSU-12 countries Canada, Caribbean, Sri Lanka, Arnella Trent 202-720-0881 arnella.trent@fas.usda.gov and Bangladesh East Asia, China, and Japan Paulette Sandene 202-690-0133 paulette.sandene@fas.usda.gov India, Pakistan, and Nepal Dath Mita, PhD 202-720-7339 mita.dath@fas.usda.gov Sub-Saharan Africa, Mexico, Curt Reynolds, PhD 202-690-0134 curt.reynoldsc@fas.usda.gov Nigeria and South Africa S.E. Asia, Indonesia, Thailand, Malaysia, Michael Shean 202-720-7366 michael.shean@fas.usda.gov Cambodia, and Vietnam Brazil, Venezuela, Central America, Robert Tetrault 202-720-1071 robert.tetrault@fas.usda.gov Australia, New Zealand, Jim Crutchfield 202-690-0135 james.crutchfield@fas.usda.gov Papua New Guinea, and South Pacific Islands Middle East, Afghanistan, Iraq, Bill Baker, PhD 202-260-8109 bill.baker@fas.usda.gov Iran, Syria Western United States Justin Jenkins 202-720-0419 justin.jenkins@fas.usda.gov Eastern United States Paul Provance 202-720-2974 paul.provance@fas.usda.gov Crop Analyst Vacant July 2014 Foreign Agricultural Service/USDA Office of Global Analysis
- 9. The Foreign Agricultural Service (FAS) updates its production, supply and distribution (PSD) database for cotton, oilseeds, and grains at 12:00 p.m. on the day the World Agricultural Supply and Demand Estimates (WASDE) report is released. This circular is released by 12:15 p.m. FAS Reports and Databases: Current World Market and Trade and World Agricultural Production Reports: http://apps.fas.usda.gov/psdonline/psdDataPublications.aspx Archives World Market and Trade and World Agricultural Production Reports: http://usda.mannlib.cornell.edu/MannUsda/viewTaxonomy.do?taxonomyID=7 Production, Supply and Distribution Database (PSD Online): http://apps.fas.usda.gov/psdonline/psdHome.aspx Global Agricultural Trade System (U.S. Exports and Imports): http://apps.fas.usda.gov/gats/default.aspx Export Sales Report: http://apps.fas.usda.gov/esrquery/ Global Agricultural Information Network (Agricultural Attaché Reports): http://gain.fas.usda.gov/Pages/Default.aspx Other USDA Reports: World Agricultural Supply and Demand Estimates (WASDE): http://www.usda.gov/oce/commodity/wasde/ Economic Research Service: http://www.ers.usda.gov/topics/crops National Agricultural Statistics Service: http://www.nass.usda.gov/Publications/ July 2014 Foreign Agricultural Service/USDA Office of Global Analysis
- 10. Million Metric Tons Table 01 World Crop Production Summary World - Total Foreign North America North America North America Europea n Union - Former Soviet Former Soviet Asia (WAP) Asia (WAP) Asia (WAP) Asia (WAP) Asia (WAP) South America South America Selected Other Selected Other Selected Other All Others none - none - United States Mexico - Canada - none - Russia - Ukraine - China - India - Indo- nesia Paki- stan Thai- land Argen- tina Brazil - South Africa Turkey - none - Aus- tralia Commodity ---Million metric tons--- Wheat 2012/13 85.215.51.922.94.49.3nr23.3nr94.9121.015.837.7133.83.227.261.7596.0657.7 2013/14 prel. 95.618.01.827.05.310.5nr24.0nr93.5121.922.352.1143.33.437.558.0656.2714.2 2014/15 proj. Jun 92.015.01.825.56.012.5nr24.5nr95.9124.020.053.0146.33.928.552.8648.8701.6 Jul 91.315.01.826.06.312.5nr24.5nr95.9124.021.053.0147.93.928.054.2651.0705.2 Coarse Grains 2012/13 167.510.612.911.484.337.24.75.68.539.9212.229.528.7146.128.924.4286.0852.41,138.4 2013/14 prel. 170.513.115.112.481.133.55.05.69.142.7225.139.935.7158.329.828.7369.4905.61,275.1 2014/15 proj. Jun 174.79.614.011.877.135.25.05.69.241.7226.635.338.0153.130.123.1368.6890.11,258.7 Jul 175.09.614.011.877.135.25.05.69.241.7228.636.138.5154.030.121.8367.9893.31,261.2 Rice, Milled 2012/13 141.20.5nr0.88.01.020.25.836.6105.2143.00.10.72.10.1nr6.3465.3471.7 2013/14 prel. 144.90.5nr0.68.51.020.56.637.4106.3142.30.10.61.90.1nr6.1471.3477.5 2014/15 proj. Jun 145.50.5nr0.78.51.020.56.737.7106.0144.00.10.72.00.1nr6.8473.9480.7 Jul 145.90.5nr0.68.51.020.56.737.7104.0144.00.10.72.00.1nr7.2472.2479.4 Total Grains 2012/13 393.826.614.735.196.747.624.934.745.1240.1476.245.467.1282.032.251.6354.01,913.72,267.7 2013/14 prel. 411.031.616.940.094.945.025.536.246.5242.5489.362.388.4303.633.366.2433.52,033.22,466.7 2014/15 proj. Jun 412.225.115.838.091.648.725.536.846.9243.6494.655.491.7301.334.151.6428.22,012.82,441.0 Jul 412.225.115.838.391.948.725.536.846.9241.6496.657.292.2303.934.149.8429.32,016.52,445.8 Oilseeds 2012/13 48.92.21.45.784.853.70.65.110.836.859.912.610.928.10.919.093.1381.5474.6 2013/14 prel. 48.52.41.85.291.157.70.65.111.538.358.616.713.631.60.923.397.1406.8503.9 2014/15 proj. Jun 48.62.31.94.294.458.50.65.012.138.757.815.214.032.11.021.6108.1407.9516.0 Jul 48.82.31.94.494.658.50.65.012.137.857.815.514.432.31.021.9113.1408.8521.9 Cotton 2012/13 16.32.70.04.66.00.80.09.30.028.535.0nrnr1.51.0nr17.3105.6123.0 2013/14 prel. 15.42.30.04.17.81.20.09.50.030.532.0nrnr1.60.9nr12.9105.4118.3 2014/15 proj. Jun 15.12.90.13.18.31.20.09.50.028.529.5nrnr1.71.1nr15.0100.9115.9 Jul 15.22.90.12.78.01.20.09.50.028.029.5nrnr1.71.1nr16.599.9116.4 1/ Includes wheat, coarse grains, and rice (milled) shown above. July 2014 Foreign Agricultural Service/USDA Office of Global Analysis
- 11. Table 02 Wheat Area, Yield, and Production From last month From last year MMTPercent Yield (Metric tons per hectare) Jul 2012/13 MMT Country / Region Area (Million hectares) Production (Million metric tons) Change in Production 2012/13 Prel. 2013/14 Jun Jun Prel. 2013/14 Jul Prel. 2013/14 Jun Jul Percent 2014/15 Proj.2014/15 Proj. 2014/15 Proj. 2012/13 216.23World -1.26-9.030.513.55705.17220.43 222.59 222.90 3.04 3.24 3.15 3.16 657.70 714.20 701.62 19.80United States -6.48-3.762.571.3654.2118.27 18.59 18.71 3.12 3.17 2.84 2.90 61.67 57.96 52.85 196.43Total Foreign -0.80-5.270.342.20650.97202.15 204.00 204.19 3.03 3.25 3.18 3.19 596.03 656.24 648.77 none 24.27China 1.702.070.000.00124.0024.12 24.20 24.20 4.99 5.06 5.12 5.12 121.02 121.93 124.00 South Asia 29.86India 2.502.340.000.0095.8530.00 30.60 30.60 3.18 3.12 3.13 3.13 94.88 93.51 95.85 8.66Pakistan 2.080.500.000.0024.508.64 8.83 8.83 2.69 2.78 2.77 2.77 23.30 24.00 24.50 2.51Afghanistan 0.500.030.000.005.032.55 2.56 2.56 2.01 1.96 1.96 1.96 5.05 5.00 5.03 Former Soviet Union - 12 21.30Russia 1.750.910.000.0053.0023.40 23.75 23.75 1.77 2.23 2.23 2.23 37.72 52.09 53.00 5.63Ukraine -5.74-1.285.001.0021.006.57 6.30 6.30 2.80 3.39 3.17 3.33 15.76 22.28 20.00 12.40Kazakhstan -3.16-0.44-6.90-1.0013.5012.95 12.70 12.70 0.79 1.08 1.14 1.06 9.84 13.94 14.50 1.40Uzbekistan 0.000.000.000.006.801.40 1.40 1.40 4.79 4.86 4.86 4.86 6.70 6.80 6.80 25.94European Union - 28 3.184.551.111.63147.8825.75 26.48 26.57 5.16 5.57 5.52 5.57 133.85 143.32 146.25 5.30France -0.02-0.010.000.0038.505.32 5.31 5.31 7.15 7.24 7.26 7.26 37.89 38.51 38.50 3.06Germany 2.700.675.351.3025.603.13 3.20 3.22 7.33 7.98 7.59 7.95 22.41 24.93 24.30 1.99United Kingdom 28.343.380.990.1515.301.63 1.95 1.98 6.66 7.33 7.77 7.75 13.26 11.92 15.15 2.08Poland 1.050.100.000.009.602.14 2.20 2.20 4.14 4.45 4.36 4.36 8.61 9.50 9.60 2.17Spain -18.40-1.40-8.82-0.606.202.12 2.14 2.15 2.35 3.58 3.18 2.89 5.09 7.60 6.80 1.87Italy -0.54-0.040.000.007.401.86 1.85 1.85 4.09 4.00 4.01 4.01 7.63 7.44 7.40 0.62Denmark 21.950.910.000.005.050.57 0.70 0.70 7.42 7.29 7.27 7.27 4.56 4.14 5.05 1.06Hungary -4.76-0.246.670.304.801.09 1.10 1.10 3.74 4.62 4.09 4.36 3.97 5.04 4.50 1.99Romania -1.33-0.10-2.63-0.207.402.10 2.08 2.08 2.66 3.57 3.65 3.57 5.30 7.50 7.60 1.19Bulgaria -2.04-0.10-2.04-0.104.801.19 1.18 1.17 3.76 4.12 4.15 4.10 4.46 4.90 4.90 9.50Canada -25.33-9.50-1.75-0.5028.0010.44 9.80 9.60 2.86 3.59 2.91 2.92 27.21 37.50 28.50 12.98Australia -3.75-1.011.960.5026.0013.51 13.60 13.80 1.76 2.00 1.88 1.88 22.86 27.01 25.50 Middle East 7.80Turkey -16.67-3.000.000.0015.007.70 7.71 7.71 1.99 2.34 1.95 1.95 15.50 18.00 15.00 7.00Iran -10.34-1.500.000.0013.007.00 6.80 6.80 1.97 2.07 1.91 1.91 13.80 14.50 13.00 1.60Syria -37.50-1.500.000.002.501.55 1.30 1.30 2.31 2.58 1.92 1.92 3.70 4.00 2.50 North Africa 1.35Egypt 3.470.300.000.008.951.35 1.40 1.40 6.30 6.41 6.39 6.39 8.50 8.65 8.95 3.14Morocco -32.86-2.300.000.004.703.28 3.06 3.06 1.23 2.13 1.54 1.54 3.87 7.00 4.70 3.60Argentina 19.052.000.000.0012.503.50 4.20 4.20 2.58 3.00 2.98 2.98 9.30 10.50 12.50 17.49Others 5.552.561.180.5748.7718.44 19.31 19.41 2.47 2.51 2.50 2.51 43.18 46.21 48.20 World and Selected Countries and Regions July 2014 Foreign Agricultural Service/USDA Office of Global Analysis
- 12. Table 03 Total Coarse Grain Area, Yield, and Production From last month From last year MMTPercent Yield (Metric tons per hectare) Jul 2012/13 MMT Country / Region Area (Million hectares) Production (Million metric tons) Change in Production 2012/13 Prel. 2013/14 Jun Jun Prel. 2013/14 Jul Prel. 2013/14 Jun Jul Percent 2014/15 Proj.2014/15 Proj. 2014/15 Proj. 2012/13 316.15World -1.09-13.890.202.471,261.17321.02 319.21 319.35 3.60 3.97 3.94 3.95 1,138.37 1,275.05 1,258.70 39.20United States -0.42-1.57-0.20-0.73367.8639.87 38.06 38.18 7.30 9.27 9.68 9.64 286.01 369.43 368.59 276.95Total Foreign -1.36-12.320.363.19893.30281.16 281.14 281.18 3.08 3.22 3.17 3.18 852.36 905.62 890.11 none 37.08China 1.563.510.882.00228.5838.38 38.55 38.85 5.72 5.86 5.88 5.88 212.19 225.07 226.58 South America 16.88Brazil -4.93-4.000.000.0077.1116.63 15.98 15.98 4.99 4.88 4.83 4.83 84.25 81.11 77.11 6.84Argentina 5.081.700.000.0035.175.93 6.02 6.02 5.45 5.64 5.85 5.85 37.25 33.47 35.17 31.44European Union - 28 -2.71-4.300.630.96154.0531.48 30.81 30.79 4.65 5.03 4.97 5.00 146.07 158.34 153.08 3.99France 6.091.720.500.1529.954.04 4.06 4.06 7.50 6.98 7.35 7.38 29.94 28.23 29.80 3.57Germany 3.290.736.161.3322.843.47 3.41 3.29 6.50 6.37 6.30 6.94 23.19 22.11 21.51 5.53Poland -2.75-0.520.000.0018.195.21 5.16 5.16 3.58 3.59 3.53 3.53 19.80 18.70 18.19 3.79Spain -24.72-4.13-9.99-1.4012.563.95 3.89 3.89 3.01 4.23 3.59 3.23 11.41 16.69 13.96 1.40Italy 1.440.130.000.008.881.24 1.21 1.21 6.47 7.06 7.32 7.32 9.08 8.76 8.88 1.67Hungary 7.940.681.580.149.211.72 1.75 1.77 3.78 4.95 5.18 5.19 6.30 8.53 9.06 1.15United Kingdom -18.31-1.500.000.006.681.42 1.15 1.15 5.44 5.77 5.83 5.83 6.25 8.17 6.68 3.40Romania -8.93-1.141.750.2011.613.42 3.35 3.35 2.23 3.72 3.41 3.47 7.59 12.75 11.41 Former Soviet Union - 12 14.18Russia 7.742.771.320.5038.5015.49 16.20 16.20 2.02 2.31 2.35 2.38 28.66 35.74 38.00 8.55Ukraine -9.56-3.822.270.8036.108.78 8.47 8.47 3.45 4.55 4.17 4.26 29.53 39.92 35.30 1.95Kazakhstan -2.02-0.070.000.003.442.26 2.39 2.39 1.17 1.55 1.44 1.44 2.28 3.51 3.44 78.07Africa 3.814.200.000.00114.3879.30 81.08 81.08 1.44 1.39 1.41 1.41 112.55 110.18 114.38 12.73Nigeria 0.000.000.000.0019.2013.25 13.25 13.25 1.46 1.45 1.45 1.45 18.57 19.20 19.20 3.44South Africa -6.71-1.010.000.0014.043.41 3.41 3.41 3.75 4.41 4.12 4.12 12.87 15.05 14.04 5.18Ethiopia 0.000.000.000.0013.055.41 5.41 5.41 2.37 2.41 2.41 2.41 12.29 13.05 13.05 0.98Egypt -0.75-0.050.000.006.620.94 0.94 0.94 6.83 7.09 7.07 7.07 6.67 6.67 6.62 25.08India -2.29-0.980.000.0041.7325.38 25.51 25.51 1.59 1.68 1.64 1.64 39.94 42.71 41.73 Southeast Asia 3.00Indonesia 1.100.100.000.009.203.12 3.12 3.12 2.83 2.92 2.95 2.95 8.50 9.10 9.20 2.56Philippines 4.770.360.000.007.902.59 2.63 2.63 2.84 2.92 3.01 3.01 7.26 7.54 7.90 1.11Thailand 0.000.000.000.004.961.15 1.13 1.13 4.20 4.31 4.38 4.38 4.66 4.96 4.96 8.92Mexico 1.010.300.000.0030.149.00 9.00 9.00 3.24 3.32 3.35 3.35 28.88 29.84 30.14 5.35Canada -24.26-6.97-5.64-1.3021.775.39 4.73 4.51 4.57 5.33 4.88 4.83 24.43 28.74 23.07 5.20Australia -4.96-0.61-0.42-0.0511.765.29 5.36 5.34 2.20 2.34 2.20 2.20 11.41 12.37 11.81 4.16Turkey -26.77-3.500.000.009.584.24 4.28 4.28 2.55 3.08 2.24 2.24 10.60 13.08 9.58 26.60Others -1.44-1.010.410.2868.9626.78 25.91 25.91 2.40 2.61 2.65 2.66 63.91 69.96 68.68 World and Selected Countries and Regions July 2014 Foreign Agricultural Service/USDA Office of Global Analysis
- 13. Table 04 Corn Area, Yield, and Production From last month From last year MMTPercent Yield (Metric tons per hectare) Jul 2012/13 MMT Country / Region Area (Million hectares) Production (Million metric tons) Change in Production 2012/13 Prel. 2013/14 Jun Jun Prel. 2013/14 Jul Prel. 2013/14 Jun Jul Percent 2014/15 Proj.2014/15 Proj. 2014/15 Proj. 2012/13 177.23World -0.35-3.49-0.02-0.16980.96178.09 177.25 177.28 4.90 5.53 5.54 5.53 868.81 984.45 981.12 35.36United States -0.47-1.66-0.54-1.91352.0635.48 34.12 33.93 7.74 9.97 10.38 10.38 273.83 353.72 353.97 141.87Total Foreign -0.29-1.830.281.75628.90142.62 143.14 143.35 4.19 4.42 4.38 4.39 594.98 630.73 627.16 none 35.03China 1.613.510.912.00222.0036.32 36.50 36.80 5.87 6.02 6.03 6.03 205.61 218.49 220.00 22.71South America -1.07-1.210.000.00111.6721.72 21.48 21.48 5.27 5.20 5.20 5.20 119.77 112.88 111.67 15.80Brazil -5.13-4.000.000.0074.0015.50 14.80 14.80 5.16 5.03 5.00 5.00 81.50 78.00 74.00 4.00Argentina 8.332.000.000.0026.003.40 3.65 3.65 6.75 7.06 7.12 7.12 27.00 24.00 26.00 0.31Bolivia 0.000.000.000.000.730.32 0.32 0.32 2.26 2.30 2.30 2.30 0.70 0.73 0.73 6.90Mexico 2.740.600.000.0022.506.83 6.90 6.90 3.13 3.21 3.26 3.26 21.59 21.90 22.50 9.72European Union - 28 1.661.070.610.4065.649.83 9.53 9.54 6.06 6.57 6.85 6.88 58.87 64.57 65.25 1.64France 7.481.100.960.1515.801.75 1.70 1.70 9.22 8.38 9.21 9.29 15.15 14.70 15.65 0.97Italy -0.13-0.010.000.007.550.90 0.85 0.85 7.82 8.40 8.88 8.88 7.59 7.56 7.55 1.19Hungary 8.550.580.000.007.301.25 1.26 1.26 3.98 5.36 5.79 5.79 4.74 6.73 7.30 2.73Romania -12.74-1.350.000.009.252.65 2.55 2.55 2.23 4.00 3.63 3.63 6.10 10.60 9.25 0.54Poland -5.75-0.230.000.003.770.61 0.56 0.56 7.35 6.51 6.73 6.73 4.00 4.00 3.77 8.91India -9.05-2.190.000.0022.009.50 9.00 9.00 2.50 2.55 2.44 2.44 22.26 24.19 22.00 1.42Canada -18.31-2.60-7.20-0.9011.601.48 1.33 1.23 9.21 9.59 9.43 9.43 13.06 14.20 12.50 3.00Indonesia 1.100.100.000.009.203.12 3.12 3.12 2.83 2.92 2.95 2.95 8.50 9.10 9.20 4.37Ukraine -12.62-3.900.000.0027.004.83 4.80 4.80 4.79 6.40 5.63 5.63 20.92 30.90 27.00 1.30Serbia 3.130.204.760.306.601.25 1.28 1.28 2.88 5.12 4.94 5.18 3.75 6.40 6.30 0.75Egypt -0.86-0.050.000.005.750.71 0.71 0.71 7.73 8.12 8.10 8.10 5.80 5.80 5.75 2.56Philippines 4.770.360.000.007.902.59 2.63 2.63 2.84 2.92 3.01 3.01 7.26 7.54 7.90 1.16Vietnam 3.930.200.000.005.401.17 1.20 1.20 4.15 4.43 4.50 4.50 4.80 5.20 5.40 1.08Thailand 0.000.000.000.004.901.12 1.10 1.10 4.26 4.38 4.45 4.45 4.60 4.90 4.90 1.94Russia 11.731.370.000.0013.002.32 2.60 2.60 4.24 5.01 5.00 5.00 8.21 11.64 13.00 Sub-Saharan Africa 3.24South Africa -6.90-1.000.000.0013.503.20 3.20 3.20 3.82 4.53 4.22 4.22 12.37 14.50 13.50 4.16Nigeria 0.000.000.000.007.704.25 4.25 4.25 1.83 1.81 1.81 1.81 7.63 7.70 7.70 2.01Ethiopia 0.000.000.000.006.502.15 2.15 2.15 3.06 3.02 3.02 3.02 6.16 6.50 6.50 0.96Zimbabwe 62.500.500.000.001.300.95 1.30 1.30 1.01 0.84 1.00 1.00 0.97 0.80 1.30 0.53Turkey -3.92-0.200.000.004.900.58 0.55 0.55 8.38 8.79 8.91 8.91 4.40 5.10 4.90 30.14Others 2.421.41-0.08-0.0559.8428.70 29.53 29.53 1.94 2.04 2.03 2.03 58.45 58.43 59.89 World and Selected Countries and Regions July 2014 Foreign Agricultural Service/USDA Office of Global Analysis
- 14. Table 05 Barley Area, Yield, and Production From last month From last year MMTPercent Yield (Metric tons per hectare) Jul 2012/13 MMT Country / Region Area (Million hectares) Production (Million metric tons) Change in Production 2012/13 Prel. 2013/14 Jun Jun Prel. 2013/14 Jul Prel. 2013/14 Jun Jul Percent 2014/15 Proj.2014/15 Proj. 2014/15 Proj. 2012/13 50.28World -9.06-13.140.710.93131.9450.49 49.06 48.96 2.59 2.87 2.67 2.69 130.02 145.07 131.01 1.31United States -12.88-0.60-4.38-0.194.081.21 1.13 1.07 3.65 3.86 3.77 3.83 4.80 4.68 4.27 48.96Total Foreign -8.93-12.540.881.12127.8649.28 47.92 47.90 2.56 2.85 2.64 2.67 125.23 140.39 126.74 none 7.63Russia 7.221.113.130.5016.508.02 8.20 8.20 1.83 1.92 1.95 2.01 13.95 15.39 16.00 12.51European Union - 28 -6.27-3.74-0.03-0.0255.8712.35 12.22 12.26 4.39 4.83 4.57 4.56 54.90 59.61 55.88 1.68Germany 2.050.213.520.3610.581.57 1.65 1.60 6.19 6.59 6.21 6.61 10.39 10.37 10.22 1.68France 5.420.560.000.0010.901.63 1.70 1.70 6.74 6.33 6.41 6.41 11.34 10.34 10.90 2.68Spain -30.40-3.06-14.63-1.207.002.77 2.77 2.76 2.23 3.63 2.96 2.54 5.98 10.06 8.20 1.00United Kingdom -16.81-1.190.000.005.901.21 1.00 1.00 5.51 5.84 5.90 5.90 5.52 7.09 5.90 0.72Denmark -14.62-0.586.250.203.400.69 0.57 0.60 5.56 5.78 5.61 5.67 4.01 3.98 3.20 1.16Poland 9.660.280.000.003.180.82 0.90 0.90 3.60 3.55 3.53 3.53 4.18 2.90 3.18 0.38Czech Republic 3.510.063.130.051.650.35 0.35 0.35 4.23 4.57 4.57 4.71 1.62 1.59 1.60 0.45Finland -6.93-0.132.860.051.800.50 0.50 0.50 3.50 3.90 3.50 3.60 1.59 1.93 1.75 0.37Sweden -19.81-0.383.330.051.550.39 0.31 0.33 4.61 5.01 4.84 4.70 1.70 1.93 1.50 0.25Italy 24.270.170.000.000.850.19 0.22 0.22 3.82 3.62 3.86 3.86 0.94 0.68 0.85 0.28Hungary 11.110.129.090.101.200.27 0.28 0.30 3.61 4.06 4.00 4.00 1.00 1.08 1.10 0.15Austria 2.180.020.000.000.750.14 0.15 0.15 4.38 5.13 5.17 5.17 0.66 0.73 0.75 3.29Ukraine 3.160.2411.430.807.803.23 3.00 3.00 2.11 2.34 2.33 2.60 6.94 7.56 7.00 2.75Canada -31.71-3.25-2.78-0.207.002.65 2.27 2.20 2.91 3.87 3.17 3.18 8.01 10.25 7.20 3.64Australia -15.14-1.450.000.008.103.92 3.80 3.80 2.05 2.43 2.13 2.13 7.47 9.55 8.10 3.30Turkey -45.21-3.300.000.004.003.33 3.40 3.40 1.67 2.19 1.18 1.18 5.50 7.30 4.00 0.49China -6.67-0.100.000.001.400.45 0.43 0.43 3.32 3.33 3.26 3.26 1.63 1.50 1.40 1.68Iran 0.000.000.000.003.201.58 1.58 1.58 2.03 2.03 2.03 2.03 3.40 3.20 3.20 1.89Morocco -35.19-0.950.000.001.751.69 1.44 1.44 0.63 1.60 1.22 1.22 1.20 2.70 1.75 1.60Kazakhstan 2.400.060.000.002.601.84 2.00 2.00 0.94 1.38 1.30 1.30 1.50 2.54 2.60 1.02Ethiopia 0.000.000.000.001.801.02 1.02 1.02 1.75 1.76 1.76 1.76 1.78 1.80 1.80 0.65Belarus -17.65-0.300.000.001.400.55 0.45 0.45 3.23 3.09 3.11 3.11 2.10 1.70 1.40 0.77India -1.14-0.020.000.001.730.78 0.81 0.81 2.10 2.24 2.14 2.14 1.62 1.75 1.73 1.50Argentina -18.95-0.900.000.003.851.27 1.00 1.00 3.33 3.74 3.85 3.85 5.00 4.75 3.85 0.33Mexico 0.000.000.000.000.550.22 0.22 0.22 3.15 2.56 2.56 2.56 1.03 0.55 0.55 0.60Iraq 5.930.060.000.001.001.07 1.15 1.15 0.83 0.88 0.87 0.87 0.50 0.94 1.00 1.00Algeria 10.150.150.000.001.650.90 1.00 1.00 1.50 1.66 1.65 1.65 1.50 1.50 1.65 4.31Others -1.93-0.150.390.037.664.42 3.94 3.94 1.67 1.77 1.93 1.94 7.20 7.81 7.63 World and Selected Countries and Regions July 2014 Foreign Agricultural Service/USDA Office of Global Analysis
- 15. Table 06 Oats Area, Yield, and Production From last month From last year MMTPercent Yield (Metric tons per hectare) Jul 2012/13 MMT Country / Region Area (Million hectares) Production (Million metric tons) Change in Production 2012/13 Prel. 2013/14 Jun Jun Prel. 2013/14 Jul Prel. 2013/14 Jun Jul Percent 2014/15 Proj.2014/15 Proj. 2014/15 Proj. 2012/13 9.53World -5.84-1.38-1.25-0.2822.279.68 9.60 9.56 2.24 2.44 2.35 2.33 21.32 23.65 22.55 0.42United States 14.640.146.300.071.100.42 0.45 0.47 2.20 2.29 2.32 2.35 0.93 0.96 1.03 9.11Total Foreign -6.70-1.52-1.61-0.3521.179.26 9.16 9.10 2.24 2.45 2.35 2.33 20.39 22.69 21.52 none 2.86Russia 1.380.070.000.005.003.01 3.00 3.00 1.41 1.64 1.67 1.67 4.03 4.93 5.00 0.99Canada -28.02-1.09-6.67-0.202.801.11 1.00 0.94 2.85 3.50 3.00 2.97 2.81 3.89 3.00 2.67European Union - 28 -4.46-0.37-1.20-0.107.982.62 2.60 2.62 2.96 3.19 3.10 3.05 7.91 8.35 8.08 0.51Poland 1.250.020.000.001.220.43 0.45 0.45 2.86 2.76 2.70 2.70 1.47 1.20 1.22 0.31Finland -2.36-0.030.000.001.200.35 0.36 0.36 3.40 3.50 3.38 3.38 1.07 1.23 1.20 0.44Spain -16.41-0.16-15.79-0.150.800.43 0.43 0.44 1.54 2.22 2.19 1.81 0.68 0.96 0.95 0.15Germany 6.230.048.130.050.670.13 0.13 0.14 5.22 4.74 4.73 4.93 0.76 0.63 0.62 0.20Sweden 0.230.000.000.000.860.20 0.20 0.20 3.82 4.40 4.41 4.41 0.74 0.86 0.86 0.12United Kingdom -31.54-0.300.000.000.660.18 0.12 0.12 5.14 5.48 5.50 5.50 0.63 0.96 0.66 0.08France 4.650.020.000.000.450.09 0.10 0.10 4.83 4.62 4.64 4.64 0.40 0.43 0.45 0.12Italy -13.22-0.030.000.000.200.09 0.08 0.08 2.43 2.52 2.40 2.40 0.29 0.23 0.20 0.05Denmark 2.940.010.000.000.280.06 0.06 0.06 4.94 4.86 4.67 4.67 0.25 0.27 0.28 0.19Romania 1.410.010.000.000.360.18 0.19 0.19 1.75 1.97 1.95 1.95 0.34 0.36 0.36 0.05Czech Republic 18.710.030.000.000.170.04 0.05 0.05 3.37 3.16 3.30 3.30 0.17 0.14 0.17 0.05Hungary 2.940.002.190.000.140.05 0.05 0.05 2.64 2.67 2.58 2.64 0.14 0.14 0.14 0.03Austria 3.450.000.000.000.090.02 0.02 0.02 3.72 3.78 3.91 3.91 0.09 0.09 0.09 0.02Ireland -5.26-0.010.000.000.180.03 0.03 0.03 6.54 7.31 7.20 7.20 0.16 0.19 0.18 0.07Lithuania -0.610.000.000.000.160.07 0.07 0.07 2.31 2.23 2.25 2.25 0.16 0.16 0.16 0.73Australia -13.27-0.18-4.17-0.051.150.74 0.75 0.73 1.54 1.78 1.60 1.58 1.12 1.33 1.20 0.30Ukraine 7.070.030.000.000.500.24 0.25 0.25 2.09 1.94 2.00 2.00 0.63 0.47 0.50 0.20China 0.000.000.000.000.580.20 0.20 0.20 3.00 2.90 2.90 2.90 0.60 0.58 0.58 0.20Belarus -11.11-0.050.000.000.400.16 0.16 0.16 3.00 2.81 2.50 2.50 0.60 0.45 0.40 0.17Brazil 0.000.000.000.000.380.17 0.17 0.17 2.14 2.24 2.24 2.24 0.36 0.38 0.38 0.26Argentina 3.370.020.000.000.460.22 0.23 0.23 1.91 2.07 2.00 2.00 0.50 0.45 0.46 0.13Chile 17.650.110.000.000.700.11 0.13 0.13 5.35 5.41 5.60 5.60 0.68 0.60 0.70 0.07Norway 0.000.000.000.000.240.07 0.07 0.07 3.42 3.42 3.42 3.42 0.24 0.24 0.24 0.09Turkey 0.000.000.000.000.210.09 0.09 0.09 2.36 2.33 2.33 2.33 0.21 0.21 0.21 0.15Kazakhstan -18.03-0.060.000.000.250.22 0.20 0.20 1.33 1.39 1.25 1.25 0.20 0.31 0.25 0.03Serbia 0.000.000.000.000.070.03 0.03 0.03 2.20 2.20 2.20 2.20 0.07 0.07 0.07 0.28Others 0.220.000.000.000.460.28 0.28 0.28 1.61 1.63 1.63 1.63 0.44 0.46 0.46 World and Selected Countries and Regions July 2014 Foreign Agricultural Service/USDA Office of Global Analysis
- 16. Table 07 Rye Area, Yield, and Production From last month From last year MMTPercent Yield (Metric tons per hectare) Jul 2012/13 MMT Country / Region Area (Million hectares) Production (Million metric tons) Change in Production 2012/13 Prel. 2013/14 Jun Jun Prel. 2013/14 Jul Prel. 2013/14 Jun Jul Percent 2014/15 Proj.2014/15 Proj. 2014/15 Proj. 2012/13 5.24World -8.20-1.372.560.3815.305.71 5.69 5.69 2.73 2.92 2.62 2.69 14.30 16.67 14.92 0.10United States 9.230.0217.680.030.210.11 0.11 0.12 1.76 1.73 1.72 1.72 0.18 0.20 0.18 5.14Total Foreign -8.41-1.392.380.3515.095.60 5.59 5.56 2.75 2.94 2.64 2.71 14.12 16.47 14.74 none 2.38European Union - 28 -10.53-1.073.990.359.112.56 2.42 2.40 3.69 3.98 3.62 3.80 8.76 10.19 8.76 1.04Poland -2.42-0.080.000.003.221.16 1.15 1.15 2.77 2.85 2.81 2.81 2.89 3.30 3.22 0.71Germany -19.69-0.9211.410.393.760.79 0.65 0.63 5.46 5.96 5.17 5.97 3.88 4.68 3.38 0.16Spain -26.89-0.10-13.85-0.050.280.16 0.16 0.16 1.60 2.47 2.03 1.75 0.26 0.38 0.33 0.06Lithuania 25.000.020.000.000.120.05 0.05 0.05 2.80 1.96 2.40 2.40 0.16 0.10 0.12 0.04Latvia 15.790.010.000.000.090.03 0.03 0.03 3.35 2.62 2.93 2.93 0.12 0.08 0.09 0.03France 5.630.010.000.000.150.03 0.03 0.03 5.00 4.90 5.00 5.00 0.16 0.14 0.15 0.07Denmark -0.750.000.000.000.530.09 0.09 0.09 5.91 6.14 6.24 6.24 0.38 0.53 0.53 0.03Czech Republic 0.000.000.000.000.180.04 0.04 0.04 4.90 4.43 4.43 4.43 0.15 0.18 0.18 0.05Austria 4.260.010.000.000.250.06 0.06 0.06 4.18 4.20 4.45 4.45 0.21 0.24 0.25 0.02Sweden 0.670.000.000.000.150.02 0.02 0.02 6.36 7.45 7.50 7.50 0.14 0.15 0.15 0.04Hungary -4.76-0.0111.110.010.100.04 0.04 0.04 2.23 3.00 2.57 2.86 0.08 0.11 0.09 0.02Slovakia -28.89-0.030.000.000.060.02 0.02 0.02 3.06 4.09 3.20 3.20 0.05 0.09 0.06 0.02Finland 15.380.000.000.000.030.01 0.01 0.01 3.10 2.17 2.50 2.50 0.07 0.03 0.03 0.01United Kingdom 0.000.000.000.000.040.01 0.01 0.01 7.00 7.00 7.00 7.00 0.04 0.04 0.04 0.01Romania 9.090.000.000.000.020.01 0.01 0.01 2.00 2.75 3.00 3.00 0.02 0.02 0.02 0.02Greece 0.000.000.000.000.030.02 0.02 0.02 1.83 1.83 1.83 1.83 0.03 0.03 0.03 0.02Portugal -9.520.000.000.000.020.02 0.02 0.02 0.77 0.95 0.86 0.86 0.02 0.02 0.02 1.42Russia 4.170.140.000.003.501.78 2.00 2.00 1.50 1.89 1.75 1.75 2.13 3.36 3.50 0.60Belarus -13.33-0.200.000.001.300.60 0.60 0.60 2.67 2.50 2.17 2.17 1.60 1.50 1.30 0.30Ukraine -37.30-0.240.000.000.400.28 0.20 0.20 2.27 2.29 2.00 2.00 0.68 0.64 0.40 0.12Canada -9.52-0.020.000.000.190.09 0.08 0.08 2.74 2.47 2.53 2.53 0.34 0.21 0.19 0.14Turkey 0.000.000.000.000.350.14 0.14 0.14 2.59 2.50 2.50 2.50 0.37 0.35 0.35 0.02Argentina -23.08-0.010.000.000.040.04 0.03 0.03 1.74 1.49 1.60 1.60 0.04 0.05 0.04 0.05Kazakhstan 16.280.010.000.000.050.04 0.04 0.04 1.00 1.10 1.25 1.25 0.05 0.04 0.05 0.06Australia 0.000.000.000.000.020.04 0.04 0.04 0.70 0.57 0.57 0.57 0.04 0.02 0.02 0.00Switzerland 0.000.000.000.000.010.00 0.00 0.00 5.50 5.50 5.50 5.50 0.01 0.01 0.01 0.05Others 9.800.010.000.000.110.05 0.05 0.05 2.26 2.17 2.33 2.33 0.10 0.10 0.11 World and Selected Countries and Regions July 2014 Foreign Agricultural Service/USDA Office of Global Analysis
- 17. Table 08 Sorghum Area, Yield, and Production From last month From last year MMTPercent Yield (Metric tons per hectare) Jul 2012/13 MMT Country / Region Area (Million hectares) Production (Million metric tons) Change in Production 2012/13 Prel. 2013/14 Jun Jun Prel. 2013/14 Jul Prel. 2013/14 Jun Jul Percent 2014/15 Proj.2014/15 Proj. 2014/15 Proj. 2012/13 38.16World 7.184.302.021.2764.0840.44 40.62 40.95 1.52 1.48 1.55 1.57 57.93 59.79 62.81 2.01United States 5.380.5313.891.2710.412.64 2.27 2.59 3.13 3.74 4.04 4.02 6.27 9.88 9.14 36.15Total Foreign 7.543.760.000.0053.6737.80 38.36 38.36 1.43 1.32 1.40 1.40 51.66 49.91 53.67 none Sub-Saharan Africa 4.77Nigeria 0.000.000.000.006.505.00 5.00 5.00 1.25 1.30 1.30 1.30 5.94 6.50 6.50 4.10Sudan 68.961.550.000.003.805.60 5.60 5.60 1.10 0.40 0.68 0.68 4.52 2.25 3.80 1.71Ethiopia 0.000.000.000.004.001.80 1.80 1.80 2.11 2.22 2.22 2.22 3.60 4.00 4.00 1.79Burkina -2.06-0.040.000.001.901.80 1.80 1.80 1.08 1.08 1.06 1.06 1.92 1.94 1.90 0.84Tanzania 0.000.000.000.000.800.85 0.85 0.85 1.00 0.94 0.94 0.94 0.84 0.80 0.80 3.11Niger -6.76-0.090.000.001.203.00 3.00 3.00 0.44 0.43 0.40 0.40 1.38 1.29 1.20 0.37Uganda 0.000.000.000.000.320.35 0.35 0.35 0.90 0.91 0.91 0.91 0.34 0.32 0.32 0.62Mozambique 59.570.110.000.000.300.62 0.62 0.62 0.39 0.30 0.48 0.48 0.24 0.19 0.30 0.23Ghana 8.300.020.000.000.300.25 0.25 0.25 1.21 1.11 1.20 1.20 0.28 0.28 0.30 0.06South Africa -1.750.000.000.000.230.08 0.08 0.08 2.33 2.90 2.81 2.81 0.15 0.23 0.23 South Asia 6.30India 14.290.750.000.006.005.90 6.20 6.20 0.84 0.89 0.97 0.97 5.30 5.25 6.00 0.24Pakistan 0.000.000.000.000.150.24 0.24 0.24 0.60 0.60 0.60 0.60 0.15 0.15 0.15 South America 1.05Argentina 14.290.600.000.004.801.00 1.10 1.10 4.48 4.20 4.36 4.36 4.70 4.20 4.80 0.80Brazil 0.000.000.000.002.400.85 0.90 0.90 2.62 2.82 2.67 2.67 2.10 2.40 2.40 1.64Mexico -4.11-0.300.000.007.001.90 1.83 1.83 3.76 3.84 3.83 3.83 6.17 7.30 7.00 0.62China 3.700.100.000.002.800.65 0.67 0.67 4.10 4.15 4.18 4.18 2.56 2.70 2.80 0.65Australia 85.190.940.000.002.050.49 0.67 0.67 3.44 2.25 3.06 3.06 2.23 1.11 2.05 0.14Egypt 0.000.000.000.000.760.14 0.14 0.14 5.29 5.29 5.29 5.29 0.76 0.76 0.76 0.11European Union - 28 -4.04-0.020.000.000.570.12 0.11 0.11 4.34 4.95 5.04 5.04 0.50 0.59 0.57 0.04France -3.85-0.010.000.000.250.05 0.05 0.05 5.71 5.10 5.56 5.56 0.24 0.26 0.25 0.04Italy 0.000.000.000.000.230.04 0.04 0.04 4.27 6.22 6.22 6.22 0.16 0.23 0.23 6.98Others 1.810.140.000.007.807.15 7.14 7.14 1.15 1.07 1.09 1.09 7.99 7.66 7.80 World and Selected Countries and Regions July 2014 Foreign Agricultural Service/USDA Office of Global Analysis
- 18. World and Selected Countries and Regions Table 09 Rice Area, Yield, and Production From last month From last year MMTPercent Yield (Metric tons per hectare) Jul 2012/13 MMT Country / Region Area (Million hectares) Production (Million metric tons) Change in Production 2012/13 Prel. 2013/14 Jun Jun Prel. 2013/14 Jul Prel. 2013/14 Jun Jul Percent 2014/15 Proj.2014/15 Proj. 2014/15 Proj. 2012/13 158.02World 0.411.98-0.27-1.29479.43160.57 161.63 161.48 4.45 4.43 4.44 4.43 471.66 477.46 480.72 1.08United States 18.181.116.110.427.231.00 1.15 1.23 8.35 8.62 8.37 8.37 6.34 6.12 6.81 156.94Total Foreign 0.180.86-0.36-1.70472.21159.57 160.47 160.26 4.42 4.41 4.41 4.40 465.32 471.34 473.91 none East Asia 30.14China 1.191.700.000.00144.0030.31 30.60 30.60 6.78 6.71 6.72 6.72 143.00 142.30 144.00 1.58Japan -1.69-0.130.000.007.701.60 1.59 1.59 6.74 6.73 6.65 6.65 7.76 7.83 7.70 0.85Korea, South -1.89-0.080.000.004.150.83 0.83 0.83 6.37 6.76 6.70 6.70 4.01 4.23 4.15 0.58Korea, North -4.26-0.080.000.001.800.57 0.57 0.57 4.62 5.07 4.90 4.90 1.74 1.88 1.80 South Asia 42.41India -2.15-2.29-1.89-2.00104.0043.50 44.00 43.80 3.72 3.67 3.61 3.56 105.24 106.29 106.00 11.65Bangladesh 0.610.210.000.0034.8011.77 11.82 11.82 4.35 4.41 4.42 4.42 33.82 34.59 34.80 2.40Pakistan 1.520.100.000.006.702.76 2.76 2.76 3.63 3.59 3.64 3.64 5.80 6.60 6.70 Southeast Asia 12.19Indonesia 0.920.350.000.0037.7012.05 12.16 12.16 4.72 4.88 4.88 4.88 36.55 37.36 37.70 7.86Vietnam 0.710.201.440.4028.207.78 7.78 7.78 5.60 5.76 5.72 5.80 27.54 28.00 27.80 10.84Thailand 0.000.000.000.0020.5010.90 10.90 10.90 2.82 2.85 2.85 2.85 20.20 20.50 20.50 7.04Burma 1.610.190.000.0012.157.05 7.07 7.07 2.60 2.65 2.69 2.69 11.72 11.96 12.15 4.70Philippines 3.280.390.000.0012.204.80 4.89 4.89 3.86 3.90 3.96 3.96 11.43 11.81 12.20 2.98Cambodia 3.700.180.000.004.902.97 3.05 3.05 2.45 2.49 2.51 2.51 4.67 4.73 4.90 0.93Laos 5.800.090.000.001.550.87 0.90 0.90 2.81 2.68 2.73 2.73 1.66 1.47 1.55 0.69Malaysia 2.560.050.000.001.800.69 0.69 0.69 3.79 3.91 4.02 4.02 1.69 1.76 1.80 South America 2.39Brazil 0.000.000.000.008.502.42 2.45 2.45 4.95 5.17 5.10 5.10 8.04 8.50 8.50 0.39Peru -2.60-0.060.000.002.100.41 0.40 0.40 7.72 7.72 7.61 7.61 2.10 2.16 2.10 Sub-Saharan Africa 2.00Nigeria -8.01-0.220.000.002.552.50 2.30 2.30 1.88 1.76 1.76 1.76 2.37 2.77 2.55 1.35Madagascar 24.620.570.000.002.881.45 1.45 1.45 3.37 2.49 3.10 3.10 2.91 2.31 2.88 0.45European Union - 28 1.080.020.000.001.960.44 0.43 0.43 6.67 6.40 6.52 6.52 2.09 1.94 1.96 0.24Italy 0.000.000.000.000.960.22 0.22 0.22 6.60 6.36 6.36 6.36 1.09 0.96 0.96 0.11Spain 3.360.020.000.000.620.11 0.11 0.11 7.73 7.53 7.79 7.79 0.62 0.60 0.62 0.77Egypt 0.410.020.000.004.900.79 0.80 0.80 8.80 8.95 8.93 8.93 4.68 4.88 4.90 0.53Iran 2.000.030.000.001.680.59 0.60 0.60 4.43 4.24 4.25 4.25 1.54 1.65 1.68 12.22Others -1.39-0.36-0.40-0.1025.4812.52 12.45 12.43 3.06 3.12 3.10 3.09 24.79 25.84 25.58 Yield is on a rough basis, before the milling process Production is on a milled basis, after the milling process July 2014 Foreign Agricultural Service/USDA Office of Global Analysis
- 19. World and Selected Countries and Regions Table 10 Total Oilseed Area, Yield, and Production From last month From last year MMTPercent Yield (Metric tons per hectare) Jul 2012/13 MMT Country / Region Area (Million hectares) Production (Million metric tons) Change in Production 2012/13 Prel. 2013/14 Jun Jun Prel. 2013/14 Jul Prel. 2013/14 Jun Jul Percent 2014/15 Proj.2014/15 Proj. 2014/15 Proj. 2012/13 --World Total 3.5617.951.135.85521.86-- -- -- -- -- -- -- 474.64 503.92 516.02 --Total Foreign 0.502.040.220.89408.81-- -- -- -- -- -- -- 381.49 406.78 407.92 --Oilseed, Copra -0.88-0.050.000.005.53-- -- -- -- -- -- -- 5.80 5.58 5.53 --Oilseed, Palm Kernel 5.080.800.780.1316.46-- -- -- -- -- -- -- 14.79 15.66 16.33 none 226.79Major OilSeeds 3.5617.201.165.72499.88229.49 232.37 234.60 2.00 2.10 2.13 2.13 454.05 482.68 494.16 36.71United States 16.3815.914.584.96113.0535.29 37.94 39.80 2.54 2.75 2.85 2.84 93.15 97.14 108.10 none 190.08Foreign Oilseeds 0.331.290.200.76386.83194.20 194.43 194.81 1.90 1.99 1.99 1.99 360.90 385.54 386.07 56.46South America 2.774.520.110.19168.0759.63 59.97 60.02 2.72 2.74 2.80 2.80 153.85 163.55 167.89 28.77Brazil 3.853.510.200.1994.4731.26 31.83 31.88 2.94 2.91 2.96 2.96 84.67 90.96 94.28 21.76Argentina 1.430.820.000.0058.5322.29 22.11 22.11 2.47 2.59 2.65 2.65 53.68 57.70 58.53 3.18Paraguay 1.660.140.000.008.463.27 3.29 3.29 2.68 2.55 2.57 2.57 8.54 8.32 8.46 1.26Bolivia 4.870.130.000.002.801.18 1.30 1.30 2.31 2.26 2.15 2.15 2.91 2.67 2.80 25.49China -1.42-0.830.000.0057.7624.94 24.25 24.25 2.35 2.35 2.38 2.38 59.88 58.59 57.76 39.64South Asia -1.28-0.55-2.19-0.9542.4041.38 41.38 40.68 1.05 1.04 1.05 1.04 41.51 42.95 43.35 35.35India -1.25-0.47-2.50-0.9537.1037.18 37.23 36.53 1.02 1.01 1.02 1.02 36.10 37.57 38.05 3.96Pakistan -1.56-0.080.000.005.043.87 3.82 3.82 1.30 1.32 1.32 1.32 5.15 5.12 5.04 11.42European Union - 28 2.240.710.700.2332.2911.98 12.03 11.95 2.46 2.64 2.67 2.70 28.13 31.58 32.06 2.32France 14.930.910.000.007.022.25 2.28 2.28 3.07 2.72 3.08 3.08 7.14 6.11 7.02 1.33Germany 1.900.115.320.305.941.49 1.46 1.46 3.67 3.92 3.86 4.07 4.88 5.83 5.64 0.84Poland -4.28-0.121.900.052.681.00 0.90 0.90 2.64 2.80 2.92 2.98 2.22 2.80 2.63 1.30Romania -2.40-0.070.000.002.841.43 1.49 1.49 1.34 2.04 1.91 1.91 1.75 2.91 2.84 0.81Hungary -1.97-0.040.000.002.040.84 0.89 0.89 2.18 2.48 2.30 2.30 1.77 2.08 2.04 0.76United Kingdom 18.900.400.000.002.530.72 0.71 0.71 3.38 2.97 3.58 3.58 2.56 2.13 2.53 19.87Former Soviet Union - 12 -1.08-0.382.050.7034.5921.07 21.60 22.25 1.40 1.66 1.57 1.55 27.85 34.97 33.89 8.45Russia 6.010.822.830.4014.409.11 9.29 9.80 1.29 1.49 1.51 1.47 10.87 13.58 14.00 7.46Ukraine -7.33-1.231.970.3015.507.95 8.15 8.30 1.69 2.10 1.87 1.87 12.61 16.73 15.20 1.35Uzbekistan 0.000.000.000.001.671.29 1.29 1.29 1.31 1.30 1.30 1.30 1.77 1.67 1.67 10.52Canada -5.90-1.371.480.3221.889.86 9.99 10.15 1.81 2.36 2.16 2.15 19.04 23.25 21.56 16.75Africa 0.430.060.360.0515.0116.03 16.21 16.26 0.89 0.93 0.92 0.92 14.96 14.94 14.95 3.29Nigeria 0.220.010.000.003.593.23 3.24 3.24 1.15 1.11 1.11 1.11 3.79 3.58 3.59 3.47Southeast Asia 0.480.020.000.005.003.46 3.46 3.46 1.35 1.44 1.45 1.45 4.70 4.98 5.00 1.14Indonesia -0.56-0.010.000.001.781.12 1.09 1.09 1.54 1.61 1.63 1.63 1.76 1.79 1.78 3.80Australia -14.21-0.745.340.234.443.16 2.86 3.09 1.51 1.64 1.47 1.44 5.72 5.17 4.21 2.68Others -2.95-0.160.130.015.402.69 2.69 2.69 1.97 2.07 2.01 2.00 5.28 5.56 5.39 World Total and Total Foreign: (Major Oilseeds plus copra and palm kernel) Major Oilseeds: (soybeans, sunflowerseeds, peanuts(inshell), cottonseed and rapeseed) July 2014 Foreign Agricultural Service/USDA Office of Global Analysis
- 20. Table 11 Soybean Area, Yield, and Production From last month From last year MMTPercent Yield (Metric tons per hectare) Jul 2012/13 MMT Country / Region Area (Million hectares) Production (Million metric tons) Change in Production 2012/13 Prel. 2013/14 Jun Jun Prel. 2013/14 Jul Prel. 2013/14 Jun Jul Percent 2014/15 Proj.2014/15 Proj. 2014/15 Proj. 2012/13 109.28World 7.3720.921.604.80304.79113.05 115.69 117.15 2.45 2.51 2.59 2.60 267.98 283.87 299.99 30.82United States 15.5413.914.544.49103.4230.70 32.56 34.02 2.68 2.92 3.04 3.04 82.56 89.51 98.93 78.46Total Foreign 3.607.010.150.31201.3782.35 83.13 83.13 2.36 2.36 2.42 2.42 185.42 194.37 201.07 none South America 27.70Brazil 4.003.500.000.0091.0029.90 30.50 30.50 2.96 2.93 2.98 2.98 82.00 87.50 91.00 19.40Argentina 0.000.000.000.0054.0020.00 19.60 19.60 2.54 2.70 2.76 2.76 49.30 54.00 54.00 3.00Paraguay 1.230.100.000.008.203.10 3.10 3.10 2.77 2.61 2.65 2.65 8.30 8.10 8.20 1.09Bolivia 4.170.100.000.002.501.00 1.10 1.10 2.44 2.40 2.27 2.27 2.66 2.40 2.50 1.30Uruguay -2.86-0.100.000.003.401.45 1.25 1.25 2.81 2.41 2.72 2.72 3.65 3.50 3.40 East Asia 7.17China -1.64-0.200.000.0012.006.85 6.70 6.70 1.82 1.78 1.79 1.79 13.05 12.20 12.00 0.08Korea, South -17.53-0.030.000.000.130.08 0.07 0.07 1.52 1.93 1.72 1.72 0.12 0.15 0.13 0.12Korea, North 1.230.000.000.000.170.12 0.12 0.12 1.46 1.41 1.40 1.40 0.17 0.16 0.17 0.13Japan 3.540.010.000.000.210.13 0.13 0.13 1.80 1.56 1.64 1.64 0.24 0.20 0.21 10.80India 5.450.60-3.33-0.4011.6012.20 12.00 11.60 1.06 0.90 1.00 1.00 11.50 11.00 12.00 1.68Canada 17.690.920.330.026.121.82 2.11 2.12 3.03 2.86 2.89 2.89 5.09 5.20 6.10 Former Soviet Union - 12 1.35Russia 65.041.0617.390.402.701.20 1.55 1.80 1.39 1.36 1.48 1.50 1.88 1.64 2.30 1.41Ukraine 26.170.739.380.303.501.35 1.60 1.75 1.71 2.05 2.00 2.00 2.41 2.77 3.20 Southeast Asia 0.45Indonesia 0.000.000.000.000.620.45 0.45 0.45 1.33 1.38 1.38 1.38 0.60 0.62 0.62 0.12Vietnam 7.950.010.000.000.190.12 0.13 0.13 1.42 1.47 1.46 1.46 0.17 0.18 0.19 0.05Thailand 0.000.000.000.000.070.04 0.04 0.04 1.70 1.67 1.75 1.75 0.09 0.07 0.07 0.17Burma 0.000.000.000.000.250.17 0.17 0.17 1.23 1.47 1.47 1.47 0.21 0.25 0.25 0.43European Union - 28 15.670.190.000.001.430.47 0.53 0.53 2.22 2.63 2.69 2.69 0.95 1.23 1.43 0.15Italy 22.580.140.000.000.760.18 0.22 0.22 2.76 3.54 3.50 3.50 0.42 0.62 0.76 0.04France 6.190.010.000.000.120.04 0.04 0.04 2.81 2.69 2.86 2.86 0.10 0.11 0.12 Sub-Saharan Africa 0.52South Africa 5.990.050.000.000.920.50 0.56 0.56 1.52 1.73 1.64 1.64 0.79 0.87 0.92 0.57Nigeria 0.000.000.000.000.450.44 0.44 0.44 1.02 1.02 1.02 1.02 0.58 0.45 0.45 0.15Uganda 0.000.000.000.000.170.15 0.15 0.15 1.00 1.11 1.11 1.11 0.15 0.17 0.17 0.17Serbia -2.50-0.010.000.000.390.17 0.17 0.17 1.70 2.42 2.36 2.36 0.28 0.40 0.39 0.14Mexico 14.170.040.000.000.290.16 0.17 0.17 1.75 1.60 1.76 1.76 0.25 0.25 0.29 0.08Iran -2.50-0.010.000.000.200.08 0.08 0.08 2.50 2.50 2.44 2.44 0.20 0.20 0.20 0.39Others 3.860.03-1.66-0.020.890.40 0.42 0.42 2.06 2.13 2.13 2.13 0.81 0.86 0.90 World and Selected Countries and Regions July 2014 Foreign Agricultural Service/USDA Office of Global Analysis
- 21. Table 12 Cottonseed Area, Yield, and Production From last month From last year MMTPercent Yield (Metric tons per hectare) Jul 2012/13 MMT Country / Region Area (Million hectares) Production (Million metric tons) Change in Production 2012/13 Prel. 2013/14 Jun Jun Prel. 2013/14 Jul Prel. 2013/14 Jun Jul Percent 2014/15 Proj.2014/15 Proj. 2014/15 Proj. 2012/13 33.43World -2.30-1.030.960.4243.8631.86 32.00 32.47 1.39 1.41 1.36 1.35 46.31 44.89 43.44 3.79United States 31.681.2110.910.495.023.05 3.54 3.93 1.36 1.25 1.28 1.28 5.14 3.81 4.53 29.64Total Foreign -5.46-2.24-0.20-0.0838.8428.81 28.46 28.54 1.39 1.43 1.37 1.36 41.17 41.08 38.91 none 5.30China -7.81-0.980.000.0011.564.90 4.35 4.35 2.59 2.56 2.66 2.66 13.72 12.54 11.56 South Asia 12.00India -8.11-1.05-1.65-0.2011.9011.70 11.80 11.80 1.01 1.11 1.03 1.01 12.10 12.95 12.10 3.00Pakistan 0.000.000.000.004.103.00 3.00 3.00 1.33 1.37 1.37 1.37 4.00 4.10 4.10 Former Soviet Union - 12 1.35Uzbekistan 0.000.000.000.001.671.29 1.29 1.29 1.31 1.30 1.30 1.30 1.77 1.67 1.67 0.60Turkmenistan 0.000.000.000.000.590.58 0.58 0.58 1.04 1.03 1.03 1.03 0.63 0.59 0.59 0.20Tajikistan 0.000.000.000.000.200.19 0.19 0.19 1.08 1.03 1.03 1.03 0.22 0.20 0.20 0.15Kazakhstan -4.51-0.010.000.000.130.14 0.13 0.13 1.10 0.96 0.95 0.95 0.16 0.13 0.13 South America 0.90Brazil 2.590.086.630.192.981.12 1.10 1.15 2.48 2.59 2.54 2.59 2.23 2.90 2.79 0.36Argentina 1.190.010.000.000.430.56 0.57 0.57 0.72 0.75 0.75 0.75 0.26 0.42 0.43 Middle East 0.41Turkey 25.810.190.000.000.930.33 0.42 0.42 2.12 2.24 2.22 2.22 0.87 0.74 0.93 0.13Syria -64.86-0.180.000.000.100.11 0.06 0.06 2.72 2.51 1.62 1.62 0.34 0.28 0.10 0.11Iran 6.670.010.000.000.100.10 0.11 0.11 1.14 0.90 0.87 0.87 0.12 0.09 0.10 0.45Australia -35.77-0.47-13.02-0.130.840.44 0.32 0.30 3.20 2.98 3.00 2.78 1.42 1.30 0.96 0.36European Union - 28 12.530.060.000.000.540.31 0.35 0.35 1.36 1.54 1.55 1.55 0.48 0.48 0.54 0.29Greece 13.250.050.000.000.450.25 0.27 0.27 1.33 1.63 1.71 1.71 0.38 0.40 0.45 0.07Spain 8.970.010.000.000.090.06 0.08 0.08 1.47 1.22 1.06 1.06 0.10 0.08 0.09 Sub-Saharan Africa 0.58Burkina -8.43-0.030.000.000.300.56 0.57 0.57 0.56 0.60 0.54 0.54 0.33 0.33 0.30 0.52Mali 7.470.020.000.000.260.48 0.52 0.52 0.47 0.50 0.50 0.50 0.25 0.24 0.26 0.21Cameroon -4.00-0.010.000.000.240.22 0.22 0.22 1.10 1.14 1.09 1.09 0.23 0.25 0.24 0.06Sudan 0.000.000.000.000.050.06 0.06 0.06 1.07 0.84 0.84 0.84 0.06 0.05 0.05 0.24Zimbabwe 23.680.030.000.000.140.23 0.30 0.30 0.41 0.50 0.47 0.47 0.10 0.11 0.14 0.30Nigeria 6.150.010.000.000.140.29 0.30 0.30 0.47 0.45 0.46 0.46 0.14 0.13 0.14 0.25Benin 0.000.000.000.000.170.27 0.27 0.27 0.73 0.61 0.61 0.61 0.18 0.17 0.17 0.08Uganda 3.750.000.000.000.080.05 0.07 0.07 1.16 1.54 1.28 1.28 0.09 0.08 0.08 0.14Egypt 20.300.0341.590.050.160.13 0.11 0.16 1.04 1.02 1.03 1.03 0.15 0.13 0.11 0.16Mexico 19.110.064.760.020.370.12 0.15 0.16 2.27 2.64 2.38 2.34 0.35 0.31 0.36 0.30Burma 0.000.000.000.000.190.30 0.30 0.30 0.63 0.63 0.63 0.63 0.19 0.19 0.19 1.51Others -0.430.000.000.000.701.35 1.35 1.35 0.53 0.52 0.52 0.52 0.79 0.71 0.70 World and Selected Countries and Regions July 2014 Foreign Agricultural Service/USDA Office of Global Analysis
- 22. Table 13 Peanut Area, Yield, and Production From last month From last year MMTPercent Yield (Metric tons per hectare) Jul 2012/13 MMT Country / Region Area (Million hectares) Production (Million metric tons) Change in Production 2012/13 Prel. 2013/14 Jun Jun Prel. 2013/14 Jul Prel. 2013/14 Jun Jul Percent 2014/15 Proj.2014/15 Proj. 2014/15 Proj. 2012/13 23.94World 1.470.59-1.12-0.4640.4023.71 23.93 23.61 1.68 1.68 1.71 1.71 40.12 39.82 40.86 0.65United States 22.660.43-4.41-0.112.320.42 0.55 0.52 4.73 4.49 4.45 4.48 3.07 1.89 2.43 23.29Total Foreign 0.410.16-0.91-0.3538.0823.29 23.39 23.09 1.59 1.63 1.64 1.65 37.06 37.93 38.43 none 4.64China 1.180.200.000.0017.204.71 4.72 4.72 3.60 3.61 3.64 3.64 16.69 17.00 17.20 South Asia 5.00India -3.54-0.20-6.03-0.355.455.40 5.50 5.20 1.00 1.05 1.05 1.05 5.00 5.65 5.80 0.11Pakistan 0.000.000.000.000.100.11 0.11 0.11 0.90 0.90 0.90 0.90 0.10 0.10 0.10 10.96Sub-Saharan Africa 0.010.000.000.009.9210.52 10.53 10.53 0.92 0.94 0.94 0.94 10.09 9.92 9.92 2.42Nigeria 0.000.000.000.003.002.50 2.50 2.50 1.27 1.20 1.20 1.20 3.07 3.00 3.00 0.71Senegal 2.110.020.000.000.730.77 0.77 0.77 0.98 0.92 0.94 0.94 0.69 0.71 0.73 0.41Chad 0.000.000.000.000.400.50 0.50 0.50 0.90 0.80 0.80 0.80 0.37 0.40 0.40 0.35Ghana 0.000.000.000.000.440.40 0.40 0.40 1.38 1.10 1.10 1.10 0.48 0.44 0.44 1.62Sudan 0.000.000.000.000.851.00 1.00 1.00 0.64 0.85 0.85 0.85 1.03 0.85 0.85 0.48Congo (Kinshasa) 0.000.000.000.000.370.48 0.48 0.48 0.78 0.78 0.78 0.78 0.37 0.37 0.37 0.36Burkina 0.000.000.000.000.270.35 0.35 0.35 0.73 0.77 0.77 0.77 0.26 0.27 0.27 0.22Guinea 0.000.000.000.000.260.21 0.21 0.21 1.38 1.24 1.24 1.24 0.30 0.26 0.26 0.41Cameroon 0.000.000.000.000.550.40 0.40 0.40 1.39 1.38 1.38 1.38 0.57 0.55 0.55 0.34Mali 0.000.000.000.000.330.35 0.35 0.35 0.95 0.93 0.93 0.93 0.33 0.33 0.33 0.35Malawi -1.57-0.010.000.000.380.36 0.37 0.37 1.09 1.05 1.03 1.03 0.39 0.38 0.38 0.08Cote d'Ivoire 0.000.000.000.000.090.08 0.08 0.08 1.21 1.13 1.13 1.13 0.09 0.09 0.09 0.30Uganda 0.000.000.000.000.300.30 0.30 0.30 1.00 1.00 1.00 1.00 0.30 0.30 0.30 0.10Central African Republic 0.000.000.000.000.150.10 0.10 0.10 1.55 1.50 1.50 1.50 0.15 0.15 0.15 0.13Benin 0.000.000.000.000.090.13 0.13 0.13 0.65 0.65 0.65 0.65 0.08 0.09 0.09 0.39Mozambique 0.000.000.000.000.110.29 0.29 0.29 0.29 0.38 0.38 0.38 0.11 0.11 0.11 0.74Niger -4.11-0.020.000.000.350.74 0.74 0.74 0.39 0.49 0.47 0.47 0.29 0.37 0.35 0.05South Africa 6.190.010.000.000.120.05 0.06 0.06 1.19 2.13 2.00 2.00 0.06 0.11 0.12 Southeast Asia 0.68Indonesia -0.86-0.010.000.001.150.66 0.63 0.63 1.68 1.77 1.83 1.83 1.15 1.16 1.15 0.88Burma 0.000.000.000.001.400.89 0.89 0.89 1.56 1.58 1.58 1.58 1.37 1.40 1.40 0.22Vietnam 3.770.020.000.000.550.23 0.24 0.24 2.28 2.30 2.29 2.29 0.49 0.53 0.55 0.03Thailand 0.000.000.000.000.050.03 0.03 0.03 1.53 1.67 1.67 1.67 0.05 0.05 0.05 South America 0.38Argentina 22.200.220.000.001.200.33 0.34 0.34 2.67 2.94 3.53 3.53 1.02 0.98 1.20 0.10Brazil -20.33-0.070.000.000.290.11 0.10 0.10 3.36 3.37 2.90 2.90 0.33 0.36 0.29 0.06Egypt 0.000.000.000.000.190.06 0.06 0.06 3.17 3.17 3.17 3.17 0.19 0.19 0.19 0.06Mexico 0.000.000.000.000.100.06 0.06 0.06 1.98 1.75 1.75 1.75 0.12 0.10 0.10 0.18Others 0.200.000.000.000.490.20 0.20 0.20 2.58 2.50 2.51 2.51 0.47 0.49 0.49 World and Selected Countries and Regions July 2014 Foreign Agricultural Service/USDA Office of Global Analysis
- 23. Table 14 Sunflowerseed Area, Yield, and Production From last month From last year MMTPercent Yield (Metric tons per hectare) Jul 2012/13 MMT Country / Region Area (Million hectares) Production (Million metric tons) Change in Production 2012/13 Prel. 2013/14 Jun Jun Prel. 2013/14 Jul Prel. 2013/14 Jun Jul Percent 2014/15 Proj.2014/15 Proj. 2014/15 Proj. 2012/13 23.84World -5.14-2.20-0.21-0.0940.6724.63 24.50 24.71 1.51 1.74 1.66 1.65 36.06 42.87 40.75 0.75United States 18.870.177.870.081.100.60 0.61 0.66 1.70 1.54 1.66 1.66 1.26 0.92 1.02 23.10Total Foreign -5.67-2.38-0.42-0.1739.5724.03 23.88 24.05 1.51 1.75 1.66 1.65 34.80 41.95 39.74 none 12.61Former Soviet Union - 12 -8.51-1.98-0.020.0021.2513.52 13.34 13.60 1.40 1.72 1.59 1.56 17.66 23.23 21.25 6.13Russia -3.35-0.35-0.040.0010.206.80 6.54 6.80 1.30 1.55 1.56 1.50 7.96 10.55 10.20 5.50Ukraine -13.79-1.600.000.0010.005.60 5.60 5.60 1.64 2.07 1.79 1.79 9.00 11.60 10.00 0.30Moldova -9.82-0.050.000.000.450.30 0.30 0.30 0.99 1.67 1.50 1.50 0.30 0.50 0.45 0.68Kazakhstan 4.710.030.000.000.600.82 0.90 0.90 0.59 0.70 0.67 0.67 0.40 0.57 0.60 1.94South America 23.230.670.000.003.551.79 2.02 2.02 1.85 1.61 1.76 1.76 3.60 2.88 3.55 1.62Argentina 26.090.600.000.002.901.40 1.60 1.60 1.91 1.64 1.81 1.81 3.10 2.30 2.90 0.03Uruguay 25.710.010.000.000.040.03 0.03 0.03 1.60 1.40 1.47 1.47 0.04 0.04 0.04 0.17Bolivia 11.110.030.000.000.300.18 0.20 0.20 1.47 1.50 1.50 1.50 0.25 0.27 0.30 0.07Brazil 2.560.010.000.000.200.13 0.13 0.13 1.57 1.50 1.54 1.54 0.11 0.20 0.20 0.05Paraguay 31.250.030.000.000.110.05 0.06 0.06 1.78 1.60 1.69 1.69 0.10 0.08 0.11 0.95China 2.040.050.000.002.500.97 0.98 0.98 2.54 2.54 2.56 2.56 2.41 2.45 2.50 4.30European Union - 28 -9.03-0.79-2.16-0.187.934.39 4.30 4.20 1.64 1.98 1.88 1.89 7.07 8.71 8.10 0.68France 1.520.030.000.001.680.77 0.72 0.72 2.31 2.14 2.33 2.33 1.57 1.65 1.68 0.61Hungary -6.46-0.100.000.001.380.59 0.60 0.60 2.14 2.47 2.29 2.29 1.30 1.47 1.38 0.76Spain -22.25-0.23-17.95-0.180.800.85 0.90 0.80 0.81 1.21 1.08 1.00 0.62 1.03 0.98 0.11Italy -5.35-0.010.000.000.230.11 0.11 0.11 1.71 2.25 2.13 2.13 0.19 0.24 0.23 0.09Slovakia 3.170.010.000.000.200.08 0.09 0.09 2.19 2.28 2.27 2.27 0.20 0.19 0.20 1.27South Asia -6.30-0.080.000.001.191.15 1.09 1.09 1.10 1.10 1.09 1.09 1.40 1.27 1.19 0.80India -2.99-0.020.000.000.650.75 0.73 0.73 0.88 0.89 0.89 0.89 0.70 0.67 0.65 0.47Pakistan -10.00-0.060.000.000.540.40 0.36 0.36 1.49 1.50 1.50 1.50 0.70 0.60 0.54 0.60Turkey -17.86-0.250.000.001.150.69 0.60 0.60 1.88 2.03 1.92 1.92 1.13 1.40 1.15 0.51South Africa -3.03-0.030.000.000.800.60 0.61 0.61 1.10 1.38 1.31 1.31 0.56 0.83 0.80 0.54Burma 0.000.000.000.000.490.54 0.54 0.54 0.65 0.90 0.90 0.90 0.35 0.49 0.49 0.18Serbia 0.000.000.000.000.430.19 0.19 0.19 2.00 2.30 2.30 2.30 0.35 0.43 0.43 0.04Canada 15.380.010.000.000.060.03 0.03 0.03 2.18 1.86 1.76 1.76 0.09 0.05 0.06 0.03Australia 43.750.010.000.000.050.03 0.04 0.04 1.47 1.19 1.28 1.28 0.04 0.03 0.05 0.14Others 0.000.006.740.010.190.16 0.15 0.16 1.17 1.23 1.19 1.23 0.17 0.19 0.18 World and Selected Countries and Regions July 2014 Foreign Agricultural Service/USDA Office of Global Analysis
- 24. Table 15 Rapeseed Area, Yield, and Production From last month From last year MMTPercent Yield (Metric tons per hectare) Jul 2012/13 MMT Country / Region Area (Million hectares) Production (Million metric tons) Change in Production 2012/13 Prel. 2013/14 Jun Jun Prel. 2013/14 Jul Prel. 2013/14 Jun Jul Percent 2014/15 Proj.2014/15 Proj. 2014/15 Proj. 2012/13 36.30World -1.50-1.071.511.0570.1636.24 36.25 36.68 1.75 1.97 1.91 1.91 63.57 71.23 69.11 0.70United States 18.730.19-0.250.001.190.51 0.68 0.68 1.59 1.96 1.76 1.76 1.11 1.00 1.20 35.60Total Foreign -1.79-1.261.551.0568.9735.73 35.57 36.00 1.75 1.97 1.91 1.92 62.46 70.22 67.92 none 6.33European Union - 28 5.871.241.820.4022.406.81 6.85 6.88 3.10 3.11 3.21 3.26 19.63 21.16 22.00 1.31Germany 1.770.105.380.305.881.46 1.44 1.44 3.69 3.95 3.89 4.10 4.82 5.78 5.58 1.61France 20.250.880.000.005.231.44 1.52 1.52 3.40 3.03 3.44 3.44 5.46 4.35 5.23 0.76United Kingdom 18.900.400.000.002.530.72 0.71 0.71 3.38 2.97 3.58 3.58 2.56 2.13 2.53 0.84Poland -4.29-0.121.900.052.681.00 0.90 0.90 2.64 2.80 2.92 2.98 2.22 2.80 2.63 0.40Czech Republic -14.07-0.201.640.021.240.42 0.39 0.39 2.77 3.45 3.11 3.16 1.11 1.44 1.22 0.13Denmark 2.190.020.000.000.700.18 0.18 0.18 3.71 3.87 3.89 3.89 0.48 0.69 0.70 0.17Hungary 6.870.040.000.000.560.20 0.23 0.23 2.40 2.59 2.43 2.43 0.40 0.52 0.56 0.11Romania 33.800.240.000.000.950.29 0.42 0.42 1.53 2.45 2.26 2.26 0.17 0.71 0.95 0.11Slovakia -12.92-0.050.000.000.310.14 0.12 0.12 1.99 2.60 2.54 2.54 0.21 0.36 0.31 0.11Sweden 2.100.010.000.000.340.12 0.13 0.13 2.97 2.73 2.72 2.72 0.32 0.33 0.34 0.26Lithuania -2.76-0.020.000.000.600.27 0.26 0.26 2.43 2.33 2.31 2.31 0.63 0.62 0.60 0.12Latvia -10.77-0.030.000.000.270.13 0.12 0.12 2.58 2.32 2.30 2.30 0.30 0.30 0.27 0.06Austria -8.63-0.020.000.000.180.06 0.06 0.06 2.64 3.40 3.10 3.10 0.15 0.20 0.18 0.06Finland -11.76-0.010.000.000.080.05 0.06 0.06 1.25 1.60 1.36 1.36 0.08 0.09 0.08 0.09Estonia -1.150.000.000.000.170.09 0.09 0.09 1.82 2.02 1.98 1.98 0.16 0.17 0.17 7.43China 0.690.100.000.0014.507.51 7.50 7.50 1.88 1.92 1.93 1.93 14.01 14.40 14.50 South Asia 6.75India 2.740.200.000.007.507.13 7.20 7.20 1.01 1.02 1.04 1.04 6.80 7.30 7.50 0.38Pakistan -6.25-0.020.000.000.300.36 0.35 0.35 0.92 0.89 0.86 0.86 0.35 0.32 0.30 0.31Bangladesh 0.000.000.000.000.230.31 0.31 0.31 0.74 0.74 0.74 0.74 0.23 0.23 0.23 8.80Canada -12.78-2.301.950.3015.708.01 7.85 8.00 1.58 2.25 1.96 1.96 13.87 18.00 15.40 3.27Australia -8.24-0.3111.290.353.452.66 2.45 2.70 1.27 1.42 1.27 1.28 4.14 3.76 3.10 Former Soviet Union - 12 0.55Ukraine -14.97-0.350.000.002.001.00 0.95 0.95 2.20 2.36 2.11 2.11 1.20 2.35 2.00 0.97Russia 7.680.110.000.001.501.11 1.20 1.20 1.07 1.25 1.25 1.25 1.04 1.39 1.50 0.42Belarus 0.000.000.000.000.700.40 0.43 0.43 1.67 1.75 1.65 1.65 0.71 0.70 0.70 0.08Paraguay 5.000.010.000.000.130.09 0.09 0.09 1.37 1.41 1.40 1.40 0.11 0.12 0.13 0.30Others 14.960.070.000.000.560.35 0.40 0.40 1.25 1.41 1.41 1.41 0.37 0.49 0.56 World and Selected Countries and Regions July 2014 Foreign Agricultural Service/USDA Office of Global Analysis
- 25. Table 16 Copra, Palm Kernel, and Palm Oil Production Country / Region Production (Million metric tons) 2012/13 Prel. 2013/14 2014/15 Proj. Jun Jul MMT Percent MMT Percent Change in Production From last month From last year Oilseed, Copra 0.00 0.00 -0.05 -2.08Philippines 2.65 2.352.352.40 0.00 0.00 0.00 0.00Indonesia 1.56 1.581.581.58 0.00 0.00 0.00 0.00India 0.67 0.670.670.67 0.00 0.00 0.00 0.00Vietnam 0.24 0.240.240.24 0.00 0.00 0.00 0.00Mexico 0.21 0.210.210.21 0.00 0.00 0.00 0.00Papua New Guinea 0.13 0.130.130.13 0.00 0.00 0.00 0.00Thailand 0.07 0.070.070.07 0.00 0.00 0.00 0.00Sri Lanka 0.07 0.070.070.07 0.00 0.00 0.00 0.00Solomon Islands 0.03 0.030.030.03 0.00 0.00 0.00 0.00Cote d'Ivoire 0.03 0.030.030.03 0.00 0.00 -0.05 -0.90World 5.80 5.535.535.58 Oilseed, Palm Kernel 0.00 0.00 0.56 6.88Indonesia 7.48 8.708.708.14 0.11 2.16 0.20 4.00Malaysia 4.87 5.205.095.00 0.01 1.39 0.01 1.39Nigeria 0.70 0.730.720.73 0.00 0.00 0.01 2.27Thailand 0.43 0.450.450.44 0.00 0.00 0.00 0.00Colombia 0.21 0.240.240.24 0.00 0.00 0.00 0.00Papua New Guinea 0.13 0.130.130.13 0.00 0.00 0.00 0.00Cameroon 0.11 0.110.110.11 0.00 0.00 0.01 9.09Ecuador 0.11 0.120.120.11 0.00 0.00 0.01 10.00Honduras 0.10 0.110.110.10 0.00 0.00 0.00 0.00Brazil 0.10 0.100.100.10 0.13 0.80 0.80 5.11World 14.79 16.4616.3315.66 Oil, Palm 0.00 0.00 2.50 8.06Indonesia 28.50 33.5033.5031.00 0.45 2.21 0.90 4.52Malaysia 19.32 20.8020.3519.90 0.00 0.00 0.10 4.65Thailand 2.14 2.252.252.15 0.00 0.00 -0.01 -0.97Colombia 0.97 1.031.031.04 0.00 0.00 0.00 0.00Nigeria 0.91 0.930.930.93 0.00 0.00 0.00 0.00Papua New Guinea 0.61 0.630.630.63 0.00 0.00 0.01 1.79Ecuador 0.54 0.580.580.57 0.00 0.00 0.01 2.33Honduras 0.41 0.440.440.43 0.00 0.00 0.00 0.00Cote d'Ivoire 0.39 0.400.400.40 0.00 0.00 0.01 2.86Guatemala 0.32 0.360.360.35 0.45 0.72 3.51 5.92World 55.97 62.8062.3559.29 World and Selected Countries and Regions July 2014 Foreign Agricultural Service/USDA Office of Global Analysis
- 26. Table 17 Cotton Area, Yield, and Production From last month From last year MBalesPercent Yield (Kilograms per hectare) Jul 2012/13 MBales Country / Region Area (Million hectares) Production (Million 480 lb. bales) Change in Production 2012/13 Prel. 2013/14 Jun Jun Prel. 2013/14 Jul Prel. 2013/14 Jun Jul Percent 2014/15 Proj.2014/15 Proj. 2014/15 Proj. 2012/13 34.33World -1.61-1.910.430.50116.4232.77 33.02 33.39 780 786 764 759 122.95 118.33 115.92 3.79United States 27.823.5910.001.5016.503.05 3.54 3.93 994 921 922 915 17.32 12.91 15.00 30.54Total Foreign -5.22-5.50-0.99-1.0099.9229.72 29.48 29.46 753 772 745 738 105.64 105.42 100.92 none South Asia 12.00India -8.20-2.50-1.75-0.5028.0011.70 11.80 11.80 517 568 526 517 28.50 30.50 28.50 3.00Pakistan 0.000.000.000.009.503.00 3.00 3.00 675 689 689 689 9.30 9.50 9.50 Former Soviet Union - 12 1.32Uzbekistan 1.200.050.000.004.201.29 1.29 1.29 745 703 712 712 4.50 4.15 4.20 0.60Turkmenistan -3.33-0.050.000.001.450.58 0.55 0.55 581 568 579 579 1.60 1.50 1.45 0.20Tajikistan 0.000.000.000.000.500.19 0.19 0.19 599 573 588 588 0.55 0.50 0.50 0.15Kazakhstan -4.41-0.020.000.000.330.14 0.13 0.13 611 536 544 544 0.42 0.34 0.33 Sub-Saharan Africa 0.58Burkina -8.33-0.100.000.001.100.56 0.57 0.57 441 471 424 424 1.18 1.20 1.10 0.52Mali 7.650.070.000.000.920.48 0.52 0.52 362 386 383 383 0.87 0.85 0.92 0.24Zimbabwe 23.330.070.000.000.370.23 0.30 0.30 236 284 269 269 0.26 0.30 0.37 0.25Benin 0.000.000.000.000.500.27 0.27 0.27 479 403 403 403 0.55 0.50 0.50 0.38Cote d'Ivoire -10.00-0.080.000.000.680.36 0.37 0.37 398 460 403 403 0.69 0.75 0.68 0.21Cameroon -4.00-0.020.000.000.480.22 0.22 0.22 477 495 475 475 0.46 0.50 0.48 0.30Nigeria 6.670.020.000.000.320.29 0.30 0.30 236 225 232 232 0.33 0.30 0.32 0.06Sudan 0.000.000.000.000.090.06 0.06 0.06 454 356 356 356 0.13 0.09 0.09 South America 0.90Brazil 2.560.20-3.61-0.308.001.12 1.20 1.15 1,452 1,516 1,506 1,515 6.00 7.80 8.30 0.36Argentina 0.410.010.000.001.230.56 0.57 0.57 454 474 472 472 0.75 1.22 1.23 0.05Paraguay 18.180.010.000.000.070.03 0.04 0.04 363 399 354 354 0.08 0.06 0.07 Middle East 0.41Turkey 26.090.600.000.002.900.33 0.42 0.42 1,407 1,517 1,503 1,503 2.65 2.30 2.90 0.13Syria -50.00-0.300.000.000.300.10 0.06 0.06 1,263 1,306 1,089 1,089 0.73 0.60 0.30 0.11Iran -6.25-0.020.000.000.300.12 0.11 0.11 591 606 594 594 0.29 0.32 0.30 0.45Australia -34.15-1.40-12.90-0.402.700.44 0.32 0.30 2,251 2,047 2,109 1,960 4.60 4.10 3.10 0.36European Union - 28 5.380.090.000.001.690.31 0.34 0.34 909 1,119 1,079 1,079 1.49 1.60 1.69 0.29Greece 2.260.030.000.001.400.25 0.27 0.27 912 1,217 1,150 1,150 1.19 1.37 1.40 0.07Spain 25.000.060.000.000.280.06 0.07 0.07 893 748 820 820 0.29 0.22 0.28 0.14Egypt 20.690.0941.890.160.530.13 0.11 0.16 746 729 732 737 0.49 0.44 0.37 0.16Mexico 19.050.184.760.051.100.12 0.15 0.16 1,455 1,691 1,524 1,497 1.04 0.92 1.05 7.69Others -6.82-2.39-0.02-0.0132.707.13 6.62 6.62 1,082 1,072 1,075 1,075 38.22 35.09 32.70 World and Selected Countries and Regions July 2014 Foreign Agricultural Service/USDA Office of Global Analysis
- 27. TABLE 18 The table below presents a record of the differences between the July projection and the final Estimate. Using world wheat production as an example, the "root mean square error” means that chances are 2 out of 3 that the current forecast will not be above or below the final estimate by more than 2.9 percent. Chances are 9 out of 10 (90% confidence level) that the difference will not exceed 4.9 percent. The average difference between the July projection and the final estimate is 14.3 million tons, ranging from 1.0 million to 34.6 million tons. The July projection has been below the estimate 19 times and above 14 times. RELIABILITY OF PRODUCTION PROJECTIONS 1/ COMMODITY AND REGION Root mean square error 90 percent confidence interval Difference between forecast and final estimate Average Smallest Largest Years Below final Above final Percent ---Million metric tons--- WHEAT World 2.9 4.9 14.3 1.0 34.6 19 14 U.S. 3.6 6.2 1.7 0.2 6.2 15 18 Foreign 3.2 5.4 13.9 0.3 34.7 20 13 COARSE GRAINS 2/ World 2.9 5.0 21.7 3.7 68.4 17 16 U.S. 10.8 18.4 16.7 0.6 57.9 14 19 Foreign 2.5 4.2 12.6 1.1 37.9 17 16 RICE (Milled) World 2.5 4.3 7.2 0.4 24.0 21 12 U.S. 4.8 8.1 0.2 0.0 0.6 18 13 Foreign 2.6 4.3 7.2 0.5 24.3 21 12 SOYBEANS World 5.3 8.9 6.9 0.5 26.9 15 18 U.S. 7.3 12.3 3.4 0.2 11.7 15 18 Foreign 7.9 13.3 6.4 1.0 25.8 18 15 COTTON ---Million 480-lb. bales--- World 5.6 9.4 3.6 0.0 14.9 20 13 U.S. 10.1 17.1 1.4 0.1 5.3 19 14 Foreign 5.7 9.7 2.9 0.0 12.1 18 14 UNITED STATES -------Million bushels------- CORN 11.9 20.1 605 12 2,190 17 16 SORGHUM 19.1 32.3 73 3 213 16 17 BARLEY 8.2 13.9 23 0 87 11 21 OATS 12.6 21.3 22 0 144 5 27 1/ Marketing years 1981/82 through 2013/14. Final for grains, soybeans and cotton is defined as the first November estimate following the marketing year for 1981/82 through 2012/13, and for 2013/14 last month’s estimate. 2/ Includes corn, sorghum, barley, oats, rye, millet, and mixed grain July 2014 Office of Global Analysis, FAS, USDA