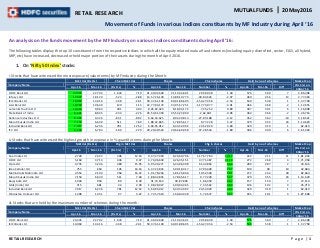
Movement of funds on various indices constituents by MF industry during April ‘16
•
1 like•267 views

Mutual Funds' position in Nifty 50 index, Nifty Free Float Midcap 100 Index, Nifty Free Float Smallcap 100 Index, Nifty Infrastructure Index constituents during April 2016.

Recommended
Recommended
More Related Content
Viewers also liked
Viewers also liked (11)
More from Dhuraivel Gunasekaran
More from Dhuraivel Gunasekaran (20)
Recently uploaded
Recently uploaded (20)
Movement of funds on various indices constituents by MF industry during April ‘16
- 1. RETAIL RESEARCH MUTUAL FUNDS 20 May 2016 RETAIL RESEARCH P a g e | 1 Movement of Funds in various Indices constituents by MF Industry during April ‘16 An analysis on the funds movement by the MF Industry on various Indices constituents during April’16: The following tables display the top 10 constituents from the respective indices in which all the equity related mutual fund schemes (including equity diversified, sector, ELSS, all hybrid, MIP, etc) have increased, decreased or held major portion of their assets during the month of April 2016. 1. On ‘Nifty 50 Index’ stocks: i. Stocks that have witnessed the most exposure (value terms) by MF industry during the Month: Company Name Mkt Val (Rs Crs) Chg in Mkt Val Shares Chg in shares Held by no of schemes Market Cap (Rs Crs) on 30Apr'16 Apr-16 Mar-16 (Rs Crs) % Apr-16 Mar-16 Number % Apr-16 Mar-16 Diff HDFC Bank Ltd 24,335 22,702 1,633 7.19 21,49,02,649 21,19,44,601 29,58,048 1.40 576 569 7 2,86,398 Infosys Ltd 17,607 18,129 -523 -2.88 14,57,26,130 14,88,10,773 -30,84,643 -2.07 469 456 13 2,77,494 ICICI Bank Ltd 14,069 14,416 -348 -2.41 59,37,61,149 60,91,88,605 -1,54,27,456 -2.53 539 538 1 1,37,790 Axis Bank Ltd 10,760 10,640 120 1.13 22,77,84,174 23,95,57,251 -1,17,73,077 -4.91 466 468 -2 1,12,655 Larsen & Toubro Ltd 10,365 9,964 401 4.03 8,26,18,424 8,18,93,172 7,25,252 0.89 397 391 6 1,16,908 State Bank of India 8,601 8,845 -244 -2.76 45,50,61,359 45,53,23,960 -2,62,601 -0.06 364 366 -2 1,46,716 Reliance Industries Ltd 8,495 9,326 -831 -8.92 8,64,44,625 8,92,29,813 -27,85,188 -3.12 352 362 -10 3,18,521 Maruti Suzuki India Ltd 7,150 6,639 511 7.69 1,88,42,845 1,78,65,617 9,77,228 5.47 379 355 24 1,14,629 IndusInd Bank Ltd 7,017 6,236 781 12.52 6,69,05,012 6,44,52,992 24,52,020 3.80 320 319 1 62,410 ITC Ltd 6,594 6,784 -189 -2.79 20,29,40,524 20,66,69,058 -37,28,534 -1.80 406 400 6 2,61,494 ii. Stocks that have witnessed the highest growth in exposure in % quantity terms during the Month: Company Name Mkt Val (Rs Crs) Chg in Mkt Val Shares Chg in shares Held by no of schemes Market Cap (Rs Crs) on 30Apr'16 Apr-16 Mar-16 (Rs Crs) % Apr-16 Mar-16 Number % Apr-16 Mar-16 Diff Coal India Ltd 2,728 2,422 306 12.63 9,47,27,490 8,29,69,706 1,17,57,784 14.17 222 211 11 1,81,943 HDFC Ltd 5,160 4,714 446 9.47 4,74,06,638 4,26,35,151 47,71,487 11.19 272 268 4 1,71,958 Cipla Ltd 3,735 3,246 489 15.05 6,95,49,271 6,34,06,408 61,42,863 9.69 289 287 2 43,146 Idea Cellular Ltd 755 650 105 16.16 6,37,22,845 5,90,18,417 47,04,428 7.97 109 99 10 42,684 Mahindra & Mahindra Ltd 2,553 2,194 358 16.32 1,91,78,206 1,81,25,866 10,52,340 5.81 272 242 30 82,664 Maruti Suzuki India Ltd 7,150 6,639 511 7.69 1,88,42,845 1,78,65,617 9,77,228 5.47 379 355 24 1,14,629 Bajaj Auto Ltd 1,040 959 80 8.39 41,74,163 39,87,804 1,86,359 4.67 157 150 7 72,110 GAIL (India) Ltd 715 681 34 4.99 1,98,28,027 1,90,94,465 7,33,562 3.84 106 102 4 45,710 IndusInd Bank Ltd 7,017 6,236 781 12.52 6,69,05,012 6,44,52,992 24,52,020 3.80 320 319 1 62,410 Hindustan Unilever Ltd 1,498 1,451 47 3.22 1,72,57,610 1,66,84,938 5,72,672 3.43 185 181 4 1,87,808 iii. Stocks that are held by the maximum number of schemes during the month: Company Name Mkt Val (Rs Crs) Chg in Mkt Val Shares Chg in shares Held by no of schemes Market Cap (Rs Crs) on 30Apr'16 Apr-16 Mar-16 (Rs Crs) % Apr-16 Mar-16 Number % Apr-16 Mar-16 Diff HDFC Bank Ltd 24,335 22,702 1,633 7.19 21,49,02,649 21,19,44,601 29,58,048 1.40 576 569 7 2,86,398 ICICI Bank Ltd 14,069 14,416 -348 -2.41 59,37,61,149 60,91,88,605 -1,54,27,456 -2.53 539 538 1 1,37,790
- 2. RETAIL RESEARCH RETAIL RESEARCH P a g e | 2 Infosys Ltd 17,607 18,129 -523 -2.88 14,57,26,130 14,88,10,773 -30,84,643 -2.07 469 456 13 2,77,494 Axis Bank Ltd 10,760 10,640 120 1.13 22,77,84,174 23,95,57,251 -1,17,73,077 -4.91 466 468 -2 1,12,655 ITC Ltd 6,594 6,784 -189 -2.79 20,29,40,524 20,66,69,058 -37,28,534 -1.80 406 400 6 2,61,494 Larsen & Toubro Ltd 10,365 9,964 401 4.03 8,26,18,424 8,18,93,172 7,25,252 0.89 397 391 6 1,16,908 Maruti Suzuki India Ltd 7,150 6,639 511 7.69 1,88,42,845 1,78,65,617 9,77,228 5.47 379 355 24 1,14,629 State Bank of India 8,601 8,845 -244 -2.76 45,50,61,359 45,53,23,960 -2,62,601 -0.06 364 366 -2 1,46,716 Reliance Industries Ltd 8,495 9,326 -831 -8.92 8,64,44,625 8,92,29,813 -27,85,188 -3.12 352 362 -10 3,18,521 Sun Pharmaceuticals Industries Ltd 5,894 5,781 114 1.97 7,26,54,173 7,04,97,958 21,56,215 3.06 350 341 9 1,95,258 iv. Increased interest in the stocks by more schemes during April month: Company Name Mkt Val (Rs Crs) Chg in Mkt Val Shares Chg in shares Held by no of schemes Market Cap (Rs Crs) on 30Apr'16 Apr-16 Mar-16 (Rs Crs) % Apr-16 Mar-16 Number % Apr-16 Mar-16 Diff Mahindra & Mahindra Ltd 2,553 2,194 358 16.32 1,91,78,206 1,81,25,866 10,52,340 5.81 272 242 30 82,664 Maruti Suzuki India Ltd 7,150 6,639 511 7.69 1,88,42,845 1,78,65,617 9,77,228 5.47 379 355 24 1,14,629 Aurobindo Pharma Ltd 3,149 3,061 87 2.85 4,14,31,647 4,10,96,604 3,35,043 0.82 145 126 19 44,470 Bharti Infratel Ltd 162 160 2 1.50 43,18,978 41,77,211 1,41,767 3.39 63 48 15 71,116 Tata Steel Ltd 2,096 1,906 190 9.96 5,97,01,439 5,96,26,173 75,266 0.13 152 138 14 34,099 Tata Motors-DVR 4,289 4,228 60 1.43 14,40,07,973 14,66,30,350 -26,22,377 -1.79 163 149 14 15,142 Infosys Ltd 17,607 18,129 -523 -2.88 14,57,26,130 14,88,10,773 -30,84,643 -2.07 469 456 13 2,77,494 Coal India Ltd 2,728 2,422 306 12.63 9,47,27,490 8,29,69,706 1,17,57,784 14.17 222 211 11 1,81,943 Grasim Industries Ltd 3,480 3,197 283 8.86 85,15,282 83,16,046 1,99,236 2.40 205 194 11 38,148 Power Grid Corporation of India Ltd 3,570 3,398 172 5.07 24,89,75,751 24,42,97,041 46,78,710 1.92 224 213 11 75,021 2. On ‘Nifty Free Float Midcap 100 Index’ constituents: i. Stocks that have witnessed the most exposure (value terms) by MF industry during the Month: Company Name Mkt Val (Rs Crs) Chg in Mkt Val Shares Chg in shares Held by no of schemes Market Cap (Rs Crs) on 30Apr'16 Apr-16 Mar-16 (Rs Crs) % Apr-16 Mar-16 Number % Apr-16 Mar-16 Diff Bharat Electronics Ltd 2,280 2,385 -104 -4.37 1,92,94,077 1,94,83,589 -1,89,512 -0.97 149 142 7 28,364 Shree Cement Ltd 2,191 2,165 26 1.20 17,25,466 17,43,040 -17,574 -1.01 185 183 2 44,226 Bajaj Finance Ltd 2,112 2,239 -127 -5.68 30,92,245 32,33,553 -1,41,308 -4.37 115 115 0 36,790 Bajaj Finserv Ltd 1,921 1,754 167 9.53 1,02,45,862 1,02,51,584 -5,722 -0.06 92 80 12 29,843 Container Corporation Of India Ltd 1,813 1,687 126 7.47 1,34,03,207 1,35,69,891 -1,66,684 -1.23 117 112 5 26,377 Torrent Pharmaceuticals Ltd 1,711 1,620 92 5.67 1,19,65,148 1,20,83,673 -1,18,525 -0.98 109 108 1 24,203 The Ramco Cements Ltd 1,682 1,527 155 10.14 3,73,70,272 3,81,97,205 -8,26,933 -2.16 113 115 -2 10,717 TVS Motor Company Ltd 1,610 1,738 -127 -7.33 5,03,51,141 5,38,27,251 -34,76,110 -6.46 65 78 -13 15,194 Voltas Ltd 1,479 1,380 99 7.21 5,03,98,368 4,96,12,158 7,86,210 1.58 92 89 3 9,712 Procter & Gamble Hygiene and Health 1,449 1,441 7 0.51 22,94,487 22,93,740 747 0.03 73 67 6 20,497 ii. Stocks that have witnessed the highest growth in exposure in % quantity terms during the Month: Company Name Mkt Val (Rs Crs) Chg in Mkt Val Shares Chg in shares Held by no of schemes Market Cap (Rs Crs) on 30Apr'16 Apr-16 Mar-16 (Rs Crs) % Apr-16 Mar-16 Number % Apr-16 Mar-16 Diff NHPC Ltd 109 16 93 587.25 5,26,17,578 65,51,538 4,60,66,040 703.13 20 16 4 22,861 Reliance Infrastructure Ltd 53 12 42 351.95 9,92,502 2,21,641 7,70,861 347.80 15 16 -1 14,163
- 3. RETAIL RESEARCH RETAIL RESEARCH P a g e | 3 IDBI Bank Ltd 7 2 5 222.84 9,98,982 3,09,210 6,89,772 223.08 8 7 1 14,278 Jubilant Life Sciences Ltd 2 1 1 79.91 53,087 28,339 24,748 87.33 5 3 2 6,362 Cairn India Ltd 189 146 43 29.20 1,29,98,004 94,90,080 35,07,924 36.96 66 64 2 27,214 Apollo Hospitals Enterprise Ltd 26 19 7 34.62 1,98,272 1,45,434 52,838 36.33 20 19 1 18,255 Tata Elxsi Ltd 115 87 28 32.41 6,00,789 4,59,920 1,40,869 30.63 19 16 3 5,946 Adani Power Ltd 56 48 9 17.89 1,75,86,149 1,38,78,407 37,07,742 26.72 12 11 1 10,685 Canara Bank 525 410 115 27.94 2,54,85,890 2,15,86,709 38,99,181 18.06 39 37 2 11,183 L&T Finance Holdings Ltd 180 141 39 27.67 2,50,69,008 2,20,34,152 30,34,856 13.77 25 22 3 12,563 iii. Stocks that are held by the maximum number of schemes during the month: Company Name Mkt Val (Rs Crs) Chg in Mkt Val Shares Chg in shares Held by no of schemes Market Cap (Rs Crs) on 30Apr'16 Apr-16 Mar-16 (Rs Crs) % Apr-16 Mar-16 Number % Apr-16 Mar-16 Diff Shree Cement Ltd 2,191 2,165 26 1.20 17,25,466 17,43,040 -17,574 -1.01 185 183 2 44,226 Bharat Electronics Ltd 2,280 2,385 -104 -4.37 1,92,94,077 1,94,83,589 -1,89,512 -0.97 149 142 7 28,364 Container Corporation Of India Ltd 1,813 1,687 126 7.47 1,34,03,207 1,35,69,891 -1,66,684 -1.23 117 112 5 26,377 Bajaj Finance Ltd 2,112 2,239 -127 -5.68 30,92,245 32,33,553 -1,41,308 -4.37 115 115 0 36,790 The Ramco Cements Ltd 1,682 1,527 155 10.14 3,73,70,272 3,81,97,205 -8,26,933 -2.16 113 115 -2 10,717 Gujarat State Petronet Ltd 1,178 1,209 -31 -2.58 8,55,57,251 8,55,32,028 25,223 0.03 112 110 2 7,757 Torrent Pharmaceuticals Ltd 1,711 1,620 92 5.67 1,19,65,148 1,20,83,673 -1,18,525 -0.98 109 108 1 24,203 Oracle Financial Services Software Ltd 1,087 1,158 -71 -6.11 30,13,141 32,80,916 -2,67,775 -8.16 101 99 2 30,626 Mahindra & Mahindra Financial Serv Ltd 1,267 1,112 155 13.93 4,22,27,817 4,55,67,084 -33,39,267 -7.33 97 90 7 17,063 Arvind Ltd 801 802 -1 -0.07 2,88,93,532 2,93,37,584 -4,44,052 -1.51 95 82 13 7,162 iv. Increased interest in the stocks by more schemes during April month: Company Name Mkt Val (Rs Crs) Chg in Mkt Val Shares Chg in shares Held by no of schemes Market Cap (Rs Crs) on 30Apr'16 Apr-16 Mar-16 (Rs Crs) % Apr-16 Mar-16 Number % Apr-16 Mar-16 Diff United Breweries Ltd 623 616 8 1.23 81,77,774 74,42,501 7,35,273 9.88 76 59 17 20,151 Arvind Ltd 801 802 -1 -0.07 2,88,93,532 2,93,37,584 -4,44,052 -1.51 95 82 13 7,162 Bajaj Finserv Ltd 1,921 1,754 167 9.53 1,02,45,862 1,02,51,584 -5,722 -0.06 92 80 12 29,843 Petronet LNG Ltd 1,294 1,167 127 10.91 4,91,11,600 4,65,41,997 25,69,603 5.52 83 71 12 19,766 MphasiS Ltd 675 653 21 3.23 1,37,87,890 1,32,87,874 5,00,016 3.76 88 79 9 10,284 Power Finance Corporation Ltd 392 339 54 15.80 2,18,64,076 1,97,62,020 21,02,056 10.64 49 40 9 23,675 Biocon Ltd 325 257 69 26.76 55,54,264 53,07,176 2,47,088 4.66 47 39 8 11,708 Bharat Electronics Ltd 2,280 2,385 -104 -4.37 1,92,94,077 1,94,83,589 -1,89,512 -0.97 149 142 7 28,364 Mahindra & Mahindra Fin Services Ltd 1,267 1,112 155 13.93 4,22,27,817 4,55,67,084 -33,39,267 -7.33 97 90 7 17,063 Procter & Gamble Hygiene and Health 1,449 1,441 7 0.51 22,94,487 22,93,740 747 0.03 73 67 6 20,497
- 4. RETAIL RESEARCH RETAIL RESEARCH P a g e | 4 3. On ‘Nifty Free Float Smallcap 100 Index’ constituents: i. Stocks that have witnessed the most exposure (value terms) by MF industry during the Month: Company Name Mkt Val (Rs Crs) Chg in Mkt Val Shares Chg in shares Held by no of schemes Market Cap (Rs Crs) on 30Apr'16 Apr-16 Mar-16 (Rs Crs) % Apr-16 Mar-16 Number % Apr-16 Mar-16 Diff Whirlpool of India Ltd 837 795 41 5.20 1,12,01,323 1,13,20,012 -1,18,689 -1.05 54 53 1 9,477 eClerx Services Ltd 769 746 24 3.18 58,29,466 57,38,776 90,690 1.58 28 28 0 5,383 K E C International Ltd 758 743 15 2.01 6,03,87,638 6,07,49,236 -3,61,598 -0.60 51 52 -1 3,227 Greaves Cotton Ltd 749 697 52 7.44 5,59,16,175 5,66,52,505 -7,36,330 -1.30 36 37 -1 3,272 NIIT Technologies Ltd 556 610 -53 -8.77 1,18,39,133 1,22,71,142 -4,32,009 -3.52 53 55 -2 2,874 Muthoot Finance Ltd 523 474 49 10.40 2,57,43,521 2,64,95,718 -7,52,197 -2.84 32 32 0 8,104 Hexaware Technologies Ltd 520 615 -96 -15.53 2,15,37,252 2,28,66,757 -13,29,505 -5.81 42 41 1 7,280 ALSTOM India Ltd 514 499 15 2.96 81,10,862 82,16,611 -1,05,749 -1.29 46 48 -2 4,260 BEML Ltd 490 542 -52 -9.61 53,19,436 51,92,155 1,27,281 2.45 49 46 3 3,835 Shoppers Stop Ltd 422 396 25 6.34 1,09,48,123 1,09,11,376 36,747 0.34 19 19 0 3,213 ii. Stocks that have witnessed the highest growth in exposure in % quantity terms during the Month: Company Name Mkt Val (Rs Crs) Chg in Mkt Val Shares Chg in shares Held by no of schemes Market Cap (Rs Crs) on 30Apr'16 Apr-16 Mar-16 (Rs Crs) % Apr-16 Mar-16 Number % Apr-16 Mar-16 Diff Godrej Properties Ltd 23 4 19 441.05 6,89,604 1,46,505 5,43,099 370.70 7 3 4 7,354 Fortis Healthcare Ltd 2 1 1 104.36 1,34,918 65,684 69,234 105.40 4 3 1 8,112 Tata Elxsi Ltd 115 87 28 32.41 6,00,789 4,59,920 1,40,869 30.63 19 16 3 5,946 Eros International Media Ltd 1 1 0 33.64 66,530 54,530 12,000 22.01 2 2 0 1,729 Gujarat Narmada Valley Ferti & Chem Ltd 42 30 13 42.94 42,37,970 36,17,183 6,20,787 17.16 5 2 3 1,547 Bajaj Electricals Ltd 151 111 40 35.94 65,80,339 58,31,722 7,48,617 12.84 17 11 6 2,311 IFCI Ltd 40 35 6 15.98 1,58,44,023 1,41,04,023 17,40,000 12.34 7 6 1 4,238 Inox Wind Ltd 294 273 21 7.84 1,08,27,508 1,05,28,495 2,99,013 2.84 48 49 -1 6,032 Indian Bank 191 198 -7 -3.66 1,95,99,755 1,90,90,755 5,09,000 2.67 24 24 0 4,683 Jain Irrigation Systems Ltd 80 77 3 3.92 1,31,32,661 1,28,04,661 3,28,000 2.56 13 13 0 2,707 iii. Stocks that are held by the maximum of schemes during the month: Company Name Mkt Val (Rs Crs) Chg in Mkt Val Shares Chg in shares Held by no of schemes Market Cap (Rs Crs) on 30Apr'16 Apr-16 Mar-16 (Rs Crs) % Apr-16 Mar-16 Number % Apr-16 Mar-16 Diff Kaveri Seed Company Ltd 226 234 -7 -3.19 57,21,388 61,89,784 -4,68,396 -7.57 55 56 -1 2,731 Whirlpool of India Ltd 837 795 41 5.20 1,12,01,323 1,13,20,012 -1,18,689 -1.05 54 53 1 9,477 NIIT Technologies Ltd 556 610 -53 -8.77 1,18,39,133 1,22,71,142 -4,32,009 -3.52 53 55 -2 2,874 K E C International Ltd 758 743 15 2.01 6,03,87,638 6,07,49,236 -3,61,598 -0.60 51 52 -1 3,227 BEML Ltd 490 542 -52 -9.61 53,19,436 51,92,155 1,27,281 2.45 49 46 3 3,835 Inox Wind Ltd 294 273 21 7.84 1,08,27,508 1,05,28,495 2,99,013 2.84 48 49 -1 6,032 ALSTOM India Ltd 514 499 15 2.96 81,10,862 82,16,611 -1,05,749 -1.29 46 48 -2 4,260 Gujarat Mineral Development Corp 226 213 13 6.04 3,26,31,530 3,26,31,530 - 0.00 45 45 0 2,205 Hexaware Technologies Ltd 520 615 -96 -15.53 2,15,37,252 2,28,66,757 -13,29,505 -5.81 42 41 1 7,280 TV18 Broadcast Ltd 325 334 -9 -2.70 8,38,39,114 8,28,48,114 9,91,000 1.20 37 36 1 6,643
- 5. RETAIL RESEARCH RETAIL RESEARCH P a g e | 5 iv. Increased interest in the stocks by more schemes during April month: Company Name Mkt Val (Rs Crs) Chg in Mkt Val Shares Chg in shares Held by no of schemes Market Cap (Rs Crs) on 30Apr'16 Apr-16 Mar-16 (Rs Crs) % Apr-16 Mar-16 Number % Apr-16 Mar-16 Diff Polaris Consulting & Services Ltd 19 25 -5 -21.67 10,02,198 13,16,040 -3,13,842 -23.85 18 12 6 1,973 Bajaj Electricals Ltd 151 111 40 35.94 65,80,339 58,31,722 7,48,617 12.84 17 11 6 2,311 Godrej Properties Ltd 23 4 19 441.05 6,89,604 1,46,505 5,43,099 370.70 7 3 4 7,354 BEML Ltd 490 542 -52 -9.61 53,19,436 51,92,155 1,27,281 2.45 49 46 3 3,835 Chambal Fertilisers & Chemicals Ltd 131 117 15 12.60 2,16,07,783 2,12,70,186 3,37,597 1.59 28 25 3 2,533 Tata Elxsi Ltd 115 87 28 32.41 6,00,789 4,59,920 1,40,869 30.63 19 16 3 5,946 Gujarat Narmada Valley Ferti & Chem 42 30 13 42.94 42,37,970 36,17,183 6,20,787 17.16 5 2 3 1,547 National Buildings Construction Corp 128 122 6 4.69 12,75,390 12,93,181 -17,791 -1.38 26 24 2 11,992 Whirlpool of India Ltd 837 795 41 5.20 1,12,01,323 1,13,20,012 -1,18,689 -1.05 54 53 1 9,477 Hexaware Technologies Ltd 520 615 -96 -15.53 2,15,37,252 2,28,66,757 -13,29,505 -5.81 42 41 1 7,280 4. On ‘Nifty Infrastructure Index’ constituents: i. Stocks that have witnessed the most exposure (value terms) by MF industry during the Month: Company Name Mkt Val (Rs Crs) Chg in Mkt Val Shares Chg in shares Held by no of schemes Market Cap (Rs Crs) on 30Apr'16 Apr-16 Mar-16 (Rs Crs) % Apr-16 Mar-16 Number % Apr-16 Mar-16 Diff Larsen & Toubro Ltd 10,365 9,964 401 4.03 8,26,18,424 8,18,93,172 7,25,252 0.89 397 391 6 1,16,908 Power Grid Corporation of India Ltd 3,570 3,398 172 5.07 24,89,75,751 24,42,97,041 46,78,710 1.92 224 213 11 75,021 Bharti Airtel Ltd 3,537 3,459 78 2.26 9,72,68,836 9,85,94,849 -13,26,013 -1.34 216 210 6 1,45,345 NTPC Ltd 2,359 2,171 188 8.65 16,93,64,517 16,85,22,273 8,42,244 0.50 122 127 -5 1,14,859 Container Corporation Of India Ltd 1,813 1,687 126 7.47 1,34,03,207 1,35,69,891 -1,66,684 -1.23 117 112 5 26,377 Adani Ports & Special Economic Zone Ltd 1,566 1,693 -127 -7.49 6,57,58,773 6,83,55,882 -25,97,109 -3.80 148 159 -11 49,330 Voltas Ltd 1,479 1,380 99 7.21 5,03,98,368 4,96,12,158 7,86,210 1.58 92 89 3 9,712 Siemens Ltd 1,301 1,253 49 3.88 1,14,38,393 1,13,92,561 45,832 0.40 76 76 0 40,519 CESC Ltd 1,194 1,073 120 11.23 2,21,65,040 2,27,01,677 -5,36,637 -2.36 55 55 0 7,138 Idea Cellular Ltd 755 650 105 16.16 6,37,22,845 5,90,18,417 47,04,428 7.97 109 99 10 42,684 ii. Stocks that have witnessed the highest growth in exposure in % quantity terms during the Month: Company Name Mkt Val (Rs Crs) Chg in Mkt Val Shares Chg in shares Held by no of schemes Market Cap (Rs Crs) on 30Apr'16 Apr-16 Mar-16 (Rs Crs) % Apr-16 Mar-16 Number % Apr-16 Mar-16 Diff NHPC Ltd 109 16 93 587.25 5,26,17,578 65,51,538 4,60,66,040 703.13 20 16 4 22,861 Reliance Infrastructure Ltd 53 12 42 351.95 9,92,502 2,21,641 7,70,861 347.80 15 16 -1 14,163 Adani Power Ltd 56 48 9 17.89 1,75,86,149 1,38,78,407 37,07,742 26.72 12 11 1 10,685 JSW Energy Ltd 61 58 3 5.22 90,61,041 83,82,601 6,78,440 8.09 19 18 1 11,103 Idea Cellular Ltd 755 650 105 16.16 6,37,22,845 5,90,18,417 47,04,428 7.97 109 99 10 42,684 Reliance Power Ltd 227 210 17 8.13 4,45,21,779 4,24,65,898 20,55,881 4.84 27 27 0 14,292 Bharti Infratel Ltd 162 160 2 1.50 43,18,978 41,77,211 1,41,767 3.39 63 48 15 71,116 Power Grid Corporation of India Ltd 3,570 3,398 172 5.07 24,89,75,751 24,42,97,041 46,78,710 1.92 224 213 11 75,021 IRB Infrastructure Developers Ltd 485 519 -34 -6.57 2,27,17,810 2,23,24,008 3,93,802 1.76 54 53 1 7,509 Voltas Ltd 1,479 1,380 99 7.21 5,03,98,368 4,96,12,158 7,86,210 1.58 92 89 3 9,712
- 6. RETAIL RESEARCH RETAIL RESEARCH P a g e | 6 iii. Stocks that are held by the maximum of schemes during the month: Company Name Mkt Val (Rs Crs) Chg in Mkt Val Shares Chg in shares Held by no of schemes Market Cap (Rs Crs) on 30Apr'16 Apr-16 Mar-16 (Rs Crs) % Apr-16 Mar-16 Number % Apr-16 Mar-16 Diff Larsen & Toubro Ltd 10,365 9,964 401 4.03 8,26,18,424 8,18,93,172 7,25,252 0.89 397 391 6 1,16,908 Power Grid Corporation of India Ltd 3,570 3,398 172 5.07 24,89,75,751 24,42,97,041 46,78,710 1.92 224 213 11 75,021 Bharti Airtel Ltd 3,537 3,459 78 2.26 9,72,68,836 9,85,94,849 -13,26,013 -1.34 216 210 6 1,45,345 Adani Ports & Special Economic Zone Ltd 1,566 1,693 -127 -7.49 6,57,58,773 6,83,55,882 -25,97,109 -3.80 148 159 -11 49,330 NTPC Ltd 2,359 2,171 188 8.65 16,93,64,517 16,85,22,273 8,42,244 0.50 122 127 -5 1,14,859 Container Corporation Of India Ltd 1,813 1,687 126 7.47 1,34,03,207 1,35,69,891 -1,66,684 -1.23 117 112 5 26,377 Idea Cellular Ltd 755 650 105 16.16 6,37,22,845 5,90,18,417 47,04,428 7.97 109 99 10 42,684 Tata Power Company Ltd 444 456 -12 -2.56 6,30,16,942 7,05,25,604 -75,08,662 -10.65 99 107 -8 19,068 Voltas Ltd 1,479 1,380 99 7.21 5,03,98,368 4,96,12,158 7,86,210 1.58 92 89 3 9,712 Tata Communications Ltd 679 643 36 5.58 1,64,39,720 1,70,35,046 -5,95,326 -3.49 89 88 1 11,776 iv. Increased interest in the stocks by more schemes during April month: Company Name Mkt Val (Rs Crs) Chg in Mkt Val Shares Chg in shares Held by no of schemes Market Cap (Rs Crs) on 30Apr'16 Apr-16 Mar-16 (Rs Crs) % Apr-16 Mar-16 Number % Apr-16 Mar-16 Diff Bharti Infratel Ltd 162 160 2 1.50 43,18,978 41,77,211 1,41,767 3.39 63 48 15 71,116 Power Grid Corporation of India Ltd 3,570 3,398 172 5.07 24,89,75,751 24,42,97,041 46,78,710 1.92 224 213 11 75,021 Idea Cellular Ltd 755 650 105 16.16 6,37,22,845 5,90,18,417 47,04,428 7.97 109 99 10 42,684 Larsen & Toubro Ltd 10,365 9,964 401 4.03 8,26,18,424 8,18,93,172 7,25,252 0.89 397 391 6 1,16,908 Bharti Airtel Ltd 3,537 3,459 78 2.26 9,72,68,836 9,85,94,849 -13,26,013 -1.34 216 210 6 1,45,345 Container Corporation Of India Ltd 1,813 1,687 126 7.47 1,34,03,207 1,35,69,891 -1,66,684 -1.23 117 112 5 26,377 NHPC Ltd 109 16 93 587.25 5,26,17,578 65,51,538 4,60,66,040 703.13 20 16 4 22,861 Voltas Ltd 1,479 1,380 99 7.21 5,03,98,368 4,96,12,158 7,86,210 1.58 92 89 3 9,712 Engineers India Ltd 488 461 27 5.82 2,72,18,268 2,71,11,114 1,07,154 0.40 71 69 2 6,041 Tata Communications Ltd 679 643 36 5.58 1,64,39,720 1,70,35,046 -5,95,326 -3.49 89 88 1 11,776 Analyst: Dhuraivel Gunasekaran (dhuraivel.gunasekaran@hdfcsec.com) Source: NAVIndia.com RETAIL RESEARCH Tel: (022) 3075 3400 Fax: (022) 2496 5066 Corporate Office HDFC securities Limited, I Think Techno Campus, Building - B, "Alpha", Office Floor 8, Near Kanjurmarg Station, Opp. Crompton Greaves, Kanjurmarg (East), Mumbai 400 042 Phone: (022) 3075 3400 Fax: (022) 2496 5066 Website: www.hdfcsec.com Email: hdfcsecretailresearch@hdfcsec.com. Disclaimer: Mutual Funds investments are subject to risk. Past performance is no guarantee for future performance.This document has been prepared by HDFC Securities Limited and is meant for sole use by the recipient and not for circulation. This document is not to be reported or copied or made available to others. It should not be considered to be taken as an offer to sell or a solicitation to buy any security. The information contained herein is from sources believed reliable. We do not represent that it is accurate or complete and it should not be relied upon as such. We may have from time to time positions or options on, and buy and sell securities referred to herein. We may from time to time solicit from, or perform investment banking, or other services for, any company mentioned in this document. This report is intended for non-Institutional Clients. This report has been prepared by the Retail Research team of HDFC Securities Ltd. The views, opinions, estimates, ratings, target price, entry prices and/or other parameters mentioned in this document may or may not match or may be contrary with those of the other Research teams (Institutional, PCG) of HDFC Securities Ltd. HDFC Securities Ltd. is a SEBI Registered Research Analyst having registration no. INH000002475.