2. 2106 • Social Forces 88(5)
ment levels and often serve as tools for private enrichment of politicians (Shleifer
and Vishny 1994). Moreover, political screening is a persistent feature of party
recruitment for the managerial elite (Bian et al. 2001). On the other hand, there
is some indication that political capital may still have a positive impact on firm eq-
uity value and measures of firm performance (Peng and Luo 2000). This suggests
that politically connected firms can secure positional advantages over unconnected
firms, even if overall firm productivity might be lower. Such advantages may be
most pronounced under tight resource constraints.
To identify whether economic actors and firms actually secure advantage
through reliance on political capital, our analysis examines in what institutional
domains political connections might be substantively helpful to the firm’s chances
for survival and profitability. This approach also allows us to identify what features
of the institutional environment contribute to either preserving or reducing the
value of political capital. We define institutional domains as distinct institutional
arrangements that enable and guide economic transactions. These include eco-
nomic markets ranging from competitive markets to state-controlled markets, and
political markets such as public service provision and regulatory supervision of
markets. Broadly, our use of institutional domain is similar to Scott and Meyer’s
(1991) conception of “societal sectors” in their analysis of the variability of institu-
tional elements that shape the environment in which organizational actors interact.
Two distinct entrepreneurial types coexist, and both seem to prosper in their
own ways: There are purely competitive players – often active in privately organized
markets and knowledge-intensive sectors – who refuse any type of political network-
ing. The general manager of a computer company in Zhejiang province rejected the
idea of playing the “game of politics,” and explained, “In my sector, the government
cannot give me much, not much tax breaks, and not much government contracts.”
In contrast, there are many who invest heavily in political networking through
party donations, active involvement as party secretaries or vice deputies, invitations
to government officials to serve on so-called “expert committees” and maintaining
close social ties with local government authorities. These entrepreneurs often regard
their political connections as their most important asset.
Evidently, assessments of the pervasiveness and sources of political capital
advantages need to go beyond aggregate claims of whether political capital is
diminished or augmented in departures from state socialism. We focus on distinct
transaction outcomes across a broad spectrum of company activities to compare
the value of political capital in different institutional domains of China’s market
economy. A transaction is defined as any action that involves an exchange of an en-
tity – such as a commodity, reward, sentiment, opinion or information – from one
actor to another (Homans 1974; Greif 2006). A transaction-focused institutional
analysis shifts attention to examine the nature of the institutional arrangements
in which economic actors compete and cooperate to secure rewards. An advantage
of a focus on distinct transactions is that it allows for a more nuanced view of the
3. Political Capital in a Market Economy • 2107
fungibility of political capital. This also provides a fresh approach to assess the
claim that in transition economies political connections continue to be highly
fungible “not only despite, but because of marketization.”(Parish and Michelson
1996:1045) Aggregate, society-wide claims about the value of political connec-
tions would be rejected if the fungibility of political capital varied in the context
of discrete institutional domains in which firms actually transact. We argue instead
that in a market economy the fungibility of political capital corresponds with the
extent to which government controls economic activity.
What is Political Capital?
Political capital shares with other forms of capital the quality of being produc-
tive insofar as it makes possible the realization of interests, which would not be
achieved otherwise; and its fungibility is like physical capital, limited to specified
conditions. Although it shares these attributes with physical and human capital,
political capital is more similar to social capital in that these forms of capital ac-
cumulate in relational ties. As Coleman (1988:98) observed, the differentiating
feature of social capital is that it “inheres in the structure of relations between
actors and among actors.” Unlike social capital, however, political capital has the
additional feature of being linked to the positional power of the politician, and
thus it is rooted in institutional structures of the political order. When politicians
transact with other politicians, their cumulative investment in political capital
embeds itself both in the institutional arrangement of political exchange and in
ongoing relationships among political actors. For example, Shepsle and Weingast
(1987) show that the custom of deference and reciprocity among politicians in
Congress is enforced by the institutional mechanism of ex post veto by commit-
tees as a way of explaining the effectiveness of committees. An anecdote they use
illustrates the exchange, “Sure, I let those people over on Education and Labor
do pretty much what they think is reasonable. And they do the same for us on
Armed Services. That’s the way things are done around here.”(100) This custom
of deference and reciprocity is maintained by institutionalized norms and rules
that enable enforcement of subcommittee autonomy. Thus the quality of informal
and formal institutions contributes to the productivity and fungibility of political
connections (Evans 1995; Nee and Opper 2007).
Another dimension of political capital’s existence in relationships has to do
with the ties that connect politicians with their constituencies. The common-
sense rendition of this aspect of political capital emphasizes the public’s approval
or disapproval of a politician’s performance. A politician gains political capital
through successful policies. But the approval rating of a politician is ephemeral,
whereas political capital is embedded in a more enduring manner in concrete
relationships with constituents. In these relationships, obligations, expectations
and trust stem from social exchange in which a politician does something for
a constituent and trusts that he or she will reciprocate in the future. This, over
4. 2108 • Social Forces 88(5)
time, establishes an expectation. If a politician accumulates a large volume of
credit via these political favors, then the analogy to economic capital is clear.
Political capital in this view is both productive and fungible, and importantly,
because it inheres in the relationship, both politician and constituent can se-
cure gains by maintaining the relationship. Further, political connections serve
as conduits of information, with information flow favoring rent-seekers with
the inside track to the politician. The institution of lobbying operates on the
fungibility and productiveness of political connections as the basis of mutual
expectations, obligations, trust and timely information.
As a form of capital, the distinguishing feature of political capital is that it is
embedded in social relationships and in political institutions. This duality, existing
as an attribute of both positional power and relational ties, means that analysis
of political capital must incorporate a focus on the institutional context in which
transactions are conducted. To specify the productivity and fungibility of political
capital, the focus of analysis needs to examine transactions between economic and
political actors in concrete institutional domains of the economy.
Of Markets and Political Connections
Our approach draws on new institutionalism in economic sociology in its fo-
cus on the effect of the institutional environment on firm behavior (Nee 2005).
Organizations are responsive to the nature of the resource and power arrange-
ments in the institutional environment (Pfeffer and Salancik 1978; DiMaggio and
Powell 1983; Fligstein 2001). This suggests variability in the responses of firms
to their institutional environment. For example, Meyer, Scott and Strang (1987)
and Strang (1987) examine the effects of expanding federal and state involvement
in education on the administrative complexity of local school districts. They show
that the level of school district administrative complexity depends on the relative
level and scope of federal, state and local funding. An analogous pattern of close
coupling of administrative complexity and fiscal budgets of central, provincial and
local governments exists in China (Whiting 2000).
In command economies, the state assumed monopoly power over the alloca-
tion of all resources. Productive assets from farmland to factories were owned and
managed by the state, which set prices by administrative fiat to control the al-
location of resources. Clearly, under the central plan government bureaucrats and
party officials maintained an overwhelming advantage in power over economic ac-
tors. A firm’s access to resources and its bargaining over production quotas mainly
depended on positional advantage stemming from political connections with
planning authorities. In decentralized market transactions, terms of exchange are
determined by both sellers and buyers. The gradual replacement of state planning
by market allocation gives rise to a self-reinforcing empowerment of the consumer
as an economic actor. This endogenously motivates strategic adjustments by firms
to the emergent market economy, which in turn undermine the previous institu-
5. Political Capital in a Market Economy • 2109
tional foundations of firm survival. Whether firms choose to rely on organizational
improvements, superior exploitation of assets, higher innovativeness or minimized
“time to market”, markets shift the focus to the importance of capabilities, as op-
posed to investing in positional advantage through political capital.
The greater importance that firm managers put on the development of firm ca-
pabilities is evidenced by rapid strategic changes in China’s economy. Widespread
experimentation with new organizational forms, gradual divestiture of state own-
ership and the emergence of new property arrangements illustrate the search for
a better fit between firm strategy and external environment (Nee 1992). Before
the start of economic reforms in 1978, China’s industrial sector was made up of
only two organizational forms (state-owned enterprises and collective enterprises).
Now, China’s national statistics differentiate 10 distinct organizational forms
in the urban industrial sector (National Bureau of Statistics of China). Rapidly
expanding research budgets, employee training, patenting activities and shortened
product life cycles signal that firms actively seek to develop new capabilities to gain
and secure competitive advantages in market niches. China’s national research and
development expenditures, for example, increased from .8 percent to 1.3 percent
of gross domestic product between 1999 and 2003. Further, more than 60 percent
of R&D funds are provided by firms themselves (National Bureau of Statistics/
Ministry of Science and Technology 2005).
Concurrent with these trends, organizational autonomy embedded in decen-
tralized markets enables economic actors to construct informal arrangements
that build from the ground up the informal institutions of a private enterprise
economy. From informal lending arrangements that provide private capital for
start-up firms to far-flung supply and distribution networks, informal economic
institutions are constructed to facilitate the expansion of private-sector entre-
preneurial activities challenging the state-controlled economy from below. With
the continuing expansion of markets, the economic success of firms becomes
increasingly independent of the direct involvement of politicians. Vertical ties
linking economic actors in firms with the state decline in significance as horizon-
tal ties – interfirm networks and network ties between buyers and sellers based
on repeat exchange – gain in importance. In other words, the embedded nature
of economic transaction shifts from self-enforcing reliance on vertical political
connections characteristic of state socialism (Whyte and Parish 1984) to self-
reinforcing investment in horizontal network ties that sociologists emphasize as
the basis of social capital in market economies (Uzzi 1996).
Our core hypothesis is: The more competitive markets replace state allocation of
scarce resources and services, the less the value of political capital.
Political capital, as a fungible form of capital, has greatest value in those insti-
tutional domains where government restricts economic activity. The stronger the
government’s commitment to introduce competitive markets in an industrial and
commercial sector, the more the value of political capital will decline in that sector.
6. 2110 • Social Forces 88(5)
During departures from state socialism, the declining value of political capital
is triggered by shifts in parameters that combine and interact to cause change in
the firm’s institutional environment. On the one hand, subsidies for loss-making
state-owned enterprises, for example, decreased from 25 percent of government
expenditures in 1985 to 2 percent in 2000 (National Bureau of Statistics of China
2001). On the other hand, by 2005 private firms produced more than 50 percent of
China’s GDP, and accounted for more than 75 percent of exports (National Bureau
of Statistics of China 2006). Our hypothesis expects that political capital will be less
fungible in transactions that are based on market competition. The shift from state
to market allocation did not occur at the same speed and to the same extent across
the spectrum of economic activities and sectors, however. The value of a firm’s politi-
cal capital may therefore vary across distinct types of institutional domains and may
continue to play a decisive role in distinct transactions. In partly liberalized markets
where the state tightly controls market entry or remains involved as a market actor,
firms with political capital are likely to secure preferential treatment.
Parameter shifts in the institutional environment, however, do not rule out
that political actors also adapt and profit from new elite opportunities stem-
ming from marketization. In political markets, political actors can still provide
positional advantages by channeling government spending to clients, using tax
and industrial policies to regulate market entry and exit. As Walder (2003:900)
asserts the “decline of bureaucratic allocation in the face of market reform does
not imply a decline of elite opportunity.” He believed that the state’s still consid-
erable redistributive and regulatory power allows the creation of new sources of
power, “as regulators of markets and private enterprises, brokers and middlemen
for market transactions, managers or consultants in public, market-oriented
enterprise…”(Walder 1996:1063) Preferential treatment in rule enforcement
and regulatory markets would then provide the political elite with vast oppor-
tunities to create “new market value for official discretion.”(Walder 2003:901)
This line of reasoning reinforces the view that politically connected managers
are advantaged in operating companies (Róna-Tas 1994). Despite considerable
empirical research on the effect of political capital on individual- and household-
level earnings, results remained inconclusive (Nee 1989, 1996; Róna-Tas 1994;
Bian and Logan 1996; Xie and Hannum 1996; Gerber 2006; Zhou 2000; Wu
2002; Zang 2002; Walder and Nguyen 2008). Particularly initial conditions, ex-
tent of markets, structural change and industrial growth seem to have influenced
different effects on income (Keister 2009).
To detect more directly the inherent value of positional advantages stemming
from political connections requires a focus on the specific institutional domains
where firms compete for survival and profits, and transact to secure resources. Our
empirical tests examine transactions across a broad spectrum of firm activities
in different institutional domains representing varying levels of marketization
and state control. Analysis of distinct types of transactions allows us to discern
7. Political Capital in a Market Economy • 2111
variability in the fungibility of political capital across the different institutional
domains in which firms engage in routine economic activities.
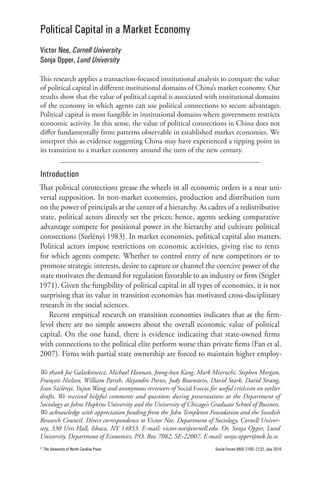
Institutional Domains in China’s Market Economy
Our analysis of political capital seeks to cover a representative set of distinct trans-
actions and their outcomes in various institutional domains to examine whether
the value of political capital varies with the extent to which resource allocation
remains bounded by the redistributive economy. Our focus is on typical transac-
tions in daily business operations, which can substantively affect a firm’s survival.
The transition to a market economy is an uneven evolutionary process. Thus,
we selected three institutional domains, which reflect high, moderate and low
levels of marketization (see Figure 1). First, we include the product market as the
most competitive institutional domain of China’s economy. Private enterprise
participation in the product market is consistently high, with only a few state mo-
nopolies remaining, such as that for tobacco. Our dataset includes none of these
monopolies. A provincial marketization index developed by China’s National
Economic Research Institute confirms that the product market is the most liberal-
ized, with a mean level of 7.84 points out of 10 across all provinces in the year
2003 (Fan and Wang 2003). In addition, we examine two partially liberalized
market sectors sequentially according to increasing degrees of state controls in
resource allocation: the credit market and the market for government contracts.
In the credit market, liberalization of commercial banking has proceeded
slowly. In spite of the market-entry of foreign-invested banks and private do-
mestic banks, the credit market is still heavily state-controlled. At the time of
the survey, more than 70 percent of deposits and loans were accounted for by
the four largest state-owned commercial banks. Only 1 percent of loans by state
commercial banks were allocated to private-sector entrepreneurs, signalling a
severe imbalance given the high proportion of the industrial and commercial
output by private enterprises (Datastream). The NERI-marketization index con-
firms slow liberalization. With a mean value of 2.67 out of 10 in 2002, credit
allocation occupied the lowest level of marketization of all 22 categories covered
by the index.
In the market for government contracts, political connections easily undermine
competitive bidding guidelines. In this sense, the market for government contracts
can be readily used to redistribute rents to most-favored bidders with political
connections. This market thus exemplifies an institutional domain where the
government acts as a monopolist. China’s firm managers are generally interested
in securing government contracts because the government is a trustworthy client.
Firms with regular government contracts reduce substantively their market risk.
The market for land use rights is an alternative example of this type of institutional
domain. Both markets display similar features wherein government bureaus act as
monopolist and enjoy undivided control rights over resources.
8. Figure 1
2112 • Social Forces 88(5)
Figure 1. Institutional Domains in the Economic Market
Fully Marketized Product Market
Credit Market
Market for Government Contracts
Weakly Marketized
(public bidding)
In spite of considerable regional variation, the relative ranking of marketization for
these three institutional domains is invariant across China. Hence, product markets
are in general the most marketized regardless of whether we explore product markets
in Ningxia or in Zhejiang provinces. Similarly, markets for government contracts are
in general ranked lowest in terms of marketization. If marketization and the value of
political capital are negatively correlated as specified in our core hypothesis, we would
expect to find little or no effect of political capital in the highly marketized product
market, while political capital can be expected to still provide positional advantages
in institutional domains of the economy where the state remains either the dominant
supplier (credit market) or customer (government contracts).
Naturally, economic success of firms does not only depend on markets for private
Figure 2
goods. Equally important, regulatory markets can critically affect firm performance
and survival chances. Our comparative institutional analysis therefore also incorpo-
rates institutional arrangements for rule enforcement and regulatory markets. The
expectation is that network advantages and political ties are more likely to secure
preferential treatment (Róna-Tas 1994; Parish and Michelson 1996).
Open Access Government Quality and Rule Enforcement
First we look at whether firms with political capital receive better government
services, and benefit from improved rule enforcement (see Figure 2). Specifically,
we explore how transacting with political capital affects the days needed for
custom clearance, fines from regulatory inspection and the bribery by local tax
inspectors. All these transactions contribute toe.g., Licenses and facilitate strate-
Rationed
Regulatory Markets; calculability
gic planning. Preferential treatment in these areas could substantively increase a
firm’s survival chances. In the mid-1980s, for example, cursory reports indicate
that local cadres and tax officers squeezed entrepreneurs to increase their office
or personal income. Often managers cultivated political connections to protect
their businesses from overtaxing and expropriation (Parris 1993).
An even stronger test case is the market for government regulation. Similar
to markets for private goods, the regulatory market and related opportunity for
rent-seeking have a competitive element. Firms invest time, effort and financial
9. Figure 2
Political Capital in a Market Economy • 2113
Figure 2. Institutional Domains in the Political Market
Open Access Government Quality and Rule Enforcement
Regulatory Markets; e.g., Licenses
Rationed
resources to compete for permits and licences. If, in addition, government officials
enjoy some discretionary power in deciding on license allocations, the firm’s efforts
as well as its political connections may become decisive factors for success (Krueger
1974). Typical cases of transactions in the regulatory market we review include the
firms’ access to export licenses, tax exemptions and the cost of business licenses.
If our tests indicate that firms do not compete on a level playing field and that
political connections provide a competitive edge in firm-government transactions,
the regulatory market mechanism is bound to be suspect.
Research Design and Empirical Test
Resource dependence shapes a firm’s interactions with its environment (Pfeffer
and Salancik 1978). This suggests variability in a diverse sample of organizational
forms and industrial sectors in firm-level responses. We use data from the 2003
World Bank Investment Climate Survey, which provides an in-depth account of
2,400 firms of different legal status – state-owned, collective, private and foreign.
The survey is based on a random sample of cities and firms, stratified first on sub-
sectors, which were selected to represent the most important (in terms of contribu-
tion to national GDP) industries and service sectors, and then on location. Overall,
18 middle-sized and large cities were chosen, broadly covering all regions of China,
including highly marketized cities in the coastal areas as well as less competitive,
lagging industrial cities in the northeast and northwestern regions.
Part one of the survey covers factual information on company activities, politi-
cal capital and government relations. Questionnaires were filled out in face-to-face
interviews with senior managers of the respective establishments. Part two of the
interview was conducted with the firm’s accountant, who provided quantitative
information on costs, expenditures, and asset evaluations (for a thorough discus-
sion of the survey, see Dollar et al. 2004).
The overall ownership structure of the sample of firms resembles the general
distribution of legal ownership forms (Table 1). Due to the urban focus of the
10. 2114 • Social Forces 88(5)
Table 1 Distribution of Legal Ownership Type of Firms, in 2002
Table 1:
Total Firm
Sample Firms % Population %
State-owned enterprise 26 16
Collective and cooperative firm 16 21
Non-publicly traded shareholding companies 18 17
Private, non-listed firms 28 27
Joint ventures and subsidiaries of multinational firms 10 8
Others* 2 11
*A residual category which includes wholly foreign owned companies, limited liability
companies, individually owned companies.
Source: Investment Climate Survey 2003 and National Statistical Bureau of China.
Table 2
Variable Observations Mean SD
World Bank survey, however, the proportion of state-owned firms is significantly
Private Goods
Sales growth in in the total firm population, whereas the 1,746 category of “others,”
higher than 2002* residual 60.58 805.9
Credit accesssmall individual firms, is considerably smaller. The industrial structure
including (dummy = 1 if firm has a formal bank 1,714 .23 .42
loan)
provides a mix of labor-intensive, capital-intensive and knowledge-driven produc-
Sales to government (dummy =1 if firm secures 1,765 .22 .42
tion, which approximates the country’s overall production structure.
government contracts)
Government Quality we focus Enforcement on the non-state firms in the sample (n
In this study, and Rule our analysis
Average days for custom clearance rights, government authorities seek7.70 maintain
= 1764). By virtue of property 698 and 11.54
Inspection fines (total costs of fines/ in 1000 RMB)) focus on1,752
direct ties with state-owned enterprises. A 15.13 250.71
non-state firms provides a
Local tax inspectors require gifts/bribes 1,765 .27 .444
more reliable measure of the value of a firm’s acquired stock of political capital.
(dummy = 1, if yes)
Regulatory Markets of observations varies across our estimation models due to
The total number
Firm holds occurrence of firm-level = 1 if yes)
varying an export license (dummy transactions and incomplete data on some items.
1,685 .23 .420
Firm enjoys tax exemptions (dummy = 1 if yes) 1,763 .25 .434
Price of getting a business registration (total of fee and 598 126.13 1,482.826
Dependent Variables
bribes / in 1000 RMB)
We test for positional advantage stemming from political connections in a range
of institutional domains: economic markets, administrative service provision and
Table 3 markets. We measure outcomes through a set of three discrete transac-
regulatory
tional variables in each domain. Our aim was to define outcome variables, which
Variable Observations Mean SD
are quantifiable, in order to contain the risk of a subjective perception bias. Table
Political Ties summary statistics of the selected variables.
2 provides
CEO holds formal position in the party 1,731 .31 .46
(dummy = 1 if yes)
CEO previously held government position
Economic Markets 1,752 .06 .23
(dummy = growth is a key transaction-focused measure assessing a firm’s ability to
(1. Sales 1 if yes)
Government involvement in CEO appointment 1,744 .16 .37
(dummy = 1 if share and to survive in the respective product market. (2. Obtaining
win market yes)
Government support index firm’s6access to secure external1,715
formal credit signals a (over categories) finance in the.64
banking 1.21
sec-
Company
tor. Given the standard assumption in lending research that firms generally need
Log of firm age 1,764 2.24
external finance, one can assume that any firm would have formal bank credit .68
Log of sales value in 2001 1,747 8.93 2.25
if credit could be secured (Uzzi 1999). (3. Getting government contracts reduces
Log of total assets in 2001 1,692 8.15 2.40
Debt equityrisks by2001
market ratio in securing reliable and solvent customers. Moreover, government
1,678 2.86 19.91
Capital labor typically allow for higher profit margins. With less than 20 percent of
contracts ratio 1,719 161.65 2,399.04
Location in industrial park (dummy = 1 if yes) 1,739 .30 .46
Listed firm (dummy = if yes) 1,744 .03 .17
Government ownership 1,763 7.20 23.79
Management
11. Political Capital in a Market Economy • 2115
Table 2: Summary Statistics for Dependent Variables
Variable Observations Mean SD
Private Goods
Sales growth in 2002* 1,746 60.58 805.9
Credit access (dummy = 1 if firm has a formal bank 1,714 .23 .42
loan)
Sales to government (dummy = 1 if firm secures 1,765 .22 .42
government contracts)
Government Quality and Rule Enforcement
Average days for custom clearance 698 7.70 11.54
Inspection fines (total costs of fines/ in 1,000 RMB) 1,752 15.13 250.71
Local tax inspectors require gifts/bribes 1,765 .27 .444
(dummy = 1, if yes)
Regulatory Markets
Firm holds an export license (dummy = 1 if yes) 1,685 .23 .420
Firm enjoys tax exemptions (dummy = 1 if yes) 1,763 .25 .434
Price of getting a business registration (total of fee and 598 126.13 1,482.826
bribes / in 1,000 RMB)
*We use sales growth in the most recent year covered in the survey (instead of using an average
over all survey years) in order to be able to include absolute sales volume in preceding years as a
control variable.
Source: Investment Climate Survey 2003
public projects going through a public bidding process in 1998, rents distributed
through the market of government contracts are substantial (Yang 2004).
Government Quality or Public Service Provision and Rule Enforcement
(1. Days needed for custom clearance involves transactions enabling a firm to export
goods in a timely and efficient manner. Delays can lead to loss of clients and
weakens the firm’s competitiveness in international trade. (2. Inspection fines were
in China a common instrument to discriminate against new private start-ups and
other non-state firms (Parris 1993). The absolute amount of inspection fines there-
fore indicates whether political capital is still helpful in dealing with inspections by
local administrators. (3. Corruption is an endemic feature of China’s bureaucracy.
Whether local tax inspectors require gifts or bribes provides a measure of “hidden”
transaction costs assessing the illegitimate and illegal use of political connections
in standard administrative procedures. Political capital can lessen a firm’s reliance
on bribery to secure resources and service from government (Cao et al. 2005).
Regulatory Markets
(1. Export licenses allow a firm to conduct international trade. If a firm is unable
to secure an export license, it must rely on authorized state trading companies,
resulting in higher transaction costs. (2. Tax exemptions are a common industrial
policy instrument to support firm development. If a firm can secure tax exemp-
12. 2116 • Social Forces 88(5)
tions from local government, this helps the firm’s chances of survival during the
critical start-up stage. (3. If regulators drive up registration costs or discriminate
against applicants based on economic or political factors, the cost of getting a
business license can serve as a market entry barrier.
Independent Variables
Rent-seeking activity involves firms using their political capital to secure most-favored
treatment from government as a means to increase profits (Krueger 1974). Previous
studies measured political capital by indicating whether the CEO is a party member
or current or former government official (Fan et al. 2007). Political capital at the
firm level, however, is likely to be embedded in multiple dimensions of the firm’s
organizational structure. A broader set of measures allows us to examine the various
channels through which political capital can work to a firm’s competitive advantage.
In our dataset, about 31 percent of CEOs indicate that they hold a position
as party secretary or deputy party secretary, which is consistent with the national
trend of political screening and communist party recruitment of the managerial
elite (Bian et al. 2001).
Former government bureaucrats who leave their positions as part of China’s
xia hai policy are likely to continue to have extensive ties with government. We
therefore use a dummy variable to indicate whether the firm’s CEO previously
held a government position. Overall, 5.6 percent of the CEOs in the sample had
held government positions.
Government routinely appoints the top managers of state-owned firms. The
practice is also commonplace in corporatized and privatized firms in which the
government retains partial ownership. Managers appointed directly by government
are likely to have good political connections. In our sample, the government was
involved in 16 percent of the recruitment decisions for managers of non-state firms.
Another measure of political capital is whether a firm receives “government
support” in acquiring resources and services (Ayyagari et al. 2008). Not every
firm benefits from government assistance; hence a firm’s ability to secure direct
government assistance signals it has fungible political capital. The survey includes
six typical fields of local government support (locating foreign technology; ob-
taining bank financing; identifying foreign investors, foreign clients, foreign sup-
pliers and domestic clients). Assistance in these areas is among the most sought
after services, which companies need to support domestic and global growth and
development. For these measures of political capital it does not matter whether
government assistance was provided through formal channels and procedures, or
rests on informal network-based support. We construct an index (ranging from
0 to 6) of government assistance received in all six fields of support. Overall, 32
percent (546) of respondents reported receiving some kind of government as-
sistance over the past business year. Most of these respondents report that they
have received government assistance in identifying potential domestic clients (n =
13. Political Capital in a Market Economy • 2117
308). It should be noted that government assistance does not guarantee successful
outcomes. In this sense, we are not running the risk of including a tautological
independent variable. In sum, government support signals that the firm is on
good terms with bureaucrats and politicians. It can also be interpreted as a signal
of otherwise not explicitly revealed political capital.
Pairwise correlation coefficients ranging from -.01 to .23 confirm that these
selected measures capture different dimensions of firm-based political capital.
Table 3 provides summary statistics for all independent variables. We have checked
Pearson correlation statistics and variance inflation factors, and can rule out multi-
collinearity concerns. Throughout, we have ensured that the joint use of these
measures does not have a dampening effect on any single measure. Hence, we only
report complete models instead of stepwise results.
Control Variables
We introduce a set of control variables to differentiate positional advantages stem-
ming from political capital from other potentially confounding effects that may
influence transactions in the institutional domains we examine.
Company-specific Capital
Firm age: The firm’s age may affect outcomes in regulatory and economic markets.
Older firms, for example, will naturally have a more extensive inter-firm network
than younger, recently founded firms.
Firm size: Not only may firm size influence a firm’s market position, but larger
firms are also more attractive to extract rents. In order to capture potentially con-
founding effects of firm size, we include the lagged natural logarithm of a firm’s
sales value (in Model 1, in order to control the sales level in the preceding year)
and assets (models 2 -9) of the preceding period.
Capital structure: Financial leverage is positively correlated with a firm’s ca-
pability development. Because financial leverage may stem from a firm’s use of
political connections in securing loans from state-owned banks, we include the
debt-to-asset ratio.
Industry: Because many regulations and industrial policies are sector specific,
we included industrial dummy variables indicating 14 different sectors. Another
dummy variable signals whether a firm is located in an industrial or technology
park. Such parks benefit from favorable government treatment and have other
political capital advantages. Further, we include a firm’s capital-to-labor ratio. As
China’s industrial policy shifts the industrial structure away from labor-intensive
production, a firm’s production technology may have an impact on the value of
political connections. We control whether a firm is listed on one of China’s two
stock exchanges. Listed firms comprise key enterprises, singled out to be the
mainstay of economic development. We also control for government ownership,
as public ownership shares may strengthen a firm’s ability to seek political support.
14. 2118 • Social Forces 88(5)
Politicians and government officials are usually more willing to distribute rents to
fully or partly state-owned enterprises (Shleifer and Vishny 1994). Ten percent of
the firms included in our sample indicate partial state-ownership shares.
Human Capital and Incentive Structure
We also control for professional competence of firm managers and for manage-
ment’s incentive structure.
Manager education: Whether managers act in an entrepreneurial and innovative
manner or as rent-seekers may be tied to educational attainment. Moreover, edu-
cation is positively associated with high-ranking party positions and the ability to
secure political rents. To separate educational attainment from political power, we
include a dummy variable which indicates whether the CEO has college education.
Manager tenure: The managers’ tenure may not only determine firm-specific
human capital, but long-time managers may be in a better position to secure gov-
ernment help – they have had more time to develop a broader political network
reflecting firm-specific needs.
Incentive contract: Incentive contracts are a common corporate governance
device, but are uncommon when governments remain involved in recruitment
decisions or when former government employees are recruited.
Regional Control Variables
We included a set of regional, provincial and city-level controls that could affect
outcomes in distinct transactions and also the market value of political capital.
Regional context: Five control variables sort China into main regions (coastal,
central, northeast, northwest and southwest). Coastal China, the most liberalized
and developed region, is our benchmark.
Provincial-level marketization: Provincial control variables for marketization
(NERI-Index) are useful, as most of our survey firms operate at the provincial
and even national level.
City-level economic development: Finally, we include the natural logarithm of
per capita GDP at the city-level, as local economic development may not only
affect outcomes in various transactions but also a firm’s ability to benefit from
political capital.
Model Specification
The stratified nature of the survey, with 100 to 150 observations each in 18 mu-
nicipalities, calls for caution not to overlook confounding city-level effects. It is
not unlikely that firms within a geographical context may be more similar than
firms in other municipalities, due to local economic, political and also cultural fac-
tors. Within-city variation in the estimated errors would thus potentially bias the
standard errors downwards. Multi-level analysis appears as a standard approach
to separate regional from individual effects. The asymptotic maximum likelihood
15. Price of getting a business registration (total of fee and 598 126.13 1,482.826
bribes / in 1000 RMB)
Political Capital in a Market Economy • 2119
Table 3
Table 3: Summary Statistics for Independent Variables
Variable Observations Mean SD
Political Ties
CEO holds formal position in the party 1,731 .31 .46
(dummy = 1 if yes)
CEO previously held government position 1,752 .06 .23
(dummy = 1 if yes)
Government involvement in CEO appointment 1,744 .16 .37
(dummy = 1 if yes)
Government support index (over 6 categories) 1,715 .64 1.21
Company
Log of firm age 1,764 2.24 .68
Log of sales value in 2001 1,747 8.93 2.25
Log of total assets in 2001 1,692 8.15 2.40
Debt equity ratio in 2001 1,678 2.86 19.91
Capital labor ratio 1,719 161.65 2,399.04
Location in industrial park (dummy = 1 if yes) 1,739 .30 .46
Listed firm (dummy = if yes) 1,744 .03 .17
Government ownership 1,763 7.20 23.79
Management
CEO has college education (dummy = 1 if yes) 1,754 .80 .40
Tenure of CEO 1,747 6.19 4.41
CEO has incentive contract (dummy = 1 if yes) 1,764 .27 .45
Regional Controls
Provincial level marketization of product market (NERI) 1,764 8.43 1.03
Provincial level marketization of credit market (NERI) 1,764 3.34 2.93
Overall provincial level marketization index (NERI) 1,764 6.08 1.77
Log value of per capita GDP (City level) 1,764 9.65 .60
Source: Investment Climate Survey 2003; Fan and Wang 2003; National Statistical Bureau of China
2003.
estimation methods used in multi-level analysis, however, require a minimum
sample size. Simulation studies confirmed that the standard errors of the second
level variances (here city effects) are estimated too small when the number of
groups is substantially lower than 100 (Maas and Hox 2005), although 30 clusters
are often indicated as a minimum number of groups (Kreft and De Leuuw 1998).
Given the relatively small number of only 18 cities, we therefore chose to estimate
city-clustered standard errors instead of using multi-level estimations. Our choice
is further justified as we find mainly relatively low intraclass correlation in our
sample (between 0 and 4 percent) (Twisk 2006). Low intra-class correlation is
most likely caused by broad organizational heterogeneity at the individual level,
which overrules regional effects.
We use the following reduced form model.
Yi = β0 + β1Pi + β2 Zi + ar + as + εi
16. 2120 • Social Forces 88(5)
Y denotes the specified outcome variable of transactions in nine distinct institu-
tional domains. P denotes a vector of dimensions of political capital. Z is a vector
of firm-level control variables covering company characteristics and management
features likely to influence the outcome variables. In addition we control for
region (ar) and sector (as). The variety of outcome variables involves OLS and
Probit models.
Results
Table 4 presents our findings for the three institutional domains in the economic
market. For sales growth in the highly competitive product market (Model 1),
firms with political capital seem not to have positional advantage. None of the
different dimensions of political capital has a significant positive effect on sales
growth. Firms with CEOs appointed by the government even have a disadvantage
in sales development. Clearly, this finding does not yet suggest a negative causality.
Without longitudinal data we cannot rule out that poorly performing companies
simply invite government involvement in recruitment decisions to help mitigate
bad company performance. Our results indicate that political capital is not associ-
ated with positive growth effects in the product market. To confirm the robustness
of the model we experimented with log values of sales growth, but our results
remain unchanged. We also explored whether political capital may potentially
work through other forms of priority treatment. The inclusion of additional ex-
planatory variables such as the availability of tax exemptions, sales contracts with
government and trade licenses, however, does not affect our findings. Also the
explanatory power of Model 1 remains the same.
Another consideration is that gains from political connections could also be
linked to a firm’s market-based competencies. On the one hand, local govern-
ments might be more willing to support economically capable firms; on the other
hand, capable firms might be in a better position to transform political support
into market success. In order to explore a potential relation between market-
based competencies and the value of political capital, we have calculated different
measures of firm innovativeness to proxy firm capabilities. First we have included
into our benchmark model a firm’s share of new products in total sales (t – 1)
and added corresponding interaction effects with our political capital measures.
Secondly, we have conducted the same exercise with an index of firm innovative-
ness (covering the opening of new business lines: product, process, management
and quality control innovations over a three-year period from 1999 to 2001).
Our estimation results did not indicate that firms with stronger market-based
competencies realize higher payoffs from their political capital.
In contrast, political capital has a significant impact on economic transac-
tions in the state-controlled credit market (Model 2). Government support is
positively associated with success in securing formal bank loans. And as expected,
political connections provide the strongest competitive advantage in the market
17. Political Capital in a Market Economy • 2121
Table 4
Table 4: Economic Markets and the Role of Political Ties
Model 3
Model 1 Model 2 Sales to
Sales Growth Credit Access Government
* Coefficient Coefficient Coefficient
(t-ratio) (z-ratio) (z-ratio)
Political Ties
CEO holds a party position 26.60 .15 .03
(1.13) (1.60) (.43)
CEO previously held government 79.31 -.03 .31*
position (.82) (-0.17) (1.94)
Government involvement in CEO -59.76** -.13 .002
appointment (-2.41) (-1.06) (.02)
Government support index -11.52 .09*** .15***
(-1.17) (2.54) (3.32)
Company
Log firmage 12.00 -.09* -.11**
(1.21) (-1.86) (-2.20)
Log sales (lagged) -76.85*
(-2.10)
Log assets (lagged) .18*** -.002
(6.72) (-.10)
Debt equity ratio (lagged) .411 -.002 -.001
(.91) (-1.75) (-0.48)
Capital labor ratio .57*** -.0003* -.001**
(3.44) (-1.81) (-2.50)
Located in industrial park 107.38 .07 -.14*
(1.16) (1.14) (-1.66)
Listed company -32.27 .48** .48**
(-.51) (2.30) (2.04)
Government ownership shares .85* -.002 .002
(2.04) (-.28) (1.45)
Sector (14 industries) YES* YES*** YES*
Management
CEO holds university degree 59.15 -.19 .32***
(1.37) (-1.34) (3.21)
Log of CEO tenure -45.58* .10** -.003
(-1.77) (2.13) (-.06)
CEO has incentive contract -21.08 .17* .281***
(-.54) (1.77) (3.71)
Location
Region YES* YES YES
Log pc GDP (city level) 31.04 -.14* -.103**
(.93) (-1.13) (-1.97)
Marketization of commodity 88.54
market (1.39)
Marketization of credit market .15**
(2.39)
Marketindex -.06
(-1.45)
Constant -413.42 -2.01 .49
(-.71) (-1.21) (.66)
Method OLS Probit Probit
R2/ pseudo R2
2 2 .18 .16 .11
N 1,503 1,447 1,496
*p < .10 **p < .05 ***p < .01; standard errors are clustered on city.
18. 2122 • Social Forces 88(5)
for government contracts (Model 3). One of our interviewees in the Yangzi delta
region indicated, “Competitive bidding is just a form… Political connections are
still as important as before… If some senior government official gives a signal
we will get the project. Sometimes we lose bids, because someone else gets the
nod from a senior official.” Two measures of political capital confirm significant
positive effects on a firm’s percentage of sales to the government. First of all, good
standing with local government as indicated by the government support index
provides advantages in securing government contracts. Moreover, managers with
a previous career as a government bureaucrat increase a firm’s ability to secure
government contracts. Our interviews confirmed that many former bureaucrats
who left their government positions and took jobs as CEOs systematically built
on their insider networks to cultivate political connections in order to secure
government contracts. Some of these businesses were even founded on the idea of
becoming a major government supplier and to thereby reduce market risk in the
highly competitive commodity market.
The persistent value of positional advantage in non-marketized or only partially
marketized sectors of the economy may invite inferences on persisting or even in-
creasing value of political capital in the political market. Our results on rule enforce-
ment (Table 5), however, indicate that firms with politically connected CEOs do
not enjoy a systematic advantage when it comes to rule enforcement. Only in one
case do former government officials seem to enjoy advantages, when it comes to
timely custom clearance of export goods (Model 4). However, in the same model,
our estimates indicate that government-appointed CEOs have to expect on average
three days more for custom clearance. We suspect that the delay in custom clearance
may be related to specific product types. The negative effect actually disappears if we
attach a lower weight to outliers and run robust regressions. Estimation results of
Model 5 indicate that the total amount of inspection fines depends neither on politi-
cal capital nor on key characteristics of the company or management. Estimations
with alternative dependent variables such as the ratio between total inspection fines
in relation to total business costs confirm these results. Model 6 displays another
unexpected finding. Firms with a good standing with the government – as indicated
by the government support index – seem to experience more cases of bribery in
their dealings with local tax inspectors. However, both the level of significance and
the marginal effect are relatively low. It is notable that neither political capital nor
company features such as size, age and industry help to explain how individual firms
are treated by administrative authorities.
The extremely low explanatory power of models 5 and 6 requires some clarifica-
tion. Based on extensive interviews we conducted with municipal bureaucrats and
entrepreneurs, we interpret these findings as a signal of increasing fairness and
unbiased treatment of economic actors. Ultimately, in a rule-based economy, the
total amount of inspection fines is determined by the individual cases of detected
misdemeanor, but not by general company characteristics or political capital. In
19. Table 5
Table 5: Rule Enforcement and Political Ties
Model 4
Average Days for
Local Custom Model 5 Model 6
Clearance of Export Inspection Local Tax Inspectors
Goods Coefficient Fines (Absolute) Require Gifts/ Bribes
(t-ratio) Coefficient (t-ratio) Coefficient (z-ratio)
Political Ties
CEO holds a party position .28 5.78 .04
(.17) (.50) (.43)
CEO previously held government -2.82* 31.20 .07
position (-1.96) (.72) (.45)
in specific transaction outcomes.
Government involvement in CEO 3.39** -6.51 .10
appointment (2.31) (-.80) (1.14)
Government support index -.35 -1.03 .05*
(-1.24) (-.33) (1.92)
Company
Log firmage .11 -19.55 -.07
(.16) (-1.27) (-1.08)
Log assets (lagged) -.67** -.32 -.02
(-2.58) (-.14) (-1.03)
Debt equity ratio (lagged) .05** .21 .001
(2.14) (.74) (.99)
advantages in the institutional domain of regulatory markets.
Capital labor ratio .002* -.001 .0001*
(2.07) (-.24) (1.84)
Located in industrial park .70 -25.70 -.11
(.46) (-1.56) (-1.32)
Listed company 1.86 -6.71 -.01
(1.14) (-.67) (-.05)
Government ownership shares -.01 -.06 -.001
(-.65) (-.67) (-.37)
vides an even stronger test of its fungibility in political markets (Table 6). In
contrast to the claim that the political elite rely on opportunities embedded in the
to our analysis of rule enforcement, however, is that management network ties
this sense the low explanatory power could reflect a case-by-case treatment based
with government and firm characteristics obviously capture little of the variation
on a review of the specific facts and circumstances. The focal finding with respect
we find no systematic evidence that companies with political connections enjoy
regulatory roles of the state to compensate for a decline in redistributive power,
Analysis of the effects of political capital in different regulatory markets pro-
Sector (14 industries) YES*** YES YES**
Political Capital in a Market Economy • 2123
Management
CEO holds university degree -2.64* 9.08 .05
(-2.08) (.49) (.35)
Log of CEO tenure -.08 1.16 .002
20. Log assets (lagged) -.67** -.32 -.02
(-2.58) (-.14) (-1.03)
Debt equity ratio (lagged) .05** .21 .001
(2.14) (.74) (.99)
Capital labor ratio .002* -.001 .0001*
Table 5 (2.07) (-.24) (1.84)
Table 5 continued park
Located in industrial .70 -25.70 -.11
(.46)
Model 4 (-1.56) (-1.32)
Listed company 1.86
Average Days for -6.71 -.01
(1.14)
Local Custom (-.67)
Model 5 (-.05)
Model 6
Government ownership shares -.01
Clearance of Export -.06
Inspection -.001
Local Tax Inspectors
Goods(-.65)
Coefficient Fines (-.67)
(Absolute) Require(-.37) Bribes
Gifts/
2124 • Social Forces 88(5)
Sector (14 industries) YES***
(t-ratio) YES
Coefficient (t-ratio) YES**
Coefficient (z-ratio)
Management
Political Ties
CEO holds university degree
a party position -2.64*
.28 9.08
5.78 .05
.04
(-2.08)
(.17) (.49)
(.50) (.35)
(.43)
CEO previously held
Log of CEO tenure government -2.82*
-.08 31.20
1.16 .07
.002
position (-1.96)
(-.18) (.72)
(.27) (.45)
(.07)
Government involvement in
CEO has incentive contract CEO 3.39**
-.46 -6.51
27.13 .10
.03
appointment (2.31) (-.80) (1.14) officials in securing tax exemptions.
(-.42) (1.21) (.32)
Government support index
Location -.35 -1.03 .05*
Region (-1.24)
YES* (-.33)
YES (1.92)
YES
Company
Log pc GDP -2.93* -1.79 .26***
Log firmage .11
(-2.11) -19.55
(-.47) -.07
(4.72)
Marketization index (.16)
-2.17 (-1.27)
.20 (-1.08)
-.01
Log assets (lagged) -.67**
(-1.37) -.32
(.04) -.02
(-.17)
Constant (-2.58)
66.267** (-.14)
88.55 (-1.03)
-2.86***
Debt equity ratio (lagged) .05**
(2.85) .21
(99.41) .001
(-4.16)
Method (2.14)
OLS (.74)
OLS (.99)
Probit
2 2
Capital labor ratio .002* -.001 .0001*
R2/ pseudo R2 .14 .01 .04
N (2.07)
594 1,490(-.24) (1.84)
1,496
.70
*p < .10 in industrial ***p < .01; standard errors are clustered on city.
Located **p < .05 park -25.70 -.11
(.46) (-1.56) (-1.32)
Listed company 1.86 -6.71 -.01
(1.14) (-.67) (-.05)
Government ownership shares -.01 -.06 -.001
(-.65) (-.67) (-.37)
trade through the traditional foreign trade system operating through state-run
of firms which do not currently export, but find this effect confirmed. While we
with government involvement in CEO recruitment decisions are less likely (the
In two cases, we find slight disadvantages for politically connected firms. Firms
CEOs, we suspect that these managers feel a stronger pressure to continue to
marginal effect is 8 percent) to hold an export license (Model 7), which would
do not expect any arbitrary discrimination of firms with government-appointed
panies. We have also re-estimated Model 7 for a reduced sample under exclusion
trading companies. Model 8 suggests similar disadvantages for former government
allow the firm to directly conduct foreign trade without involving trading com-
Sector (14 industries) YES*** YES YES**
Management
CEO holds university degree -2.64* 9.08 .05
(-2.08) (.49) (.35)
Log of CEO tenure -.08 1.16 .002
21. Political Capital in a Market Economy • 2125
Overall, firm age, size, production technology and industry are the central
determinants explaining the granting of export licenses and tax exemptions. This
is in line with China’s industrial policy guidelines, which specify certain company
features as prerequisites for access to trade and tax exemptions in order to actively
promote the modernization of the economy. Model 9 complements this overall
impression and underscores that the price of business registrations is not affected
by company characteristics or political capital.
Skeptics might object that political connections came to full play at earlier stages
of market transition and have helped to build up specific company characteristics
that now – at an advanced stage of transition – independently yield positive effects
on transaction outcomes. Company size, for example, might theoretically be the
result of earlier asset appropriations in the course of privatization policies. While
clear counter evidence would require time-series data covering earlier periods of
China’s transition, some observations contradict this idea. First, company size does
not create a general advantage, but is only associated with advantages in four out of
nine models (see tables 4-6). Secondly, company size and the examined measures
of political capital are only moderately correlated, with a negative correlation for
former government officials. Even exclusion of company size as a control variable
would not substantially affect our results for political capital. Hence, we do not see
evidence for lasting economic advantages due to potential asset accumulation of
politically connected firms in prior periods. Clearly, the weak correlation between
firm size and political capital in the survey year does not rule out that political
connections may have played a more decisive role during the firms’ founding
process. The main emphasis of our study, however, is to compare the current value
of political connections in different types of institutional domains. As the qualities
of institutional domains have gradually changed in the course of market transition,
our results do not invite inferences on earlier stages of development.
A final note of caution should be added, which we share with the whole em-
pirical literature studying the economic value of political connections. While we
believe that we have provided the best possible approximation of political capital,
we cannot rule out that specific state-firm connections are simply not revealed by
the available survey data. Firms may possess direct linkages through relatives or
acquaintances of key personnel or owners, which are not covered by the World
Bank survey instrument. However, “not revealed” or “hidden” political connec-
tions will most likely be correlated with at least one of the dimensions of political
capital captured in our model. It is unlikely that firms without any formal party
association and government assistance systematically possess informal connections
that would create otherwise unrecognised advantages.
Robustness Test
We consider three robustness issues. First, we checked whether our OLS results
were driven by outliers or predictor variables with high leverage. Robust regres-
22. Table 6
Table 6: Regulatory Market and Political Ties
Model 9
Costs for Obtaining
a Business
Registration Over
Model 7 Model 8 P Two Years
Last
2126 • Social Forces 88(5)
Firm Holds an Firm Enjoys (Including Fees,
Export Licensea Tax Exemption Gifts, Bribes etc.)
Coefficient (z-ratio) Coefficient (z-ratio) Coefficient (t-ratio)
Political Ties
CEO holds a party position -.15 -.11 -372.87
(-1.59) (-.81) (-1.37)
CEO previously held government -.16 -.30* -559.55
position (0.69) (-1.78) (-.94)
Government involvement in CEO -.42*** -.14 -13.06
appointment (-3.46) (-1.26) (-.08)
Government support index .05 .02 20.55
(1.24) (.46) (.56)
advantages for firms with political connections.
Company
Log firmage -.16** -.18** 129.48
(-2.10) (-2.43) (1.11)
Log assets (lagged) .24*** .18*** 61.60
(7.66) (5.94) (.94)
Debt equity ratio (lagged) -.001 -.002 .37
(-.33) (-1.10) (.43)
Capital labor ratio -.0001** -.0001*** -.42
(-2.34) (-2.68) (-1.02)
Located in industrial park .29*** .63*** 257.53
(3.42) (5.51) (1.12)
Listed company .08 .25 2,153.76
in cultivating national brands and global players. To mitigate the risk of reverse
causality, we have experimented with different lagged performance measures (such
It is possible that political capital may have different effects depending on the
sions, however, generally confirmed our findings and did not indicate systematic
as return on assets) as additional control variables, but our substantive findings
become more valuable for top performers thanks to the government’s interest
poorly performing firms facing bankruptcy, or alternatively, political capital might
firm’s economic performance. Political connections may be easier to activate for
Secondly, reverse causality is a potential risk when using cross sectional datasets.
(.27) (.97) (.99)
remained unaffected. Also, our findings are confirmed for a subsample of loss-
Government ownership share .001 .002 2.52
(.43) (.97) (.81)
Sector (14 industries) YES*** YES*** YES
Management
CEO holds university degree .69*** .18 -168.48
23. Political Capital in a Market Economy • 2127
making firms. Theoretically, there is also a chance that firms which are performing
weakly in the specified market settings respond by recruiting new CEOs with
viable government ties. If such a selection effect actually existed, our estimation
results would possibly not reveal positive effects of political capital. To rule out
such concerns, we have explored whether our results still hold up if firms with
recently recruited CEOs (we experimented with tenure of up to 5, 3 or 1 years)
are excluded from the sample. Overall, our general findings were confirmed.
While our model specification controlled for economic development, we cannot
rule out that advantages stemming from political connections may not still be linked
with it. Responding to the question whether economic advantages of political capital
vary with economic development, we repeated our analysis for a subsample of cit-
-168.48
292.528
89.390
(-.40))
(-1.02)
(1.12)
(.99)
(.81)
(-1.06)
(.96)
(1.26)
(.44)
(-.83)
257.53
2,153.76
2.52
174.64
.13
-111.35
-901.01
YES
YES
OLS
523
.63***
YES***
.002
(-1.58)
(-2.68)
(5.51)
(.97)
(.97)
(1.19)
(-.14)
(-.69)
(.30)
(-.19)
Probit
.25
-.01
-.07
.22
.03
-.02
-2.41
YES
.18
1,477
***p < .01; standard errors are clustered on city.
.29***
.29***
-6.61***
YES***
.001
(-5.19)
.15*
(-2.34)
(3.42)
(.27)
(.43)
(4.34)
(-.14)
(.09)
(3.21)
(1.93)
Probit
.69***
YES*
.08
-.01
.01
.33
1,434
Government ownership share
CEO holds university degree
CEO has incentive contract
Located in industrial park
Sector (14 industries)
Marketization Index
Log of CEO tenure
**p < .05
Listed company
R2 / pseudo R2
2
Management
Log pc GDP
Location
Constant
Method
Region
*p < .10
2
N