Hinrich Foundation Sustainable Trade Index-Infographic
•
0 likes•395 views

For more information, please visit: http://ow.ly/4ne7To The Hinrich Foundation Sustainable Trade Index was created for the purpose of stimulating meaningful discussion of the full range of considerations that policy makers, business executives, and civil society leaders must take into account when managing and advancing international trade.

Recommended
More Related Content
Similar to Hinrich Foundation Sustainable Trade Index-Infographic
Similar to Hinrich Foundation Sustainable Trade Index-Infographic (20)
More from The Economist Media Businesses
More from The Economist Media Businesses (20)
Recently uploaded
Recently uploaded (20)
Hinrich Foundation Sustainable Trade Index-Infographic
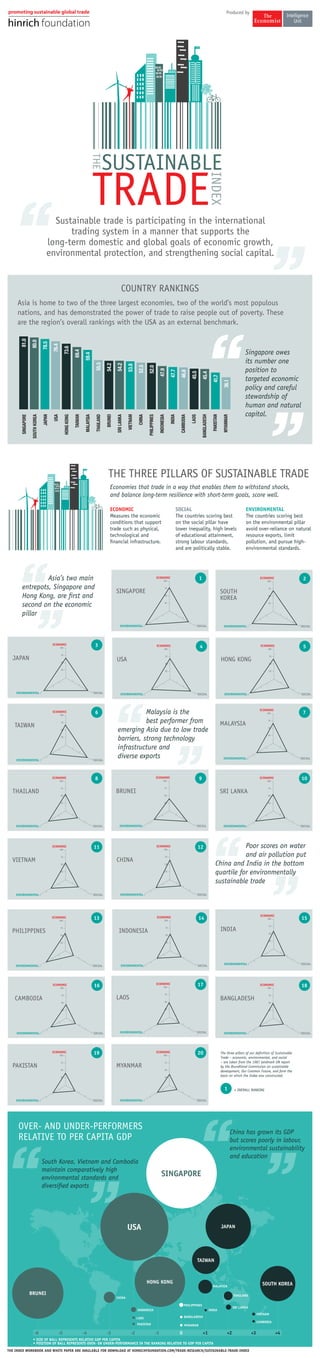
- 1. SUSTAINABLE TRADEINDEX THE Sustainable trade is participating in the international trading system in a manner that supports the long-term domestic and global goals of economic growth, environmental protection, and strengthening social capital. COUNTRY RANKINGS Asia is home to two of the three largest economies, two of the world’s most populous nations, and has demonstrated the power of trade to raise people out of poverty. These are the region’s overall rankings with the USA as an external benchmark. Singapore owes its number one position to targeted economic policy and careful stewardship of human and natural capital. SINGAPORE SOUTHKOREA JAPAN USA HONGKONG TAIWAN MALAYSIA THAILAND BRUNEI SRILANKA VIETNAM CHINA PHILIPPINES INDONESIA INDIA CAMBODIA LAOS BANGLADESH PAKISTAN MYANMAR 81.0 80.0 78.5 76.4 73.6 69.4 59.4 55.5 54.2 54.2 53.8 52.5 52.0 47.9 47.7 46.8 45.5 45.4 41.7 36.1 Asia’s two main entrepots, Singapore and Hong Kong, are first and second on the economic pillar Malaysia is the best performer from emerging Asia due to low trade barriers, strong technology infrastructure and diverse exports THE THREE PILLARS OF SUSTAINABLE TRADE Poor scores on water and air pollution put China and India in the bottom quartile for environmentally sustainable trade ECONOMIC Measures the economic conditions that support trade such as physical, technological and financial infrastructure. SOCIAL The countries scoring best on the social pillar have lower inequality, high levels of educational attainment, strong labour standards, and are politically stable. ENVIRONMENTAL The countries scoring best on the environmental pillar avoid over-reliance on natural resource exports, limit pollution, and pursue high- environmental standards. The three pillars of our definition of Sustainable Trade – economic, environmental, and social – are taken from the 1987 landmark UN report by the Brundtland Commission on sustainable development, Our Common Future, and form the basis on which the Index was constructed. = OVERALL RANKING OVER- AND UNDER-PERFORMERS RELATIVE TO PER CAPITA GDP China has grown its GDP but scores poorly in labour, environmental sustainability and education BANGLADESH SRI LANKA THAILAND -6 -5 -4 -3 -2 -1 +1 +2 +3 +40 SINGAPORE SOUTH KOREA JAPANUSA HONG KONG TAIWAN BRUNEI VIETNAM CHINA MALAYSIA PHILIPPINES INDONESIA INDIA CAMBODIA LAOS PAKISTAN MYANMAR South Korea, Vietnam and Cambodia maintain comparatively high environmental standards and diversified exports Economies that trade in a way that enables them to withstand shocks, and balance long-term resilience with short-term goals, score well. • SIZE OF BALL REPRESENTS RELATIVE GDP PER CAPITA • POSITION OF BALL REPRESENTS OVER- OR UNDER-PERFORMANCE IN THE RANKING RELATIVE TO GDP PER CAPITA THE INDEX WORKBOOK AND WHITE PAPER ARE AVAILABLE FOR DOWNLOAD AT HINRICHFOUNDATION.COM/TRADE-RESEARCH/SUSTAINABLE-TRADE-INDEX 100 75 50 25 ECONOMIC SOCIALENVIRONMENTAL USA 4 100 75 50 25 ECONOMIC SOCIALENVIRONMENTAL BRUNEI 9 100 75 50 25 ECONOMIC SOCIALENVIRONMENTAL PAKISTAN 19 100 75 50 25 ECONOMIC SOCIALENVIRONMENTAL MALAYSIA 7 100 75 50 25 ECONOMIC SOCIALENVIRONMENTAL SOUTH KOREA 2 100 75 50 25 ECONOMIC SOCIALENVIRONMENTAL PHILIPPINES 13 100 75 50 25 ECONOMIC SOCIALENVIRONMENTAL SRI LANKA 10 100 75 50 25 ECONOMIC SOCIALENVIRONMENTAL LAOS 17 100 75 50 25 ECONOMIC SOCIALENVIRONMENTAL MYANMAR 20 100 75 50 25 ECONOMIC SOCIALENVIRONMENTAL INDONESIA 14 100 75 50 25 ECONOMIC SOCIALENVIRONMENTAL VIETNAM 11 100 75 50 25 ECONOMIC SOCIALENVIRONMENTAL SINGAPORE 1 100 75 50 25 ECONOMIC SOCIALENVIRONMENTAL BANGLADESH 18 100 75 50 25 ECONOMIC SOCIALENVIRONMENTAL THAILAND 8 100 75 50 25 ECONOMIC SOCIALENVIRONMENTAL HONG KONG 5 100 75 50 25 ECONOMIC SOCIALENVIRONMENTAL CHINA 12 100 75 50 25 ECONOMIC SOCIALENVIRONMENTAL INDIA 15 100 75 50 25 ECONOMIC SOCIALENVIRONMENTAL CAMBODIA 16 100 75 50 25 ECONOMIC SOCIALENVIRONMENTAL JAPAN 3 100 75 50 25 ECONOMIC SOCIALENVIRONMENTAL TAIWAN 6 1 Produced by