
Recommended
More Related Content
Viewers also liked
Viewers also liked (14)
Similar to Outage Management System - Report
Similar to Outage Management System - Report (20)
Recently uploaded
Recently uploaded (20)
Outage Management System - Report
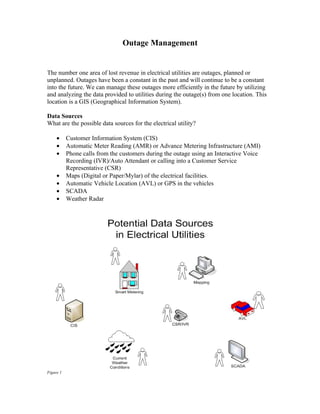
- 1. Outage Management The number one area of lost revenue in electrical utilities are outages, planned or unplanned. Outages have been a constant in the past and will continue to be a constant into the future. We can manage these outages more efficiently in the future by utilizing and analyzing the data provided to utilities during the outage(s) from one location. This location is a GIS (Geographical Information System). Data Sources What are the possible data sources for the electrical utility? • Customer Information System (CIS) • Automatic Meter Reading (AMR) or Advance Metering Infrastructure (AMI) • Phone calls from the customers during the outage using an Interactive Voice Recording (IVR)/Auto Attendant or calling into a Customer Service Representative (CSR) • Maps (Digital or Paper/Mylar) of the electrical facilities. • Automatic Vehicle Location (AVL) or GPS in the vehicles • SCADA • Weather Radar Figure 1
- 2. Notice in Figure 1 the data sources are not connected and have a person next to each source. When data sources are not connected together seamlessly, more employees are needed to manage the data sources. Not all utilities will have all of these data sources but all utilities have at least some of these sources. All utilities have some sort of mapping whether or not the mapping has been converted into a digital format depends on the utility. All utilities have customer information in some form or another. If the utility has Smart Metering (AMR/AMI) then they typically have a CIS. We find that most utilities we deal with have just the mapping and Smart Metering with a CIS but not much more. These components are typically not integrated together. Integration Integration of data is the key to managing outages efficiently. GIS is the integrator of data sources. For electrical utilities, it is important to note the how critical having all data sources MultiSpeak (multispeak.org) compliant and interoperable. I can not stress enough how important it is to make sure all the software that is accessed by the GIS to manage not only Outage Management Systems (OMS) but as well as the Engineering Analysis, Staking, Billing, Smart Metering, etc. If the interoperability is there from the beginning the marriage of all the data will be seamless in the GIS making the integration easier and more cost effective for the utility in the integration process. GIS joins all the data sources together. It truly is the hub. From this hub the decision makers can make decisions at a high accuracy rate and faster than ever before. The reason for this is because the data is displayed on a map. So the trends and patterns become very easy to discern on the fly. Figure 2
- 3. Notice in Figure 2 GIS is now the hub of the wheel and the data sources are the spokes. The number of employees now allocated to managing the data sources has dropped from 7 to 4, saving money and resources for the utility. Once the GIS becomes the hub creating custom reports for analysis becomes very straight forward and also reduces man-hours in creating the report because the data is brought together in one location. Managing the Outages Dispatchers for utilities process a tremendous amount of information during an outage event. • Who is out of power • Where are the crews (Tree and Line) • Which crews have been assigned to which areas • Are crews clear of a line being re-energized • Answering phone calls coming in from customers to report outages • Communicating with crews • Planning where to send crews as the outage event progresses Without GIS this job can be chaotic at best at the beginning of an outage event. With GIS this job is very hectic at worst. The GIS allows the dispatcher to remain organized resulting in clear decision making, not to mention the correct decisions are usually made because of data being organized in the GIS then being outputted to the dispatcher in a format he/she can easily disseminate very quickly. See how a GIS makes life easier on the dispatcher by bringing together the data sources shown below: Figure 3
- 4. As you can see in Figure 3, IVR and Web applications help in the communications with customers improving the service customers receive from the utility. AVL allows the dispatcher to see where the crews are located at all times to improve safety of the crews. The AMR/AMI and IVR calls also give the dispatcher an accurate picture of the current state of the outage event allowing him/her to leverage utility resources to restore the power to the customers in the most efficient manner. To state the obvious, the less time the customer is out of power the more revenue the utility captures and the higher customer satisfaction. Another benefit to having a GIS with regards to Outage restoration is when it comes time to create statistical reports on the outage, man hours can be decreased as much as 90% - 95% from my experience. This can translate into thousands of dollars in savings to the utility.