Control Chart Rules (Western Electric Rules +)

More Information: https://flevy.com/browse/business-document/control-chart-rules-western-electric-rules--5504 BENEFITS OF DOCUMENT Assist management in making good decisions for when and when not to demand investigation and corrective actions to a process. Learn what actions to take if a specific control chart rule is broken. Enhance process performance by reducing overall variation and special cause variation. DOCUMENT DESCRIPTION Control Chart Rules Overview Control Chart Rules, sometimes referred to as Western Electric Rules, help Management, Process Owners and support personnel make informed decisions about process performance. Control Chart Rules have a dual benefit, informing you when to take action and just as importantly when not to take action. Many times Management, reacting to one or two data points on a chart will demand investigation and corrective action when it is not needed?wasting valuable time and unnecessary process tampering. What This Course Provides This 17-page course provides learners with a thorough understanding of the terminology and methodology associated with Control Chart Rules. It is presented in FranklinGood's comprehensive and highly visual learning format. This course will help learners understand the why and how control chart rules work, how to apply them and how to improve process performance. The learner is also provided insights into the causes of process issues, enhancing their ability to make improvements. Learners will understand how probability is the basis for control chart rules, the difference between normal variation and special cause variation. Learning Objectives ? Learn the rationale and logic behind control chart rules, enabling their adoption and support across the organization. ? Learn the value of using control chart rules. ? Learn how "zones" increase insights into process performance. ? Learn what actions to take if a specific control chart rule is broken. ? Learn each rule with a graphic that demonstrates what the rule looks like on a control chart. Got a question about this presentation? Email us at support@flevy.com.

Recommended
Recommended
More Related Content
More from Flevy.com Best Practices
More from Flevy.com Best Practices (20)
Recently uploaded
Recently uploaded (20)
Control Chart Rules (Western Electric Rules +)
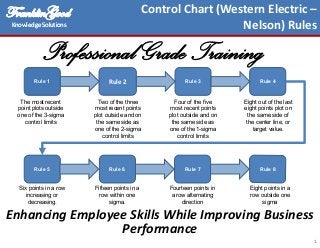
- 1. YÜtÇ~Ä|ÇZÉÉw Knowledge Solutions YÜtÇ~Ä|ÇZÉÉw Knowledge Solutions 1 Control Chart (Western Electric – Nelson) Rules Four of the five most recent points plot outside and on the same side as one of the 1-sigma control limits Eight points in a row outside one sigma Rule 8 Rule 7 Rule 6 Rule 5 Rule 1 Rule 3 Rule 4 Rule 2 The most recent point plots outside one of the 3-sigma control limits Two of the three most recent points plot outside and on the same side as one of the 2-sigma control limits Eight out of the last eight points plot on the same side of the center line, or target value. Six points in a row increasing or decreasing. Fifteen points in a row within one sigma. Fourteen points in a row alternating direction Professional GradeTraining Enhancing Employee Skills While Improving Business Performance
- 2. YÜtÇ~Ä|ÇZÉÉw Knowledge Solutions YÜtÇ~Ä|ÇZÉÉw Knowledge Solutions 4 Overview Likelihood of Occurrence • The basis for making decisions using the Western Electric Company and Nelson rules (Control Chart Rules) are based on the “likelihood this could happen.” • In other words, these rules are based on the science of probability. • Example: What is the probability that a coin toss could yield 7 heads in a row? • Very small…in fact it is 0.78% • Essentially, if the likelihood is so low, then it should get our attention…and needs to be investigated. Another way of stating this is, “This did not happen by random chance… therefore, there must be an assignable cause.” This document is a partial preview. Full document download can be found on Flevy: https://flevy.com/browse/document/control-chart-rules-western-electric-rules--5504
- 3. YÜtÇ~Ä|ÇZÉÉw Knowledge Solutions YÜtÇ~Ä|ÇZÉÉw Knowledge Solutions 7 Overview Probability Basis for Decision Rules • When the parameter being measured behaves in a normally distributed manner then the data, over time, forms a bell-shaped curve. • When this is the case, we can easily determine the likelihood the process is or is not performing as intended. • This is the basis for statistical process control (SPC) and control charts. For example, it is commonly understood that the likelihood of a data point falling 3 standard deviations from the center line (mean) is only about 0.1% • There is a 34.1% likelihood the parameter being measured will be between the center line and 1 sigma, 13.6% chance between 1 and 2 sigma and 2.1% between 2 and 3 sigma Because the likelihood is so small in this example, 0.1%, because the process’s parameter value is greater than 3 sigma from the mean, there must be something unique causing it This condition forms the first decision rule of the control chart rules and all of the rules are based on a similar approach…the likelihood of occurrence Bell-shaped or normally distributed curve Observed Data Point This document is a partial preview. Full document download can be found on Flevy: https://flevy.com/browse/document/control-chart-rules-western-electric-rules--5504
- 4. YÜtÇ~Ä|ÇZÉÉw Knowledge Solutions YÜtÇ~Ä|ÇZÉÉw Knowledge Solutions 10 10 Rule 1 Rule 3 Rule 4 Rule 2 • Two of the three data points plot outside and on the same side as one of the 2-sigma control limits. • Rule 2 primarily indicates a medium level shift in process performance has occurred. Look for things like: New person doing the Job, wrong setup, measurement error, process step skipped, process not completed, equipment failure. Understanding Each Rule Control Chart Rules This document is a partial preview. Full document download can be found on Flevy: https://flevy.com/browse/document/control-chart-rules-western-electric-rules--5504
- 5. YÜtÇ~Ä|ÇZÉÉw Knowledge Solutions YÜtÇ~Ä|ÇZÉÉw Knowledge Solutions 13 Rule 8 Rule 7 Rule 6 Rule 5 • Six points in a row increasing or decreasing. • Rule 5 primarily indicates a time dependent shift or trend in the process performance has occurred. • Look for things like: tooling wear, temperature effects (heating, cooling). Understanding Each Rule Control Chart Rules This document is a partial preview. Full document download can be found on Flevy: https://flevy.com/browse/document/control-chart-rules-western-electric-rules--5504
- 6. YÜtÇ~Ä|ÇZÉÉw Knowledge Solutions YÜtÇ~Ä|ÇZÉÉw Knowledge Solutions 16 • Eight points in a row outside one sigma. • Primarily indicates a mixture “pattern” is affecting process performance. • Look for things like: More than one process present (e.g. shifts, machines, raw materials). Rule 8 Rule 7 Rule 6 Rule 5 Understanding Each Rule Control Chart Rules This document is a partial preview. Full document download can be found on Flevy: https://flevy.com/browse/document/control-chart-rules-western-electric-rules--5504
- 7. 1 Flevy (www.flevy.com) is the marketplace for premium documents. These documents can range from Business Frameworks to Financial Models to PowerPoint Templates. Flevy was founded under the principle that companies waste a lot of time and money recreating the same foundational business documents. Our vision is for Flevy to become a comprehensive knowledge base of business documents. All organizations, from startups to large enterprises, can use Flevy— whether it's to jumpstart projects, to find reference or comparison materials, or just to learn. Contact Us Please contact us with any questions you may have about our company. • General Inquiries support@flevy.com • Media/PR press@flevy.com • Billing billing@flevy.com