Test statsvisualmethod
•Download as PPTX, PDF•
1 like•357 views

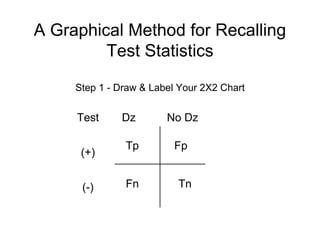
This document outlines 5 steps to create a graphical method for recalling test statistics: 1. Draw and label a 2x2 chart with true positive, true negative, false positive, and false negative. 2. Add down and up arrows labeling sensitivity and specificity. 3. Reverse the arrow heads to label false positive and negative rates. 4. Add horizontal arrows labeling positive and negative predictive values. 5. The final diagram allows recalling various test statistics like likelihood ratios, odds ratio, and accuracy.

Recommended
More Related Content
Viewers also liked
Viewers also liked (20)
More from Frank Meissner
More from Frank Meissner (20)
Recently uploaded
Recently uploaded (20)
Test statsvisualmethod
- 1. A Graphical Method for Recalling Test Statistics Step 1 - Draw & Label Your 2X2 Chart Dz No DzTest (+) (-) Tp Tn Fp Fn
- 2. Step 2 - Put in a down-going arrow & an up-going Arrow Dz No DzTest (+) (-) Tp Tn Fp Fn Tp Tp + Fn Tn Tn + Fp Sensitivity Specificity Starting at origin of arrow place label at top of your formula and than below division line place label at bottom of arrow + label at point of arrow True (+) Rate True (-) Rate Type I Error Type II Error
- 3. Step 3 - Reverse the Direction of the Arrow Heads Dz No DzTest (+) (-) Tp Tn Fp Fn Fn Tp + Fn Fp Tn + Fp False (-) Rate False (+) Rate Starting at origin of arrow place label at top of your formula and than below division line place label at bottom of arrow + label at point of arrow
- 4. Step 4 - Put in Horizontal Arrow Heads Dz No DzTest (+) (-) Tp Tn Fp Fn Tp Tp + Fp PPV Tn Tn + Fn NPV Starting at origin of arrow place label at top of your formula and than below division line place label at bottom of arrow + label at point of arrow
- 5. Step 5 - Final Diagram Dz No DzTest (+) (-) Tp Tn Fp Fn Fn Tp + Fn Fp Tn + Fp FNR FPR LR(+)= TPR FPR LR(-)= TNR FNR Odds Ratio= LR(+) LR(-) Tp Tp + Fn TPR Tn Tn + Fp TNR Tp Tp + Fp PPV Tn Tn + Fn NPV Accuracy= Tp+Tn Tp + Fn + Tn + Fp