3. Some easy-to-use visualisation tools
• Find data patterns with Excel conditional formatting
• Map your data with OpenHeatMap
• Create infographics with Piktochart
• Animate our data with Google Motion Charts
• Visualise networks with VOSviewer
4. Some easy-to-use visualisation tools
• Find data patterns with Excel conditional formatting
• Map your data with OpenHeatMap
• Create infographics with Piktochart
• Animate our data with Google Motion Charts
• Visualise networks with VOSviewer
5. Some easy-to-use visualisation tools
• Find data patterns with Excel conditional formatting
• Map your data with OpenHeatMap
• Create infographics with Piktochart
• Animate our data with Google Motion Charts
• Visualise networks with VOSviewer
6. Some easy-to-use visualisation tools
• Find data patterns with Excel conditional formatting
• Map your data with OpenHeatMap
• Create infographics with Piktochart
• Visualise networks with VOSviewer
8. Excel conditional formatting
• What you need
• A copy of Excel 2000 (Windows or Mac OS X)
• Some spreadsheet data (numbers, text, or both)
• Time to explore
e
es ity th
• A colour printer, ideally
i c rs y
Le ve d b
r
te
o ni e
U d vi
ro
P
f
9. Excel conditional formatting
• What you can do with it
• Identify duplicates or unique values
• Highlight cells according to rules you define (e.g. top 10%, above average)
• Add data bars to cells
• Add icon sets (e.g. traffic lights to show values above and below user-defined
thresholds)
• ... essentially a tool to explore tabular data and to help you and your
readers to pick out what really matters
12. OpenHeatMap
• What you need
• A good internet connection and a browser
• OpenHeatMap is a free cloud application so
you don’t need to download or install any
other software: just upload your data onto
their remote server
• No need to register or sign in
ti d
u
n
• Spreadsheet data where the first column
ca o
o
contains a spatial reference (e.g. country
li l
p c
names, UK councils, US zip codes) and the
p e
other columns contain numerical information
a re
that you want to project onto a map
F
13. OpenHeatMap
• What you can do with it
• Project any data that comprises a location and a number onto a zoomable
map
• ... offers a more meaningful way to present spatial data
14. OpenHeatMap location plus data
• Data format
country wine production*
Italy 46,245
France 42,582
Spain 41,583
Germany 9,991
Romania 6,786
Portugal 5,620
*1,000 hectolitres in 2011/12
19. Piktochart
• What you need
ll d
fu u
• A good internet connection and a browser
o
(U s s; cl
• A debit or credit card!
o ir ic e
9)
ti u v th
• Time and creativity
.9
n e e
p q er n
S$ a
29
ri re s o
sc e d ss
it ce
su rv m c
b ic e
se li a e
re
F
to
20. Piktochart
• What you can do with it
• Create an infographic and tell a story using numbers
• Summarise and present a lot of complex information on a single sheet
• Design principles are already embedded in templates: you do not need to be
a graphic artist!
• ... a great way to clear your head and really get to the nub of what you
are trying to say (and impress)
25. VOSviewer
• What you need
• Free software download at www.vosviewer.com
• Java 6 or higher must be installed
x)
u
o ad
n
• Spreadsheet data, saved as .csv or .txt
Li
a lo
r
• You can also import Web of Science records
M wn
(remember to check the full cited records option
c
s, o
and select .txt)
w d
o e
d re
in F
(W
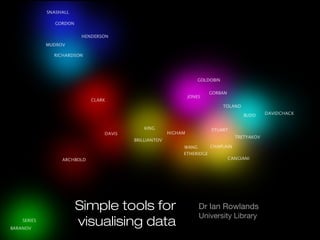
26. VOSviewer
• What you can do with it
• Make the relationships between members of a network visible
• Import search results from the Web of Science and automatically generate
maps of the literature
• Explore relationships between papers, journals, authors and institutions
• ... understand the structure of complex networks, revealing hidden
relationships