SlideShare a Scribd company logo
1 of 4
No strategic management or marketing text appears to be complete without the inclusion of the
Boston Consulting Group (BCG) growth-share matrix. When used effectively, this model provides
guidance for resource allocation. And despite its inherent weaknesses, is probably one of the most
widely used management instrument as far as portfolio management is concern. For instant, each
SBU (strategic business unit) of large companies such as General Electric, Siemens, and Centrica
require different strategies to compete effectively and efficiently. It is not a question of one strategy
fits all SBUs since the likelihood for each of them experiencing the same market growth rate,
industry-threats and leverage is very slim. This is where the BCG model comes into play as a
management analytical tool. The ensuing examines the underpinnings of the model, for what it is
used, how to use it and why it is used.


WHAT IS THE BCG GROWTH-SHARE MATRIX?
To begin with, BCG is the acronym for Boston Consulting Group—a general management
consulting firm highly respected in business strategy consulting. BCG Growth-Share Matrix (see
figure 1) happens to be one of many of BCG's strategic concepts the organisation developed in the
late 1970s, and is being taught at leading business schools and executive education programmes
around the world.
It is a management tool that serves four distinct purposes (McDonald 2003; Kotler 2003; Cipher
2006): it can be used to classify product portfolio in four business types based on four graphic
labels including Stars, Cash Cows, Question Marks and Dogs; it can be used to determine what
priorities should be given in the product portfolio of a company; to classify an organisation’s product
portfolio according to their cash usage and generation; and offers management available strategies
to tackle various product lines. Consider companies like Apple Computer, General Electric,
Unilever, Siemens, Centrica and many more, engaging in diversified product lines. The BCG model
therefore becomes an invaluable analytical tool to evaluate an organisation’s diversified product
lines as later seen in the ensuing sections.


WHAT ARE THE MAIN ASPECTS OF THE BCG GROWTH-SHARE MATRIX?
The BCG Growth-Share Matrix is based on two dimensional variables: relative market share and
market growth. They often are pointers to healthiness of a business (Kotler 2003; McDonald 2003).
In other words, products with greater market share or within a fast growing market are expected to
wield relatively greater profit margins. The reverse is also true. Let’s look at the following
components of the model:
Fig. 1: Source: 12manage.com 2006
Relative Market Share
According to the proponents of the BCG (Herndemson 1972), It captures the relative market share
of a business unit or product. But that is not all! It allows the analysed business unit be pitted
against its competitors. As earlier emphasized above, this is due to the sometime correlation
between relative market share and the product’s cash generation. This phenomenon is often
likened to the experience curve paradigm that when an organisation enjoys lower costs, improved
efficiency from conducting business operations overtime. The basic tenet of this postulation is that
the more an organisation performs a task often; it tends to develop new ways in performing those
tasks better which results in lower operating cost (Cipher 2006). What that suggests is that the
experience curve effect requires that market share is increased to be able to drive down costs in
the long run and at the same time a company with a dominant market share will inevitably have a
cost advantage over competitor companies because they have the greater share of the market.
Hence, market share is correlated with experience.
A case in point is Apple Computer’s flagship product called the iPod, which occupies a dominant
73% share the portable music player market (Cantrell 2006). Analysts believe it is the impetus for
Apple's financial rebirth 40% of Apple's sales is attributed to the iPod product line (Cantrell 2006).
Similarly, Dell’s PC line shares the same market dominance theory as the iPod. The PC
manufacture giant occupies a worldwide market share of 18.1%, which is commensurate to its large
market revenue above its competitors (see figure 2).
Figure 2: Source: Reuters 2006


Market Growth
Market growth axis, correlates with the product life cycle paradigm, and predicates the cash
requirement a product needs relative to the growth of that market. A fast growing market is
generally considered attractive, and pulls a lot of organisation’s resources in an effort to increase
gains. A case in point is the technological market widely consider by experts as a fast growing
market, and tends to attract a lot of competition. Therefore, a product life cycle and its associated
market play a key role in decision-making.


Cash Cows
These products are said to have high profitability, and require low investment for the fact that they
are market leaders in a low-growth market. This viewpoint is captured by the founders themselves
thus:
The cash cows fund their own growth. They pay the corporate dividend. They pay the corporate
overhead. They pay the corporate interest charges. They supply the funds for R&D. They supply
the investment resource for other products. They justify the debt capacity for the whole company.
Protect them (Henderson 1976).
According to experts (Drummond & Ensor 2004; Kotler 2003; McDonald 2003), surplus cash from
cash cow products should be channelled into Stars and Questions in order to create the future
Cash Cows.


Stars
Stars are leaders in high growth markets. They tend to/should generate large amounts of cash but
also use a lot of cash because of growth market conditions. For example, Apple Computer has a
large share in the rapidly growing market for portable digital music players (Cantrell 2006).


Question Marks
Question Marks have not achieved a dominant market position, and hence do not generate much
cash. They tend to use a lot of cash because of growth market conditions. Consider Hewlett-
Packard’s small share of the digital camera market, behind industry leader Canon’s 21% (Canon
2006). However, this is a rapidly growing market.


Dogs
Dogs often have little future and are big cash drainers on the company as they generate very little
cash by virtue of their low market share in a highly low growth market.
Consider Pfizer’s Inspra (Gibson 2006): “Pfizer launched this drug in Q4 2003 and continues to
pump money into this problem child, despite anaemic sales of roughly $40 million in the $2.7 billion
heart-failure market dominated by Toprol-XL (metoprolol). It was thought to gain market share and
become a star, and eventually a cash cow when the market growth slowed. But, according to
industry’s experts, Inspra is likely to remain a dog, despite any amount of promotion, given its
perceived safety issues and a cheaper, more effective spironolactone in the same Pfizer portfolio.
Because Pfizer invested heavily in promotion early on with Inspra, the drug's earnings potential and
positive cash flow is elusive at best. A portfolio analysis of Pfizer's cardiovascular franchise would
suggest redeploying promotional spend on Inspra to up-and-coming stars like Caduet
(amlodipine/atorvastatin) or torcetrapib to ensure those drugs reach their sales potential.”

More Related Content

What's hot

Apple Study Case- Nov 20
Apple Study Case- Nov 20Apple Study Case- Nov 20
Apple Study Case- Nov 20Alaa Sulaiman
 
Apple Case Study Oral Presentation_WCJWMLYS
Apple Case Study Oral Presentation_WCJWMLYSApple Case Study Oral Presentation_WCJWMLYS
Apple Case Study Oral Presentation_WCJWMLYSWyatt A. Chartrand
 
Apple strategic report
Apple strategic reportApple strategic report
Apple strategic reportbiya05
 
Apple Strategic Management Case Analysis
Apple Strategic Management Case AnalysisApple Strategic Management Case Analysis
Apple Strategic Management Case AnalysisKatherine Fitzsimmons
 
Apple Case Competition
Apple Case CompetitionApple Case Competition
Apple Case Competitionsupcussy
 
Apple strategic management
Apple   strategic managementApple   strategic management
Apple strategic managementShady Khorshed
 
Managerial Economics for Apple Inc.
Managerial Economics for Apple Inc.Managerial Economics for Apple Inc.
Managerial Economics for Apple Inc.Kumod Shirkande
 
Midterm
MidtermMidterm
Midtermsmehro
 
SAMSUNG: Comprehensive Strategic Analysis from International Business Managem...
SAMSUNG: Comprehensive Strategic Analysis from International Business Managem...SAMSUNG: Comprehensive Strategic Analysis from International Business Managem...
SAMSUNG: Comprehensive Strategic Analysis from International Business Managem...Aziza Zaldarriaga Sadain
 
tows analysis of sony
tows analysis of sony tows analysis of sony
tows analysis of sony Shivangi Jani
 
Samsung swot analysis- Maged Elsakka
Samsung swot analysis- Maged ElsakkaSamsung swot analysis- Maged Elsakka
Samsung swot analysis- Maged ElsakkaMaged Elsakka
 
Apple china case study
Apple china case studyApple china case study
Apple china case studySelma Bourafai
 
Financial Ratio Comparison - Apple and HP (2011 Figures)
Financial Ratio Comparison - Apple and HP (2011 Figures)Financial Ratio Comparison - Apple and HP (2011 Figures)
Financial Ratio Comparison - Apple and HP (2011 Figures)Marcus Sanford Consulting
 
Strategic Management: Apple
Strategic Management: AppleStrategic Management: Apple
Strategic Management: AppleMehmet Hasani
 

What's hot (20)

Apple Study Case- Nov 20
Apple Study Case- Nov 20Apple Study Case- Nov 20
Apple Study Case- Nov 20
 
Apple Case Study Oral Presentation_WCJWMLYS
Apple Case Study Oral Presentation_WCJWMLYSApple Case Study Oral Presentation_WCJWMLYS
Apple Case Study Oral Presentation_WCJWMLYS
 
Apple strategic report
Apple strategic reportApple strategic report
Apple strategic report
 
Apple Strategic Management Case Analysis
Apple Strategic Management Case AnalysisApple Strategic Management Case Analysis
Apple Strategic Management Case Analysis
 
Apple Case Competition
Apple Case CompetitionApple Case Competition
Apple Case Competition
 
Apple Computers
Apple ComputersApple Computers
Apple Computers
 
Apple strategic management
Apple   strategic managementApple   strategic management
Apple strategic management
 
Managerial Economics for Apple Inc.
Managerial Economics for Apple Inc.Managerial Economics for Apple Inc.
Managerial Economics for Apple Inc.
 
Midterm
MidtermMidterm
Midterm
 
SAMSUNG: Comprehensive Strategic Analysis from International Business Managem...
SAMSUNG: Comprehensive Strategic Analysis from International Business Managem...SAMSUNG: Comprehensive Strategic Analysis from International Business Managem...
SAMSUNG: Comprehensive Strategic Analysis from International Business Managem...
 
tows analysis of sony
tows analysis of sony tows analysis of sony
tows analysis of sony
 
IMD-Case Analysis-Apple Inc. 2008
IMD-Case Analysis-Apple Inc. 2008IMD-Case Analysis-Apple Inc. 2008
IMD-Case Analysis-Apple Inc. 2008
 
Samsung swot analysis- Maged Elsakka
Samsung swot analysis- Maged ElsakkaSamsung swot analysis- Maged Elsakka
Samsung swot analysis- Maged Elsakka
 
Apple complete
Apple completeApple complete
Apple complete
 
Apple china case study
Apple china case studyApple china case study
Apple china case study
 
Decision making
Decision making Decision making
Decision making
 
Financial Ratio Comparison - Apple and HP (2011 Figures)
Financial Ratio Comparison - Apple and HP (2011 Figures)Financial Ratio Comparison - Apple and HP (2011 Figures)
Financial Ratio Comparison - Apple and HP (2011 Figures)
 
Apple computer inc
Apple computer incApple computer inc
Apple computer inc
 
Apple strategy
Apple strategyApple strategy
Apple strategy
 
Strategic Management: Apple
Strategic Management: AppleStrategic Management: Apple
Strategic Management: Apple
 

Viewers also liked

Powerpoint on logitech
Powerpoint on logitechPowerpoint on logitech
Powerpoint on logitechmominul_Islam
 
Dell Strategic Management Presentation
Dell Strategic Management PresentationDell Strategic Management Presentation
Dell Strategic Management PresentationSophie Yanez
 
Dell - Strategy Analysis
Dell - Strategy AnalysisDell - Strategy Analysis
Dell - Strategy AnalysisRory Tan
 
Dell Strategic Management Final Paper
Dell Strategic Management Final Paper Dell Strategic Management Final Paper
Dell Strategic Management Final Paper Sophie Yanez
 

Viewers also liked (6)

Swot analysis of dell
Swot analysis of dellSwot analysis of dell
Swot analysis of dell
 
Powerpoint on logitech
Powerpoint on logitechPowerpoint on logitech
Powerpoint on logitech
 
Yahoo case analysis
Yahoo case analysisYahoo case analysis
Yahoo case analysis
 
Dell Strategic Management Presentation
Dell Strategic Management PresentationDell Strategic Management Presentation
Dell Strategic Management Presentation
 
Dell - Strategy Analysis
Dell - Strategy AnalysisDell - Strategy Analysis
Dell - Strategy Analysis
 
Dell Strategic Management Final Paper
Dell Strategic Management Final Paper Dell Strategic Management Final Paper
Dell Strategic Management Final Paper
 

Similar to BCG Growth-Share Matrix Explained

11277209 bcg-asignment-on-itc
11277209 bcg-asignment-on-itc11277209 bcg-asignment-on-itc
11277209 bcg-asignment-on-itcsaumil123
 
BCG Matrix presentation
BCG Matrix presentationBCG Matrix presentation
BCG Matrix presentationRishi Narula
 
BCG Matrix presentation
BCG Matrix presentationBCG Matrix presentation
BCG Matrix presentationRishi Narula
 
Marketing Stategy
Marketing StategyMarketing Stategy
Marketing Stategyajithsrc
 
Bcg matrix
Bcg matrixBcg matrix
Bcg matrixAjilal
 
BCG, GE NINE CELL, EXPERIENCE CURVE
BCG, GE NINE CELL, EXPERIENCE CURVEBCG, GE NINE CELL, EXPERIENCE CURVE
BCG, GE NINE CELL, EXPERIENCE CURVEAshesh Anand
 
BCG Matrix 2X2 Matrix porfolio management
BCG Matrix 2X2 Matrix porfolio management BCG Matrix 2X2 Matrix porfolio management
BCG Matrix 2X2 Matrix porfolio management Saritha Loganathan
 
Bcg matrix (boston consultancy group matrix)
Bcg matrix (boston consultancy group matrix)Bcg matrix (boston consultancy group matrix)
Bcg matrix (boston consultancy group matrix)Hpm India
 
Analyze your product portfolio and find growth opportunities
Analyze your product portfolio and find growth opportunitiesAnalyze your product portfolio and find growth opportunities
Analyze your product portfolio and find growth opportunitiesKevin Huang
 
Mtm1 white paper bcg portfolio matrix
Mtm1 white paper   bcg portfolio matrixMtm1 white paper   bcg portfolio matrix
Mtm1 white paper bcg portfolio matrixIntelCollab.com
 
Portfolio Analysis
Portfolio AnalysisPortfolio Analysis
Portfolio AnalysisGina Buck
 
Tuesday's Leaders. Growing When Your Industry Doesn’t from Strategy+ Business.
Tuesday's Leaders. Growing When Your Industry Doesn’t from Strategy+ Business.Tuesday's Leaders. Growing When Your Industry Doesn’t from Strategy+ Business.
Tuesday's Leaders. Growing When Your Industry Doesn’t from Strategy+ Business.BURESI
 

Similar to BCG Growth-Share Matrix Explained (20)

BCG matrix(word)
BCG matrix(word)BCG matrix(word)
BCG matrix(word)
 
BCG matrix
BCG matrixBCG matrix
BCG matrix
 
BCG matrix
BCG matrixBCG matrix
BCG matrix
 
11277209 bcg-asignment-on-itc
11277209 bcg-asignment-on-itc11277209 bcg-asignment-on-itc
11277209 bcg-asignment-on-itc
 
The bcg matrix
The bcg matrixThe bcg matrix
The bcg matrix
 
BCG Matrix presentation
BCG Matrix presentationBCG Matrix presentation
BCG Matrix presentation
 
BCG Matrix presentation
BCG Matrix presentationBCG Matrix presentation
BCG Matrix presentation
 
Marketing Stategy
Marketing StategyMarketing Stategy
Marketing Stategy
 
Bcg matrix
Bcg matrixBcg matrix
Bcg matrix
 
BCG, GE NINE CELL, EXPERIENCE CURVE
BCG, GE NINE CELL, EXPERIENCE CURVEBCG, GE NINE CELL, EXPERIENCE CURVE
BCG, GE NINE CELL, EXPERIENCE CURVE
 
BCG Matrix 2X2 Matrix porfolio management
BCG Matrix 2X2 Matrix porfolio management BCG Matrix 2X2 Matrix porfolio management
BCG Matrix 2X2 Matrix porfolio management
 
Bcg matrix (boston consultancy group matrix)
Bcg matrix (boston consultancy group matrix)Bcg matrix (boston consultancy group matrix)
Bcg matrix (boston consultancy group matrix)
 
Strategy
StrategyStrategy
Strategy
 
Analyze your product portfolio and find growth opportunities
Analyze your product portfolio and find growth opportunitiesAnalyze your product portfolio and find growth opportunities
Analyze your product portfolio and find growth opportunities
 
Mtm1 white paper bcg portfolio matrix
Mtm1 white paper   bcg portfolio matrixMtm1 white paper   bcg portfolio matrix
Mtm1 white paper bcg portfolio matrix
 
Portfolio Analysis
Portfolio AnalysisPortfolio Analysis
Portfolio Analysis
 
A new entrant rfid
A new entrant rfidA new entrant rfid
A new entrant rfid
 
2. opxs (15 may 2019)
2. opxs (15 may 2019)2. opxs (15 may 2019)
2. opxs (15 may 2019)
 
Growing When Your Industry Doesn't
Growing When Your Industry Doesn'tGrowing When Your Industry Doesn't
Growing When Your Industry Doesn't
 
Tuesday's Leaders. Growing When Your Industry Doesn’t from Strategy+ Business.
Tuesday's Leaders. Growing When Your Industry Doesn’t from Strategy+ Business.Tuesday's Leaders. Growing When Your Industry Doesn’t from Strategy+ Business.
Tuesday's Leaders. Growing When Your Industry Doesn’t from Strategy+ Business.
 

BCG Growth-Share Matrix Explained

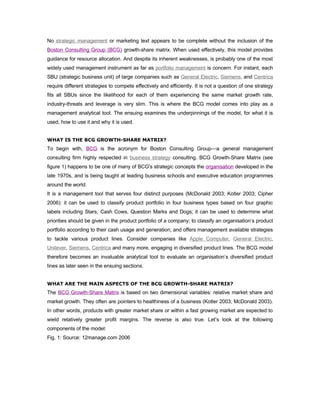
  • 1. No strategic management or marketing text appears to be complete without the inclusion of the Boston Consulting Group (BCG) growth-share matrix. When used effectively, this model provides guidance for resource allocation. And despite its inherent weaknesses, is probably one of the most widely used management instrument as far as portfolio management is concern. For instant, each SBU (strategic business unit) of large companies such as General Electric, Siemens, and Centrica require different strategies to compete effectively and efficiently. It is not a question of one strategy fits all SBUs since the likelihood for each of them experiencing the same market growth rate, industry-threats and leverage is very slim. This is where the BCG model comes into play as a management analytical tool. The ensuing examines the underpinnings of the model, for what it is used, how to use it and why it is used. WHAT IS THE BCG GROWTH-SHARE MATRIX? To begin with, BCG is the acronym for Boston Consulting Group—a general management consulting firm highly respected in business strategy consulting. BCG Growth-Share Matrix (see figure 1) happens to be one of many of BCG's strategic concepts the organisation developed in the late 1970s, and is being taught at leading business schools and executive education programmes around the world. It is a management tool that serves four distinct purposes (McDonald 2003; Kotler 2003; Cipher 2006): it can be used to classify product portfolio in four business types based on four graphic labels including Stars, Cash Cows, Question Marks and Dogs; it can be used to determine what priorities should be given in the product portfolio of a company; to classify an organisation’s product portfolio according to their cash usage and generation; and offers management available strategies to tackle various product lines. Consider companies like Apple Computer, General Electric, Unilever, Siemens, Centrica and many more, engaging in diversified product lines. The BCG model therefore becomes an invaluable analytical tool to evaluate an organisation’s diversified product lines as later seen in the ensuing sections. WHAT ARE THE MAIN ASPECTS OF THE BCG GROWTH-SHARE MATRIX? The BCG Growth-Share Matrix is based on two dimensional variables: relative market share and market growth. They often are pointers to healthiness of a business (Kotler 2003; McDonald 2003). In other words, products with greater market share or within a fast growing market are expected to wield relatively greater profit margins. The reverse is also true. Let’s look at the following components of the model: Fig. 1: Source: 12manage.com 2006
  • 2. Relative Market Share According to the proponents of the BCG (Herndemson 1972), It captures the relative market share of a business unit or product. But that is not all! It allows the analysed business unit be pitted against its competitors. As earlier emphasized above, this is due to the sometime correlation between relative market share and the product’s cash generation. This phenomenon is often likened to the experience curve paradigm that when an organisation enjoys lower costs, improved efficiency from conducting business operations overtime. The basic tenet of this postulation is that the more an organisation performs a task often; it tends to develop new ways in performing those tasks better which results in lower operating cost (Cipher 2006). What that suggests is that the experience curve effect requires that market share is increased to be able to drive down costs in the long run and at the same time a company with a dominant market share will inevitably have a cost advantage over competitor companies because they have the greater share of the market. Hence, market share is correlated with experience. A case in point is Apple Computer’s flagship product called the iPod, which occupies a dominant 73% share the portable music player market (Cantrell 2006). Analysts believe it is the impetus for Apple's financial rebirth 40% of Apple's sales is attributed to the iPod product line (Cantrell 2006). Similarly, Dell’s PC line shares the same market dominance theory as the iPod. The PC manufacture giant occupies a worldwide market share of 18.1%, which is commensurate to its large market revenue above its competitors (see figure 2).
  • 3. Figure 2: Source: Reuters 2006 Market Growth Market growth axis, correlates with the product life cycle paradigm, and predicates the cash requirement a product needs relative to the growth of that market. A fast growing market is generally considered attractive, and pulls a lot of organisation’s resources in an effort to increase gains. A case in point is the technological market widely consider by experts as a fast growing market, and tends to attract a lot of competition. Therefore, a product life cycle and its associated market play a key role in decision-making. Cash Cows These products are said to have high profitability, and require low investment for the fact that they are market leaders in a low-growth market. This viewpoint is captured by the founders themselves thus: The cash cows fund their own growth. They pay the corporate dividend. They pay the corporate overhead. They pay the corporate interest charges. They supply the funds for R&D. They supply the investment resource for other products. They justify the debt capacity for the whole company. Protect them (Henderson 1976).
  • 4. According to experts (Drummond & Ensor 2004; Kotler 2003; McDonald 2003), surplus cash from cash cow products should be channelled into Stars and Questions in order to create the future Cash Cows. Stars Stars are leaders in high growth markets. They tend to/should generate large amounts of cash but also use a lot of cash because of growth market conditions. For example, Apple Computer has a large share in the rapidly growing market for portable digital music players (Cantrell 2006). Question Marks Question Marks have not achieved a dominant market position, and hence do not generate much cash. They tend to use a lot of cash because of growth market conditions. Consider Hewlett- Packard’s small share of the digital camera market, behind industry leader Canon’s 21% (Canon 2006). However, this is a rapidly growing market. Dogs Dogs often have little future and are big cash drainers on the company as they generate very little cash by virtue of their low market share in a highly low growth market. Consider Pfizer’s Inspra (Gibson 2006): “Pfizer launched this drug in Q4 2003 and continues to pump money into this problem child, despite anaemic sales of roughly $40 million in the $2.7 billion heart-failure market dominated by Toprol-XL (metoprolol). It was thought to gain market share and become a star, and eventually a cash cow when the market growth slowed. But, according to industry’s experts, Inspra is likely to remain a dog, despite any amount of promotion, given its perceived safety issues and a cheaper, more effective spironolactone in the same Pfizer portfolio. Because Pfizer invested heavily in promotion early on with Inspra, the drug's earnings potential and positive cash flow is elusive at best. A portfolio analysis of Pfizer's cardiovascular franchise would suggest redeploying promotional spend on Inspra to up-and-coming stars like Caduet (amlodipine/atorvastatin) or torcetrapib to ensure those drugs reach their sales potential.”