Difference Between Search & Browse Methods in Odoo 17
DEA
1. HAKEEM–UR–REHMAN
PhD (Scholar) Management Science & Engineering
Center of Logistics & Operations Management,
Antai College of Economics and Management,
Shanghai Jiao Tong University, Shanghai, China 1
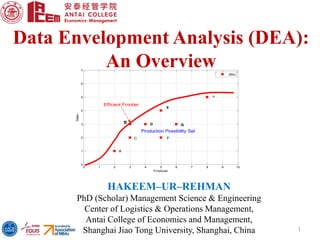
Data Envelopment Analysis (DEA):
An Overview
0 1 2 3 4 5 6 7 8 9 10
0
1
2
3
4
5
6
7
Employee
Sales
DMU
DB
C
A
E
H
F
G
Production Possibility Set
Efficient Frontier
2. Outlines
2
What is Operations Research?
What is a Linear Programming?
Data Envelopment Analysis (DEA)
DEA Vs Regression
CCR Model
Models Selection
DEA Software
DEA: Review Papers & Books
3. What is Operations Research?
3
Optimal decision-making in, and modeling of, deterministic and probabilistic
systems that originate from real life. These applications, which occur in
government, business, engineering, economics, and the natural and social sciences,
are largely characterized by the need to allocate limited resources. In these
situations, considerable insight can be obtained from scientific analysis, such as
that provided by Operations Research. (Hiller–Lieberman)
OR: a new field which started in the late 1930's and has grown and expanded
tremendously in the last 30 years
TECHNIQUES
Deterministic
OR
Stochastic
OR
Heuristics
Meta-heuristics
(OR/MS)
o Linear Programming
o Integer Programming
o Network Analysis
o Dynamic Programming
o Non-linear
Programming
o …
o Queuing Theory
o Decision Theory
o MCMC
o Markov Decision Process
o Simulation
o …
o Problem Based o Simulated Annealing
o Neural Network
o Genetic Algorithms
o Ant Colony Optimization
o …
4. What is a Linear Programming?
4
A linear programming problem (LP) is a class of the mathematical programming
problem, a constrained optimization problem, for which:
– We attempt to maximize (or minimize) a linear function of the decision variables.
(Objective Function)
– The values of the decision variables must satisfy a set of constraints, each of
which must be a linear inequality or linear equality.
– A sign restriction on each variable. For each variable 𝑋𝑗 the sign restriction can
either say
– 𝑋𝑗 ≥ 0, 𝑋𝑗 ≤ 0, 𝑋𝑗 unrestricted.
𝑀𝑎𝑥𝑖𝑚𝑖𝑧𝑒 𝑜𝑟 𝑀𝑖𝑛𝑖𝑚𝑖𝑧𝑒 𝑍 =
𝑗=1
𝑛
𝐶𝑗 𝑥𝑗
𝑆𝑢𝑏𝑗𝑒𝑐𝑡 𝑡𝑜
𝑗=1
𝑛
𝑎𝑖𝑗 𝑥𝑗
≤
=
≥
𝑏𝑖 𝑓𝑜𝑟 𝑖 = 1,2, … , 𝑚
𝑥𝑗 ≥ 0 𝑓𝑜𝑟 𝑗 = 1,2, … , 𝑛
5. 5
Data Envelopment Analysis (DEA)
“A Performance measurement tool”
0 1 2 3 4 5 6 7 8 9 10
0
1
2
3
4
5
6
7
Employee
Sales
DMU
DB
C
A
E
H
F
G
Production Possibility Set
Efficient Frontier
6. 6
“A Performance measurement tool”
What is Data Envelopment Analysis (DEA)?
Data Envelopment Analysis (DEA) is a linear programming methodology to
measure the efficiency of multiple decision-making units (DMU) when the
production process presents a structure of multiple inputs and outputs.
EXAMPLES:
DMU: Banks, Nations, schools, …
Input: Labor, Capital, Fixed Assets…
Output: Revenues, Profit …
Model of Efficiency Analysis:
Objective of a Data Envelopment Analysis (DEA) assessment:
o Comparison of performance of homogeneous decision making units (DMUs)
that use multiple inputs for the production of multiple outputs.
o The efficiency measure compares the ratio output / input of the DMU assessed
with the value of this ratio observed in the other DMUs analyzed.
7. 7
Data Envelopment Analysis (DEA)
Example: “Measuring managerial ability”
Measuring managerial ability is key to many important research
questions, such as those examining managerial contributions to
firm performance and investment decisions, and cross-country
productivity differences.
However, it is difficult to conduct a precise measure of managerial
ability. This paper uses DEA to propose a measure of managerial
ability, based on managers’efficiency in generating revenues. They
find that the measure is more suitable than a number of alternative
measures of ability (historical industry-adjusted stock returns,
historical industry-adjusted return on assets, chief executive officer
(CEO) pay, and as on).
Demerjian P, Lev B, McVay S. “Quantifying managerial ability: A new measure and
validity tests.” Management Science, 2012, 58(7): 1229-1248.
8. 8
Data Envelopment Analysis (DEA)
Example: “Measuring Olympics”
The problem of constructing an Olympic ranking using just the
number of medals won by each national team is still unsolved. The
President of the International Olympic Committee Jacques Rogge
said during the 2008 Olympic Games.
Lozano S, Villa G, Guerrero F, et al. Measuring the performance of nations at the
Summer Olympics using data envelopment analysis. Journal of the Operational
Research Society, 2002: 501-511.
Li, Y., Liang, L., Chen, Y., & Morita, H. (2008). Models for measuring and
benchmarking Olympics achievements. Omega, 36(6), 933-940.
Wu J, Liang L, Yang F. Achievement and benchmarking of countries at the Summer
Olympics using cross efficiency evaluation method. European Journal of
Operational Research, 2009, 197(2): 722-730.
Lei, X., Li, Y., Xie, Q., & Liang, L. (2014). Measuring Olympics achievements
based on a parallel DEA approach. Annals of Operations Research, 1-18.
Following papers use DEA to establish fair models for measuring
and benchmarking the performance of nations at Olympic Games.
9. 9
Data Envelopment Analysis (DEA)
Example: “Allocating Resources”
Resource allocation decisions are crucial for the success of an
organization. But it is not a easy job. Resources include scientific
funding, employees and so on.
Athanassopoulos, A. D. (1998). Decision support for target-based resource
allocation of public services in multiunit and multilevel systems. Management
Science, 44(2), 173-187.
Korhonen, P., & Syrjänen, M. (2004). Resource allocation based on efficiency
analysis. Management Science, 50(8), 1134-1144.
Chen, C. M., & Zhu, J. (2011). Efficient resource allocation via efficiency
bootstraps: an application to R&D project budgeting. Operations research,59(3),
729-741.
10. 10
Data Envelopment Analysis (DEA)
Example: “Allocating fixed costs”
When a central bank invested a common electric trade system for
its branches, such the expense should be covered by its branches.
How should this kind of expense be assigned in an equitable way
to the various peer subunits?
Following papers use DEA to propose alternative approaches to
solve such the problem.
Cook W D, Kress M. Characterizing an equitable allocation of shared costs: A
DEA approach. European Journal of Operational Research, 1999, 119(3): 652-661.
Beasley J E. Allocating fixed costs and resources via data envelopment analysis.
European Journal of Operational Research, 2003, 147(1): 198-216.
Li Y, Yang F, Liang L, et al. Allocating the fixed cost as a complement of other cost
inputs: A DEA approach. European Journal of Operational Research, 2009, 197(1):
389-401.
11. 11
Why DEA?
DEA publication statistics from Science Direct
Number of papers Published
0
100
200
300
400
500
600
700
800
900
1000
1994 1996 1998 2000 2002 2004 2006 2008 2010 2012 2014
Years
Numbers
Databases including:
Science Direct (www.sciencedirect.com)
EBSCO (www.ebsco.com)
Google Scholar (http:// scholar.google.com)
JSTOR (http://uk.jstor.org/)
Pro-Quest (http://proquest.umi.com)
12. 12
Why DEA?...
Top 20 most influential journals in DEA field
Liu J S, Lu L Y Y, Lu W M, et al. Data envelopment analysis 1978–2010: A citation-
based literature survey. Omega, 2013, 41(1): 3-15.
13. 13
What is DEA?...
PRODUCER is usually referred to as a Decision Making Unit (DMU)
o All DMUs must exist in the same basic environment and convert same set
of inputs into same set of outputs
It is a deterministic & non-parametric technique (i.e. makes no
assumptions)
The name of the technique is because we try to build a frontier by
enveloping all the observed input-output vectors
o Efficiency of each firm is measured by the distance of its input-output
vectors to the frontier
It fits a piece-wise linear frontier using a linear programming technique
It’s an extreme point method and it compares each producer with only the
"best" producers
14. 14
DEA: Measuring Performance Efficiency
Shoe Shops: Example (Single Input and Single Output Case) Suppose there
are 8 branch stores which we label A to H at the head of each column in the following Table.
Each store uses employees to get sales. Sales are measured in 100,000 dollars. Their
“production processes” are similar, so they are comparable.
Employee
o Compared with the best store ‘B’, the others
are inefficient. We can measure the efficiency
of others relative to ‘B’by
o The worst F’s efficiency is 0.4 / 1 = 0.4,
which is 40% of B's efficiency.
o Arrange them in the following order
Efficiency=
𝑂𝑢𝑡𝑝𝑢𝑡
𝐼𝑛𝑝𝑢𝑡
15. 15
DEA Vs Regression
Shoe Shops: Example (Single Input and Single Output Case) …
8 Stores; Sales & # of Employees
Regression can accommodate Multiple inputs or outputs but not both
Regression requires a functional relationship between in/outputs
Regression provides only average relationships not best practice
DEA Best-
Practice Frontier
predicted
average behavior
Inefficient Efficient
piece-
wise
linear
frontier
16. 16
Why Use DEA?
Reasons:
o DEA provides an ordinal ranking of relative efficiency
compared to the Pareto-efficient frontier—the best performance
that can be practically achieved.
o DEA allows each DMU to select an optimal set of weights by
itself. (If two firms produce the same output, but do so with
different mixes of inputs, even if the dollar value of the inputs
differs, both are considered efficient.)
17. 17
DEA: General case
Suppose there are ‘𝑛’ 𝐷𝑀𝑈
o 𝐷𝑀𝑈𝑗 Where: 𝑗 = 1,2,3, … , 𝑛 (𝑖. 𝑒. 𝐷𝑀𝑈1, 𝐷𝑀𝑈2, … , 𝐷𝑀𝑈 𝑛)
Each 𝐷𝑀𝑈 Consumes ‘𝑚’ inputs and Generates ′𝑠′ outputs. Let the
o Input data for 𝐷𝑀𝑈𝑗 be (𝑥1𝑗, 𝑥2𝑗, … , 𝑥 𝑚𝑗) and
o Output data for 𝐷𝑀𝑈𝑗 be (𝑦1𝑗, 𝑦2𝑗, … , 𝑦 𝑠𝑗)
Then, for each DMU, we formed the virtual input and output by (yet
unknown) weights (𝑣𝑖) and (𝑢 𝑟):
o Virtual Input = 𝑣1 𝑥10 + ⋯ + 𝑣 𝑚 𝑥 𝑚0 Total Cost
o Virtual Output = 𝑢1 𝑦10 + ⋯ + 𝑢 𝑠 𝑦𝑠0 Total Revenue
Then we tried to determine the optimal weights, using linear
programming so as to maximize the 𝑅𝑎𝑡𝑖𝑜 =
𝑉𝑖𝑟𝑡𝑢𝑎𝑙 𝑂𝑢𝑡𝑝𝑢𝑡
𝑉𝑖𝑟𝑡𝑢𝑎𝑙 𝐼𝑛𝑝𝑢𝑡
The optimal weights may (and generally will) vary from one DMU to
another DMU.
18. 18
DEA: The CCR Model
Let the 𝐷𝑀𝑈𝑗 to be evaluated be designated as 𝐷𝑀𝑈 𝑜
We solve the following fractional programming problem to obtain values for the
input "weights" (𝑣𝑖: 𝑖 = 𝑙, … , 𝑚) and the output "weights" (𝑢𝑟: 𝑟 = 1, … , 𝑠)
These weights are decision variables.
19. 19
DEA: The CCR Model…
The optimal solution for (LPo) denoted as (v*, u*) in measuring the efficiency for
the DMU0.
CCR Efficiency:
i. 𝐷𝑀𝑈 𝑜 is CCR-efficient if 𝜃∗ = 1 and there exists at least one optimal
(𝑣∗, 𝑢∗), with 𝑣∗ > 0 and 𝑢∗ > 0.
ii. Otherwise, 𝐷𝑀𝑈 𝑜 is CCR-inefficient.
The bigger its score, the more efficient, the higher its rank.
Theorem 2.1 The
fractional program (FPo)
is equivalent to (LPo).
(Cooper-Charnes
transformation)
The fractional program (FPo) can be changed to be a following Linear program
(LPo),
20. 20
DEA: The CCR Model…
Shoe Shops: Example (Single Input and Single Output Case) Following
Table shows 8 DMUs with 1 input (Employee) and 1 output (Sale). (The former example)
v*=0.5
u*=0.5
𝑢, 𝑣 >= 0
The optimal solution, easily obtained by
simple ratio calculations, is given by (v* =
0.5, u* = 0.5, 𝜃∗
= 0.5). Thus, the
CCR-efficiency of ‘A’ is 𝜽∗
= u* = 0.5
We can evaluate the efficiency of DMU A, by solving the LP
problem below:
21. 21
DEA: The CCR Model…
Shoe Shops: Example (Single Input and Single Output Case) …
Definition: Reference set
o If DMU A is evaluated, its optimal solution can make DMU B’s efficiency
equal to 1, then B is a reference set to A.
o A’s optimal solution is (v* = 0.5, u* = 0.5). In this case, DMU B’s efficiency
is u * y/(v * x)=0.5*3 /(0.5 * 3) = 1.
o Thus, the performance of B is used to characterize A and rates it as inefficient
even with the best weights that the data admit for A.
The efficiency of B can be similarly evaluated from the
data in Table by:
The optimal solution is (v* = 0.3333, u* = 0.3333, 𝜽∗= 1) and B is CCR-efficient.
Note: The optimal solution for B is different from A’s
22. 22
DEA: The CCR Model…
Similarly, all DMUs’ efficiencies can be obtained as follows:
No. DMU Score Rank Reference set
1 A 0.5 6 B
2 B 1 1 B
3 C 0.6666667 4 B
4 D 0.75 3 B
5 E 0.8 2 B
6 F 0.4 8 B
7 G 0.5 6 B
8 H 0.625 5 B
How to improve the
performance of inefficient
DMU D?
Employee
24. 24
DEA: Models Selection
DEA Models: CCR, BCC, FG, ST
o The main difference of these four models attributes to their different
production possibility sets and corresponding efficient frontiers.
o The production possibility set is an assumption of production functions of
DMUs’ inputs and outputs, defined as P(x, y)={(x, y)| x can produce y}.
Therefore, the production possibility set seems feasible production area.
o The efficient frontier is the positive edge of production possibility set .
Different models selected may obtain quite different evaluation results, therefore, it
is better to use an appropriate model before using DEA.
Which model selected depends on return to scale assumptions of the true
production functions
0 1 2 3 4 5 6 7 8 9 10
0
1
2
3
4
5
6
7
Employee
Sales
DMU
DB
C
A
E
H
F
G
CCR efficient frontier
BCC efficient frontier
FG efficient frontier
ST efficient frontier
CCR: Constant returns-to-scale assumption
BCC: Variable returns-to-scale assumption
ST: Increasing returns-to-scale assumption
FG: Decreasing returns-to-scale assumption
25. 25
How to solve DEA models: Software
Matlab
– (www.mathworks.cn/products/matlab/)
Efficiency Measurement System (EMS): developed under the
supervision of Prof. Emmanual Thanassoulis and Ali Emrouznejad.
– (http://www.wiso.uni-dortmund.de/lsfg/or/scheel/ems/)
DEA-Solver: a software based on EXCEL
– (www.deafrontier.net/joezhu/)
26. 26
Data Envelopment Analysis (DEA)
“GOOD REVIEWS”
Seiford L M. A bibliography for data envelopment analysis (1978-1996). Annals
of Operations Research, 1997, 73: 393-438.
Cook W D, Seiford L M. Data envelopment analysis (DEA)–Thirty years on.
European Journal of Operational Research, 2009, 192(1): 1-17.
Dyson R G, Allen R, Camanho A S, et al. Pitfalls and protocols in DEA.
European Journal of Operational Research, 2001, 132(2): 245-259.
The last review is very important for DEA researchers, for it explains some key
problems unsolved in DEA field.