Social Network Analysis Of Intangibles
•
8 likes•1,586 views

This presentation covers the application of Social Network Analysis in the study of intangibles such as emotions and motivations as these are the real drivers of organizational performance

Recommended
Recommended
More Related Content
Viewers also liked
Viewers also liked (12)
More from Ali Anani, PhD
More from Ali Anani, PhD (20)
Recently uploaded
Recently uploaded (20)
Social Network Analysis Of Intangibles
- 1. Ali Anani SOCIAL NETWORK ANALYSIS OF INTANGIBLES
- 2. INTRODUCTION- VISUALIZING INTANGIBLES Social Network Analysis (SNA) and Organizational Network Analysis (ONA) are continuously gathering momentum in studying relationships among agents or actors of these networks I noticed the scarcity of applying SNA and ONA in networks in which actors are not humans, but intangible factors such as values and emotional intelligence.
- 3. TWO EXAMPLES OF POTENTIAL APPLICATIONS I wish to introduce two ideas for analysis by using the tools employed in SNA One example is related to the study of organizational performance A second example is related to the study of human emotions and their interactions I employ a different technique than those I used in three previous presentations(1, 2, 3)
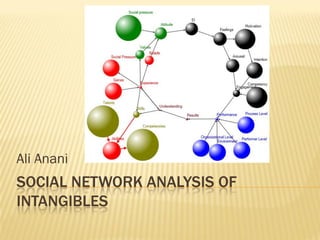
- 4. ANALYSIS OF ORGANIZATIONAL PERFORMANCE Donald Clark Donald published an impressive chart showing the linkages of factors affecting organizational performance. I reproduced the chart in a SNA format to allow for the study of the interacting parameters using NodeXL Excel Template developed by Microsoft.
- 5. THE RATIONALE Soft skills are receiving widening attention for their role in enhancing organizational performance. As we talk about centrality of human agents; by the same token we may discuss the motivators that cause these actions.
- 6. THE PERFORMANCE NETWORK In this presentation a directed relationship has been assumed between all factors that interact to yield the observed performance. EI stands for Emotional Intelligence The resulting network shows the type of interactions and their consequences The size of vertices is proportional to the Closeness Centrality
- 8. THE PERFORMANCE NETWORK- 3 We have four clusters with components of each cluster sharing the same color in this “Circle” arrangement.
- 9. THE PERFORMANCE NETWORK- 2 The overall metrics of the network are: Maximum Vertices in a Connected Component 15 Maximum Edges in a Connected Component 19 Maximum Geodesic Distance (Diameter) 7 Average Geodesic Distance 3.09 Graph Density 0.09
- 10. REMARKS The low graph density (0.09) suggests the possibility of having more interactions among performance agents There exists differences in other parameters such as Betweenness Centrality, Closeness Centrality, Ejgenvector Centrality and Clustering Coefficient. See next slide. Refer in particular to the differences in the Closeness Centrality
- 11. REMARKS- 2 SHOWING IMPORTANCE OF THE CLASSIFYING FACTOR CLOSENESS CENTRALITY 6.000 5.000 4.000 Betweenness Centrality 3.000 Closeness Centrality Eigenvector Centrality Clustering Coefficient 2.000 1.000 0.000 0 10 20 30
- 12. THE HAREL-KOREN FAST MULTISCALE- ANOTHER FACET OF THE NETWORK
- 13. QUICK INSPECTION Inspection of the performance network factors may reveal areas that deserve rethinking. For example, that there exists no direct linkage between engagement and values may deserve a second thinking.
- 14. EMOTIONS AND THEIR INTERACTIONS Disagreements on emotions are common, including the agreement on basic emotions whether there are six or eight of basic emotions. The transformation, mixing and overlapping of emotions are also topics open for varying opinions. For excellent references refer to Personality and susceptibility to positive and negative emotional states and Anger and Disgust: Discrete or Overlapping Categories?
- 15. SUMMARY OF FINDINGS The first eight rows comprise the eight basic feelings with their edges colored in orange in the next slide To verify the mixing of two emotions such as Fear + sadness to give surprise a directional relationship was drawn, and in this case from fear to surprise and sadness to surprise
- 16. THE CIRCLE ARRANGEMENT OF FEELINGS WITH VERTICES SIZED TO CLOSENESS CENTRALITY
- 17. A SECOND VIEW: HAREL-KOREN FAST MULTISCALE
- 18. ADDING A DYNAMIC FILTER By increasing closeness centrality from 1.7 to 2.15 these are the remaining feelings
- 19. AN EXTRA GRAPH FFOR CLARITY OF THE NETWORK Emotional clusters- spheres with same color include the components of each cluster
- 20. THE GREED – FEAR QUADRANT The next slides elaborate on the greed – fear quadrant and the possibility of producing different paths (bifurcation) depending on which quadrant we are in. These slides show the complexity of emotions as well. Such graphs with the aid of emotional network analysis may help in uncovering the way emotions interact. SNA are for intangible factors as well
- 21. THE GREED – FEAR QUADRANT High High fear, high fear, low greed greed Fear Fear-Greed Quadrants Low Low fear, low fear, high greed greed Greed
- 22. Surprise + Fear yields awe High fear + acceptance (loss of High fear, high greed greed) yields to Fast bifurcation between self-control contempt and lack of it. Rate of bifurcation may Fear lead to complex behavior Fast bifurcation between self-control and lack of it. Rate of bifurcation may lead to complex behavior Low fear, high greed Low gives fear, low High anticipation Surprise mixed greed with joy yielding with sadness to optimism yield disappointment Greed