PepsiCo, Palakaad
•
2 likes•1,218 views

This is a presentation from PepsiCo, one of the finalists at the 5th CII-GBC National Award for Excellence in Water Management in 2008 The awards are in 2 categories, Within the Fence for work done on minimizing the organisations water footprint, and Beyond the Fence for work done in the community around the industry. This presentation was in the "Within the Fence" category. We thank CII and the respective companies for giving us permission to upload these presentations on the India Water Portal website for dissemination to a wider audience.

Recommended
Recommended
More Related Content
More from India Water Portal
More from India Water Portal (20)
Recently uploaded
Recently uploaded (20)
PepsiCo, Palakaad
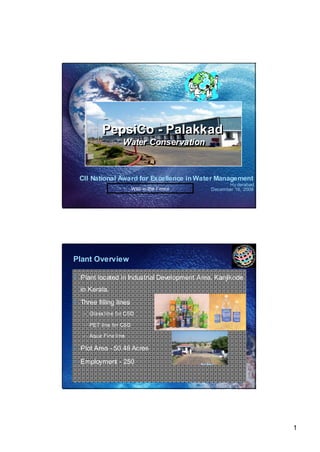
- 1. PepsiCo - Palakkad Water Conservation Water Conservation CII National Award for Excellence in Water Management Hy derabad With in the Fence December 16, 2008 Plant Overview • Plant located in Industrial Development Area, Kanjikode in Kerala. • Three filling lines – Glass line for CSD – PET line for CSD – Aqua Fina line • Plot Area - 50.48 Acres • Employment - 250 1
- 2. Manufacturing Process Sugar Purification CO2 Purification SILICA ALUMINA Sugar CO CARBON MICRON 2 SUG R A CA B R ON PA C LE RTI T MA HER L VAPORIZATION MULTI- MEDIA DISSOLU N TIO PUR C A N IFI TIO FI TR L ATIO N T TMEN REA T FIL TRA ION T Tre ate d Tre ate d Liquid S ugar CO2 Filling Blendi ng Concentrate • Tech nol og y-in tensiv e Tre ate d Water • High precisi on Water Purification equi pme nt COAGULATI N O OZONE SAND ULTRA REVERS OSM E OSIS • Stringe nt proce ss ION-E XCHANGE CHLORINE CARBON V IOLET con trols to e nsure Water adhere nce to q uality PRI A M RY PR R IMA Y PAR LE TIC M O ICR N FINAL PUR A N IFIC TIO DISINF TIO EC N FILTR TIO A N FILT TIO RA N D FECTIO ISIN N stan dards. PepsiCo’s Vision Positive water balance — going beyond zero Water Recharge a t Plant lev el + Water I nitiativ es at Com munity lev el + > Water used in manufacturi ng plants Promoting w ater Conserv ation measures in agriculture CREDITS > DEBITS As a result of this focus, water was revalued 2
- 3. What we’ve accomplished on “debit” side of the equation SCO RECARD 2008 4.5 4 • 60% water u sage reduction in 3.5 2008 over 2004 (4.41 to 1.77 3 L/L) 2.5 2 • 77% reduction in effluent over 1.5 2001(3.41 to 0.77 L/L) 1 • The journey continues… 0.5 0 2 004- 2 005- 2006- 2007- 05 06 07 08 2008 vs. 2004: > 250 Million L saved 2008: We could save another 16 Million liters Now… Now…what about the credits? We continue to achieve water “credits” through recharge of water resources Surface water desilting chambers • Roof water harve sting Water balance at our facilities • Total Cons:153 • Surface water – million L/ yr st ructure--pilots • Total recharge: – Palakkad plant – 108 million L/yr • The results: – 71% recharge of the aquifer at Palakkad Rain water su rface infiltration pond These results reinforced that our goal of positive water balance is possible! 3
- 4. Palakkad Water Strategy In 4R Process RWH Conse rve Source (Rechar ge) Water Strategy At Discharge ZERO In T he Co mm un ity CSR Rain Water Harvesting De silting chamber for pond for pond Surf ace Water Harv esting – Palakkad Plant 4
- 5. Roof Water Harv esting – Palakkad Plant 5
- 6. Global Best in Class WUR in Beverages from Benchmarking Survey 7 6.1 6 5.2 5 4.7 Water Use Ratio 4 0.8 L/L Better 3 2.5 2 2 1.6 1.7 1 Palakkad 0 CSD CSD w/ Spring Water Beer - Small Beer - Medium Beer - Large Dairy Refillable Brewery Brewery Brewery Containers Source: WBCSD R eport Zero based targeting Roadmap for reduction • Define specifications of water to be used at each step in the process • Determine quantity and quality of discharge at each stage • Identify opportunities for recycling, treatment and technology to be deployed • Discard as effluent after establishing that it is unfit for recycling 6
- 7. Water Water use Water sustainability optimization Consu mption ETP lo ad Rain water Recycle Recover harvesting Redu ction Redu ction Imp act on Energ y 4R Ground W ater Table “When the well is dry, we learn the worth of water.” --Benjamin Franklin 7
- 8. Approach TPM WAY • Assess current situation • Estimate Losses • Take Loss Reduction Target • Identify Losses PLAN • Identify Projects • Formation of Task force / Teams • Deploy 4R Tool DO • Implement Solutions ACT • Check Results • Plan further actions CHECK Estimate Losses • Best in Pepsi 1.6 lits/lit • Palakkad plant @ 4.4 lits/lit (25 lit/8oz case) in 2004 • Potential for reduction = 2.8 lits/lit ( 15.9 lit/8oz case) – This translate s to 350 kL of water sa ving potential per day. • Zero based calculation – 8 oz case content s = 5.664 lits – Evaporation losse s = 1.0 lits – This equals to 1.2 lits/lit of water consumed – this is the ab solute minimum if the effluent discharge from ETP is to be ZERO 8
- 9. Case Study Target Present 1.69 Ltr/Ltr Av g for 4.9 2004-05 4.4 lit / li t 4.4 3.9 3.4 G O 2.9 O 2.4 D 1.9 1.4 2004 2005 2006 2007 2008 2009 Target lit/lit Achieved Reduction in Chemical Usage Over 2006 Chemical consumption Trend 45000 40000 35000 30000 25000 In Kgs 20000 15000 10000 5000 0 06 07 8 07 08 06 07 08 07 08 06 8 06 06 06 07 07 0 .0 n p. ar ly ay ar n ly ar ly n ay v ep y p v Ja Ja No Ja No Ma Ju Se Se Ju Ju M M M M M S Month Caustic Salt HCL 9
- 10. Solid waste Management – ETP Sludge Sludge Generation Avg/Month 3500 3000 3000 2500 Solid waste in Kgs 2000 1500 Tar get 1000 588 500 197 0 0 2006 - 07 2007 - 08 2008 - 09 2009 - 10 year ETP Sludge B ACKW ASH W ATER RECOVER STE AM CONDENS ATE BOTTLE W ASHER CIP WATER REUSE TRE ATED EFFLUENT AF-RO REJ ECT RECYCLE PET RINSE W ATER SF AIR SCORING REDUCE FLOOR CLE ANING 10
- 11. Case Study Water Conservation REDUCTION OF WATER USE BY COMPLETE USAGE OF ETP TREATED EFFLUENT AFRO Reject – Opportunity to Improve Opportunity: Currently AFRO reject being used in ETP Tertiary Treatment & permeate used for Utilities & TDS balancing. ETP Treated Effluent is having all the required parameters to treat through ETP UF RO, but due to AFRO reject availability Plant is using effluent for own land discharge to develop green field. Effective use of Treated Effluent through ETP UF RO could save another 17KL/Hr. 11
- 12. PDCA PI Guidelines for Usage Compile & Dis cus s PLAN Findings M odificat ions & Reus e Pot ent ial Addit ions A CT DO Why-Why Pay Back Es timat e Cost Analysis Effect ivenes s Rais e C APEX done Sus t ainabilit y Define U s age CHEC K Analysis for Reuse Potential • AFRO Reject is having more or less same Qualities of Raw Water due to permeate re-circulation. • Additional Generation of permeate through new CSD RO could save another 12 KL/Hr out of 17KL which is now being pumped to ETP UF RO. • Proposed CSD RO can be able to treat this Reject. • This phenomenon prompted team to work on e stimated reduction of TDS through New RO. 12
- 13. Estimated Savings • AFRO Run Hours/Day: 20 • Total Reject Generation @ 17KL= 17*20 = 340 KL • Permeate Generation through proposed CSD RO @ 12KL/Hr for 20 Hrs = 12*20 = 240 KL • Balance 100KL will be pumped to ETP UF RO. • There will be direct reduction of 240KL/Day in Gross Water Usage of Plant. Approximate 7 0 Mill ion L ann uali ze d Water Sav ings TASK PLANNING – 5W-1H What Where When Who Why How? Reduce ETP UFRO Daily QC This Reuse Usage of f eed Exec/ETP activ ity AFRO AFRO associate propmts Reject in Reject in complete the process ETP UFRO recy cle of only . Tre ated Eff luent. Reuse of WTP & Propose f or AFRO Production During QC To optimi ze New RO in Reject f or processes AFRO Exec/WTP the water CSD WTP process Run associate consumptio to recycle n of the AFRO Plant reject. 13
- 14. PROPOSED CSD RO SCHEMATIC WITH TDS BALANCING Bore Well Water BoreWel l Water ST- UG Sump BoreWel l Water 450 KL 22 KL @ 550TDS < 10 T ,4 KL DS Rej ect AQUA 26KL @500 TDS Permeate @<10 TDS SUMP AF RO PSF RAW ACF Permeate W R ATE 2 3 RO Reject @ 800 TDS For Aqu n Producti on afi a 11KL @ 15 ppm TDS ST- 1 KL Mi scell aneous * 8 KL for G * RB SR.COAG 620TDS INTERME <400TDS PSF ACF ACF 38 KL @ 800 Tds DIATE 1 1 2 18 KL for PET* Propose d Reuse * Maximum LimitsMen tioned For FLO W * Mi n mu L mits Mentioned For TDS i m i New CSD RO Suppli er: GE Water Capacity : 12KL/Hr Project Cost: 40 Lac Time : 6 Weeks AF Reject Collection Tank 14
- 15. Consumption Target – Total Plant 2 1.95 1.94 1.9 1.85 % 1.8 1.77 1.75 1.7 1.65 2007 2008 KL/Day REDUCTION OF 0.17 L/L TRANSL A TES TO REDUCTION OF 120 KL/DAY Actions towards Water reduction Sr Actions Benefits Cost Date Rs’000 1 Wor kout TD S esti mati ons Proper usag e i denti fication for Wk – 1 pre & exi t R O and Reject Str eam & D esign proposed us e. consider ation 2 Esti mate N et Benefit to Esti mati ng Pay Bac k & Wk – 2 the Plant and esti mated Res ourc e Sustai nabilit y water us age r ati o. 3 Provi de 50KL Storag e Storag e AFRO rej ect in c ase 450 Wk – 3 tanks for both feed & any s toppag es i n the new C SD per meate. RO. 4 Re-dir ect Rej ect line to Enable AFR O storag e 100 Wk – 4 CSD R O F eed T ank. 5 Connect CSD R O Per meate us age opti miz ati on 100 Wk – 5 per meate to Stor age based on the r equirement Tank. 15
- 16. Result of New CSD RO Project 300 70% of Savings in KL Targeted Overall 240 240 240 Savings 200 220 220 220 200 180 180 160 140 G O 100 O D 0 Y Y B E PT G EC N V AR R A N FE L AU O JA AP JU JU SE M M D N Month Imple mentation • 2 Major Projects Implemented in 2007-08 resulting in Annualized Water Savings of 70,000 KL (CSD RO & AF Rinse Water Recovery) • Redesign, Rethink initiatives Identified & implemented, resulting in a saving of 15,000 KL in the year 2008. • 18 Core consumption points metered on daily basis. • Abnormalities paid higher attention by top to bottom. 16
- 17. Results 4.9 4.4 3.9 Backwash 3.4 Recover y G 2.9 O 2.4 O D 1.9 1.4 2004 2005 2006 2007 2008 2009 Target lit/l it Actual l it/ lit B/W NEW Dacausticizer Recovery CSD RO Overall Results • Total Savings of 240 Million Ltrs over 2004. • No.2 on YTD Basi s acro ss 43 Pepsi Plants in India with 1.69 Lit/Lit Water Con sumption. • Zero Di scharge from the plant • Controlled Effluent Generation. (0.69 KL/KL of Bev) 17
- 18. Way Forward •Identifying further opportunities to save water through proce ss effectiveness. •Rede sign & Rethink Strategy added to 4R (No other stream available to deploy 4R) •Reduction of Effluent by adopting latest technologies. (Electro Chlorinator) •Optimizing total recovery from the existing water recovery sy stem s. •Con sulting Experts to generate ideas on water con servation. “The significant problems we face cannot be solved at the same level of thinking we were at when we created them.” --Albert Einstein 18
- 19. THANK YOU! 19