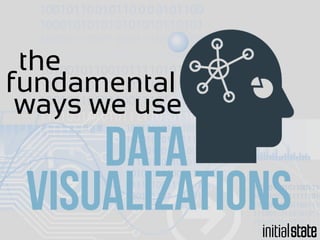
Fundamental ways we use data visualizations
•
233 likes•55,706 views

The fundamental ways we use data visualizations effectively (with examples).

Recommended
Recommended
More Related Content
What's hot
What's hot (20)
Viewers also liked
Viewers also liked (12)
Similar to Fundamental ways we use data visualizations
Similar to Fundamental ways we use data visualizations (20)
Recently uploaded
Recently uploaded (20)
Fundamental ways we use data visualizations
- 4. the connection the eye between and brain ... fast
- 5. the brain receives Mb/s 8.96 megabits of data8.96 from the eye every second Koch, K., (2006). How Much the Eye Tells the Brain. Current Biology, 16(14), 1428-1434 Retrieved from http://www.sciencedirect.com/science/article/pii/S0960982206016393
- 6. the speed of sight 8.96Mb/s
- 7. the average person comprehends 120 wordsper minute reading
- 8. that is equivalent to b/s 81.6 bits of data81.6 per second
- 9. let’s compare reading comprehension speed visual comprehension speed *not close to fitting on this chart
- 10. we are not wired to read fast
- 11. we are wired to visualize fast
- 12. data visualizations when used can be Awesome right way Tools the
- 13. there are five we use fundamental ways data visualizations 5effectively
- 14. Bike Rides and Running Routes Heat Map from Strava Labs Retrieved from http://labs.strava.com/heatmap/#6/-83.63437/39.30140/blue/both 1To analyze
- 16. these tools help us trendssee anomalies correlations patterns
- 17. Waves Interactive Data Visualization From Initial State Retrieved from https://initialstate.com/Tools/Waves
- 19. Student Performance Dashboard by Stephen Few Retrieved from http://www.perceptualedge.com/blog/?p=1466 a well-designed dashboardallows you to Analyzemassive datasets At-a-glance
- 20. Student Performance Dashboard by Stephen Few Retrieved from http://www.perceptualedge.com/blog/?p=1466
- 21. 2To discover
- 22. if you need to find something buried inside data points1,000,000
- 23. would you rather reador 1,000,000 data points See ?
- 24. what if you don’t know exactly what it is you are even looking for?
- 25. you can’t build a dashboard for that!
- 26. interactive data visualizations Lines Interactive Data Visualization From Initial State Retrieved from https://initialstate.com/Tools/Lines let you mine data to discover information
- 28. the right data visualization can contextprovide engagethe audience emphasizekey points
- 29. great speakers use visuals to make their memorable story
- 30. 4To Tell A Story By Itself
- 31. sometimes story the data visualization is the ... a story without a sentence
- 32. Brazil World Cup 2014: Who’s Your Pick? by InfographicBox IDS Retrieved from http://visual.ly/brazil-world-cup-2014-who’s-your-pick
- 33. 5To teach
- 34. our brains perform and more efficiently more information is retained when we learn from visuals
- 35. to analyze to discover to support a story to tell a story to teach 1 2 3 4 5 the fundamental ways we use data visualizations
- 36. https://www.initialstate.com we build data visualizations for product debug