InMobi Insights Network Research - Australia Q1 2012 vs. Q1 2011
•
1 like•710 views

InMobi Mobile Insights Report Quarter 1, 2011 vs Quarter 1, 2012: Mobile advertising grows 156% in Australia; Tablet device enters top 5 handsets. More information at: http://www.inmobi.com/press-releases/2012/04/24/inmobi-mobile-insights-report-quarter-1-2011-vs-quarter-1-2012-mobile-advertising-grows-156-in-australia-tablet-device-enters-top-5-handsets/?mkt_tok=3RkMMJWWfF9wsRow5%2FmYJoDpwmWGd5mht7VzDtPj1OY6hBkuJLuJK1TtuMFUGpsqOOCQDA0SGg%3D%3D
Recommended

Recommended
More Related Content
More from InMobi
More from InMobi (20)
Recently uploaded
Recently uploaded (20)
InMobi Insights Network Research - Australia Q1 2012 vs. Q1 2011
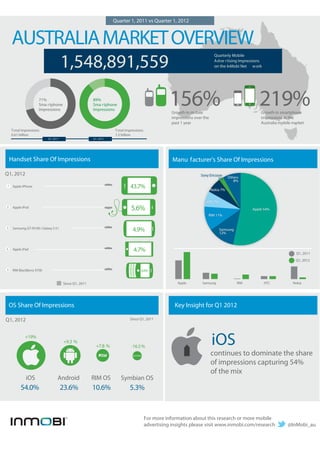
- 1. Quarter 1, 2011 vs Quarter 1, 2012 AUSTRALIA MARKET OVERVIEW 1,548,891,559 Quarterly Mobile Adve r tising Impressions on the InMobi Net w ork 71% Sma r tphone Impressions 89% Sma r tphone Impressions 156% Growth in mobile 219% Growth in smartphone impressions over the impressions in the past 1 year Australia mobile market Total impressions Total impressions 0.61 billion 1.5 billion Q1, 2011 Q1, 2012 Handset Share Of Impressions Manu facturer’s Share Of Impressions Q1, 2012 Sony Ericsson 2% Others 8% Apple iPhone 4.2% 43.7% Nokia 7% HTC 7% Apple iPod 5.6% Apple 54% RIM 11% Samsung GT-I9100 ( Galaxy S II ) 4.9% Samsung 12% Apple iPad 4.7% Q1, 2011 Q1, 2012 RIM BlackBerry 9700 4.0% Since Q1, 2011 Apple Samsung RIM HTC Nokia OS Share Of Impressions Key Insight for Q1 2012 Q1, 2012 Since Q1, 2011 +19% +9.3 % +7.8 % -16.5 % iOS Symbian continues to dominate the share of impressions capturing 54% of the mix iOS Android RIM OS Symbian OS 54.0% 23.6% 10.6% 5.3% For more information about this research or more mobile advertising insights please visit www.inmobi.com/research @InMobi_au