SlideShare a Scribd company logo
1 of 7
Download to read offline
Journal of Economic Impact, 1 (1) 12-18, 2019
12
Available Online
Journal of Economic Impact
http://www.scienceimpactpub.com/jei
DETERMINANTS OF INTRA-HOUSEHOLD INCOME INEQUALITY: A CASE STUDY FROM RURAL
PAKISTAN
Sania Malik a,
*, Muhammad Abdullah b
, Iqbal Javed a
a
Department of Economics, University of Lahore, Sargodha Campus, Sargodha, Pakistan
b
Department of Management Sciences, Khwaja Fareed University of Engineering & Information Technology, Rahim Yar Khan, Pakistan
HIGHLIGHTS
 Inequality has emerged at macro level but by finding the solutions of the problem our debates come to the micro level. By exploring the root
causes of income inequality at micro level we cannot ignore the role of a household head for effective planning for their children.
 The household members less than the selected age are considered under training to make them responsible person for contribution in total
household income.
 This approach to family welfare analysis is a new dimension may become controversial as the hypothesized explanatory variables mostly
belongs to household head who has decision making powers, as the determinants of intra-household inequality.
 The significance of most of the variables shows some reality that household head in some way become the reason of intra-household
inequality.
 The positive relationship between number of females and within family inequality is a call for sound policies to reduce gender gap and get
women into mainstream economy.
 The fall in occupations such as farming and livestock sector and other elementary occupations are also becoming the reason of intra-
household inequality which needs policy maker’s attention.
ABSTRACT
Inequality has emerged at macro level but by finding the solutions of the problem our debate comes to the micro level.
By exploring the root causes of income inequality at micro level we cannot ignore the role of a household head for
effective planning for their children. The purpose of this study is to estimate the income inequality of households and to
find the impact of the most relevant factors on the income inequality at a household level. The data about 400 household
including 2266 individuals is extracted from the Household Integrated Economic Survey (HIES) which is conducted in
2015-16 under special survey namely Household Integrated Income and Consumption Survey. This approach to family
welfare analysis is a new dimension may become controversial as the hypothesized explanatory variables mostly belongs
to household head who has decision making powers, as the determinants of intra-household inequality. The significance
of most of the variables shows some reality that household head in some way become the reason of intra-household
inequality. Though some results are not according to expectations such as negative relationship of intra-household
inequality and household size but this is trending result as a positive sign towards more sharing and cooperation within a
family. The positive relationship between number of females and within family inequality is a call for sound policies to
reduce gender gap and get women into mainstream economy. The fall in occupations such as farming and livestock sector
and other elementary occupations are also becoming the reason of intra-household inequality which needs policy maker’s
attention.
Keywords: Intra-household income inequality; rural inequality; family occupations
* Correspondence: Department of Management Sciences, Khwaja Fareed University of Engineering & Information Technology, Rahim Yar Khan,
Pakistan;
Email: dr.abdullah@kfueit.edu.pk
Introduction
By the end of 20th century, the research on intra-
household inequality begun when attention shifted from
inequality at macro level to inequality at micro level intra-
household inequality. Before that it was thought as private
matter of households and impossible to measure. Then it
first started by taking mean of household data to find intra-
household inequality (Haddad & Kanbur, 1990).
Afterwards the intra-household inequality calculated by
taking expenditure data on food and clothing of individuals
in the household (Browning et al., 1994; Browning &
Chiappori, 1998). The research with labor supply data also
conducted by many (Apps & Rees, 1996) to reveal the
within household inequality in wage rate, working and
leisure time. But intra-household inequality has many other
dimensions such as decision making and control on
household resources by household head. Intra-household
inequality is important in measurement of inequality and
poverty. It is inevitable to investigate intra-household
inequality for sound economic policy which will lead to the
wellbeing of individuals. In existing literature mostly
individual welfare is computed by taking average welfare
of households. Some have created link between average
household inequality and intra-household inequality
(Haddad & Kanbur, 1992). The inequality in incomes or
Malik et al. / Journal of Economic Impact, 1(1), 12-18 (2019)
13
Determinants of Intra-Household Income Inequality
expenditure of individuals of household exists but
aggregate data of household conceals deprivation within
the household which leads to underestimation of inequality
and poverty in society (Lise & Seitz, 2011) and this leads
to wrong welfare policies and wrong estimates of income
for taxation in any country.
Intra-household inequalities present in both
developed (Apps & Savage 1989; Browning & Chiappori,
1998) & developing nations (Haddad & Kanbur 1990;
Kumar and Mahadevan, 2011) but more in poor countries.
These studies had shown that intra-household inequality is
high in underdeveloped nation. Moreover, in resource-
constrained households with joint family system where
altruism is weak and selfishness exist, the probability of
distribution asymmetries remain high that give rise to poor
individuals within well settled household. It has strong
implications in developing countries where resource-
constrained households and family system are more
prevalent than in developed nations. In such developing
societies, it is possible that in some cases extreme poverty
is hidden. Thus intra-household inequality estimation is
crucial. Though, it is not easy to target individuals within
household and in some cases may be impossible. But intra-
household inequality is helpful for policymakers to make
sound policy.
Existing studies on intra-household inequality
ignored the influence of decision makers (household head)
on household income distribution. The purpose of this
research is twofold. First, intra-household inequality at
income levels of individuals in the household in both rural
and urban society. Second, determinants that affect within
household inequality particularly impact of household
head characteristics and decision making on intra-
household inequality.
Role of decision maker in intra-household inequality
The concept of within household inequality was first
developed by Sen (1984). In growing literature, it has been
examined that whether resources are equally distributed
within household (Thomas 1990; Phipps & Burton 1995;
Lise & Seitz, 2011; Kumar & Mahadevan, 2011). These
studies have recognized that rise in average welfare of
individuals within a household is not necessarily attached
by a decline in intra-household inequality in welfare. Thus,
by neglecting this dimension, there is lack of policy
intervention that target intra-household inequality.
Most of the existing literature has considered unitary
household decision making and has used collective models
by considering single utility function of household
(Bourguignon & Chiappori, 1992; Browning & Chiappori,
1998). Other non-unitary models are based on bargaining
rule in decision making of household members related to
allocation of resources, i.e. consumption and labor supply
decisions. These are based on cooperative decision making
(Manser & Brown, 1980; McElroy & Horney, 1981;
Lundberg & Pollak, 1994) and non-cooperative decision
making (Chen & Woolley, 2001; Konrad & Lommerud,
2000; Lundberg et al., 1997; Udry, 1996). Another
phenomenon is also present as first income goes in control
of household head and then it is redistributed by his
decision as described by Becker (1974, 1981) in his ‘Rotten
Kid Theorem’ using unified household model.1
So, the
decision of household head affects intra-household
inequality among other economic and cultural factors. The
reason is social values bondage that the main economic
provider control family decision making. Household head
control in the family is twofold; control on management of
family finances and influence on family decision making.
This study which is conducted in Pakistan will explore a
new dimension in which household Gini is taken on left-
hand side of equation and determinants that affect intra-
household inequality on right-hand side.
Methodology
The data used in the study is micro data of Household
Income and Expenditure Survey collected by Pakistan
Bureau of Statistics in 2015-16. During the current study
under hand, total 400 households with 2266 individuals
from Punjab are included, among them 200 are rural
residents and 200 are urban residents. They are linked
mainly to occupations such as administrative services,
professional services, teaching, manufacturing and retail
sale business, construction and real estate, elementary
occupations, farming and livestock. In rural areas, mostly
people are less educated and low skilled engaged in
farming and livestock, and some are migrated to cities, for
working in industries of garments and construction and
others are engaged in elementary occupations.
Intra-household inequality
To find intra-household inequality we have used
annual income data of individual’s in a household by
including individuals above 25 years of age. Like previous
studies we have used the method of Gini coefficient to find
intra-household inequality (Haddad & Kanbur, 1992;
Thomas, 1990).
1
Becker’s "Rotten Kid Theorem" (1974, 1981), this theorem suggests that
altruistic parents and their children maximize the same utility function,
even if the kids are selfish. If an altruistic parent provides a transfer to his
The formula of Gini coefficient:
Gini-coefficient = Area between Lorenz Curve and
Diagonal / Total Area under Diagonal
When G is based on the Lorenz curve of income
distribution, it can be interpreted as the expected income
children, then the children have incentives to behave in such a manner that
household income is maximized.
Malik et al. / Journal of Economic Impact, 1(1), 12-18 (2019)
14
gap between two individuals randomly selected from the
population (Sen, 1973)
The classical definition of G appears in the notation of the
theory of relative mean difference:
Where x is an observed value, n is the number of
values observed and x bar is the mean value.
If the x values are first placed in ascending order, such
that each x has rank i, the some of the comparisons above
can be avoided and computation is quicker:
Where x is an observed value, n is the number of
values observed and i is the rank of values in ascending
order.
G is a measure of inequality, defined as the mean of
absolute differences between all pairs of individuals for
some measure. The minimum value is 0 when all
measurements are equal and the theoretical maximum is 1
for an infinitely large set of observations where all
measurements but one has a value of 0, which is the
ultimate inequality (Stuart & Ord, 1994).
The simple linear regression model is used to check
the impact of different variables on intra-household
inequality. All the variables in the model are shown in table
1 by following the equation as;
The linear regression model is as:
Gi = βo+ β1AGE + β2REG + β3HHSIZ + β4NFEM + β5EDU +
β6OCC1 + β7OCC2 + β8OCC3 + β9OCC4 + β10OCC6 + β11OCC7
+ β12JSTAT + µ
Table 1: Description of variables
Variables Description
GINI (G) Gini coefficient of every household in the data
AGE Age of household head
REG Urban = 1; 0 = rural
HHSIZ Number of individuals in a household
NFEM Number of females in a household
EDU Education of household head
Occupation
OCC1
OCC2
OCC3
OCC4
OCC5
OCC6
OCC7
Dummy variable if professional, technician, then1; 0 otherwise
Dummy variable if clerk then 1; 0 otherwise
Dummy variable if teacher then 1; 0 otherwise
Dummy variable if farming and livestock then 1; 0 otherwise
Base category
Dummy variable if construction and real estate then 1; 0 otherwise
Dummy variable if elementary occupation then 1; 0 otherwise
JSTAT If paid employee then 1; 0 if self employed
Results and Discussion
All the variables in the model have different expected
results. Some variables’ results are not according to
expectations but this is due to trending dimensions. For
example it was expected that by increase in household size,
intra-household inequality will also increase but in our
study results are different.
Malik et al. / Journal of Economic Impact, 1(1), 12-18 (2019)
15
Determinants of Intra-Household Income Inequality
Table 2: Sample Statistics
Variables Mean Std. Deviation
Gini coefficient of individuals in a household .449 .1560
Age of household head 49.20 12.942
Urban or rural .500 .500
Household size 5.66 2.105
No of females in a household 2.90 1.436
Schooling years of household head education 7.33 4.072
Data Source: PBS data 2015-16
Mean values of all variables in table 2, where average
Gini coefficient is 0.45 means almost 45% inequality is
present between households. Average age of household
head is 49 years. The average number of members in a
family is 6 and average number of females in a household
is 3. The average number of schooling years of household
head is 7.
Table 3: Statistics related to occupation and job status
Variables Frequency Percentage
Professionals 23 5.8
Clerks 66 16.5
Teachers 13 3.3
Farming and livestock 74 18.5
Manufacturing and retail sale 115 28.3
Construction and real estate 46 11.5
Elementary occupations 63 15.8
Paid employee 228 57
Data Source: PBS data 2015-16
The frequency and percentage of different
occupations is shown in table 3 where manufacturing and
retail sale business has highest frequency among all other
occupations as 28.3% of total households while teachers
are only 3.3% of total. Farming and livestock has the
second highest frequency as 18.5% people linked with this
occupation.
Table 4: Gini coefficient
Income inequality within a household
(0 means perfect equality and 100 means perfect inequality)
Lowest Gini index 0.15
Highest Gini index 0.70
Average Gini index 0.45
Source: Calculated by using HIES micro data
The Gini coefficient is shown in table 4, which show
the lowest and highest Gini coefficients among all
calculated Gini coefficient of every household separately.
Among them lowest Gini coefficient is 0.15 and highest
Gini coefficient is 0.70. Average Gini coefficient value
which is 0.45 shows total inequality between households
which is useful for policy makers for making the policies
for the welfare of households.
Malik et al. / Journal of Economic Impact, 1(1), 12-18 (2019)
16
Figure 1: Lorenz curves for lower and upper range of income inequality within households
Equality and inequality lines as 450
line shows the
perfect equality when Gini coefficient is 0 and Lorenz
curve 1 (dotted line) shows 15% inequality within a
household while Lorenz curve 2 (dashed line) shows a high
level of inequality within a family (say, 70%) as shown in
figure 1. These estimates clearly revealing that by taking
household as a single entity the estimates of inequality in a
society become wrong which further leads towards
misperceived policies to increase welfare in the society.
All the above described variables are assumed
determinants that cause intra-household inequality when
household head has a control over household resources;
finances and assets and decision making related to all
members of a family. In this case household head
characteristics and family background are the main factors
that affect intra-household inequality. This is mostly the
case of under developed countries where people are still
living in large units and joint family system which is in the
control of a single person. Moreover, mostly this household
head remains a main economic provider for a single large
family unit.
There is no multicollinearity between different
variables as shown in table 5. For model estimation, from
dummy variable occupation one category is considered as
base category such as OCC5 (manufacturing and retail
sale) which is common category in rural and urban
residents, for avoiding dummy variable trap (perfect
multicollinearity).
Table 5: Estimation of multicollinearity
Variables Tolerance VIF
AGE .934 1.070
REG .724 1.381
HHSIZ .418 2.395
NFEM .431 2.321
EDU .865 1.157
OCC1 .832 1.202
OCC2 .585 1.710
OCC3 .826 1.211
OCC4 .535 1.868
OCC6 .652 1.535
OCC7 .693 1.444
JSTAT .588 1.702
Source: Author’s calculations
Model summary is discussed where R square is 0.2
which is low but in line with other studies who find out
determinants of intra-household inequality by taking
individual expenditure data (Haddad & Kanbur, 1992;
Kumar and Mahadevan, 2011). The reason of low
coefficient of determination is that intra-household
inequality is not only affected by the determinants assumed
in this study but also by some other economic and cultural
factors. Overall the model is best because F- test is showing
significance value as shown in table 6.
Separate effect of each determinant on intra-
household inequality is estimated. Among these household
-20
0
20
40
60
80
100
0 20 40 60 80 100
equality
lorenz 1
lorenz 2
Malik et al. / Journal of Economic Impact, 1(1), 12-18 (2019)
17
Determinants of Intra-Household Income Inequality
head age has significant negative relationship with intra-
household inequality. The region has negative and
insignificant relationship with inequality. As existing
literature on intra-household inequality shows that within
household inequality exists in both developed and
developing nations but high in poor nations. Same in the
region’s case where more developed region (urban) has
less intra-household inequality as compare to rural areas
where mostly women are not allowed to work due to social
taboos. Household size has significant but negative
relationship with intra-household inequality. These results
are opposite to our expectations but it is possible as number
of a family members increases, the number of income
earners in family will also increase.
Table 6: Determinants of intra-household income inequality
Variables B
Std. Error
t
Sig.
(Constant) .529 .039 13.456 .000
AGE -.001 .001 -2.287 .023***
REG -.002 .017 -.112 .911
HHSIZ -.011 .005 -2.109 .036**
NFEM .021 .007 2.804 .005***
EDU .002 .002 .958 .339
OCC1 -.093 .033 -2.813 .005***
OCC2 -.056 .025 -2.261 .024**
OCC3 -.147 .044 -3.375 .001***
OCC4 .056 .025 2.250 .025**
OCC6 -.056 .027 -2.065 .040**
OCC7 .063 .023 2.702 .007***
JSTAT -.039 .019 -2.099 .036**
R 0.462
R Square 0.214
Adjusted R Square 0.189
F- test 8.759
Probability 0.000
Dependent Variable: Gini coefficient of individuals in a household; ** and *** significance at 5% level and 1% level respectively
The number of females in a household has positive
and significant relationship with inequality. This situation
is mostly seen in developing nations where women are less
educated and skilled, engaged in household chores. So,
they are considered economic burden on household head of
a family. Education of household has also positive and
insignificant relationship with inequality. Professional
workers, clerks, teachers and construction business have
significant and negative relationship with intra-household
inequality. In Pakistan, these are considered high income
earning sectors in which people mostly work as paid
employee. Farming, livestock and other elementary
occupation have positive and significant effect on intra-
household inequality. Farming and livestock sector is
neglected sector in Pakistan due to which the families
based on agricultural sector face resource-constraints
within household. Elementary occupations are less paid
works and the household head engaged in these
occupations are unable to support their family finances
efficiently. In case of job status, as paid employee will
increase intra-household inequality will decrease as
opposite to self-employment.
Conclusion
This approach to family welfare analysis is a new
dimension may become controversial as the hypothesized
explanatory variables mostly belongs to household head
who has decision making powers, as the determinants of
intra-household inequality. But the significance of most of
the variables shows some reality that household head in
some way become the reason of intra-household inequality.
Though some results are not according to expectations such
as negative relationship of intra-household inequality and
household size but this is trending result as a positive sign
towards more sharing and cooperation within a family. The
positive relationship between number of females and
within family inequality is a call for sound policies to
reduce gender gap and get women into mainstream
economy. The fall in occupations such as farming and
livestock sector and other elementary occupations are also
becoming the reason of intra-household inequality which
needs policy maker’s attention. There is need to be tested
this model again with larger sample size to get better
results. The primary data may be more appropriate for this
study as some important information related to household
decision is missing in HIES data. Despite its weaknesses,
this research has given way forward for more detailed
analysis on individuals’ income and expenditure data. Such
Malik et al. / Journal of Economic Impact, 1(1), 12-18 (2019)
18
researches would lead towards better understanding of
distributions of resources within a family. It also helps
government to make more competent welfare policies by
keeping individual level welfare phenomenon in mind.
References
Apps, P., Savage, E., 1989. Labour supply, welfare
rankings and the measurement of inequality, Journal of
Public Economics, 39, 335-364.
Bourguignon, F., Chiappori, P.A., 1992. Collective models
of household behavior: An introduction. European
Economic Review, 36, 355-364.
Browning, M., Bourguignon, F., Chiappori, P., Lechene,
V., 1994. Income and outcomes: A structural model of
intra-household allocation. Journal of Political
Economy, 102(6), 1067-1096.
Browning, M., Chiappori, P., 1998. Efficient intra-
household allocations: a general characterization and
empirical tests. Econometrica, 66 (6), 1241-1278.
Chen, Z., Woolley, F., 2001. A cournot-nash model of
family decision making. Economic Journal, 111, 722-
748.
Haddad, L., Kanbur, R., 1990. How serious is the neglect
of intra-household inequality. The Economic Journal,
100, 866-881.
Konrad, K.A., Lommerud, K.E., 2000. The bargaining
family revisited. The Canadian Journal of Economics,
33, 471–487.
Kumar, S., Mahadevan, R., 2011. Intra-household income
inequality and poverty in a small developing economy.
Journal of the Asia Pacific Economy, 143-162
Haddad, L., Kanbur, R., 1992. Intrahousehold inequality
and the theory of targeting, European Economic
Review, 36 (2), 372-378. https://doi.org/10.1016/0014-
2921(92)90093-C.
Lise, J., Seitz, S., 2011. Consumption inequality and intra-
household allocations. Review of Economic Studies,
78, 328-355.
Lundberg, S.J., Pollak, R., Wales, T., 1997. Do husbands
and wives pool their resources? Evidence from the
United Kingdom child benefit. Journal of Human
Resources, 32(3), 463-480.
Lundberg, S., Pollak, R A., 1994. Non-cooperative
bargaining models of marriage. American Economic
Review, 84, 132-137.
Manser, M., Brown, M., 1980. Marriage and household
decision theory-A bargaining analysis. International
Economic Review, 21, 21-34.
McElroy, M.B., Horney, M.J., 1981. Nash-Bargained
household decision: Toward a generalization of the
theory of demand. International Economic Review, 22
(2), 333-349.
Apps, P.F., Rees, R., 1996. Labor supply, household
production and intra-family welfare distribution,
Journal of Public Economics, 60 (2), 199-219.
Phipps, S., Burton, P.S., 1995. Sharing within families:
Implications for the measurement of poverty among
individuals in Canada. Canadian Journal of Economics,
28 (1), 177-204.
Sen, A., 1973. Economic inequality. Cambridge, MA:
Oxford University Press.
Sen, A., 1984. Values, resources and development.
Cambridge, MA: Harvard University Press.
Stuart, A., Ord, J.K., 1994. Kendall's advanced theory of
statistics. Vol.1: Distribution theory, 6th ed. 3 Volume
by A. Stuart and J.K. Ord. London: Hodder Arnold
Thomas, D., 1990. Intra-household resource allocation: An
inferential approach. Journal of Human Resources, 25
(4), 635-664.
Udry, C., 1996. Gender, agricultural production, and the
theory of the household. The Journal of Political
Economy, 104(5), 1010-1046.

More Related Content

What's hot

Trang Hoang_Research Paper
Trang Hoang_Research PaperTrang Hoang_Research Paper
Trang Hoang_Research PaperTrang Hoang
 
Institutional Foundations of Gender Inequality in Entrepreneurship across 24 ...
Institutional Foundations of Gender Inequality in Entrepreneurship across 24 ...Institutional Foundations of Gender Inequality in Entrepreneurship across 24 ...
Institutional Foundations of Gender Inequality in Entrepreneurship across 24 ...Dr. Larry Pino
 
2016 Citizen's Committee for Children of New York - Community Risk Ranking
2016 Citizen's Committee for Children of New York - Community Risk Ranking2016 Citizen's Committee for Children of New York - Community Risk Ranking
2016 Citizen's Committee for Children of New York - Community Risk RankingJonathan Dunnemann
 
Gender, social norms and the gender segmentation of labour markets: a case st...
Gender, social norms and the gender segmentation of labour markets: a case st...Gender, social norms and the gender segmentation of labour markets: a case st...
Gender, social norms and the gender segmentation of labour markets: a case st...Economic Research Forum
 
Social origins of inventors
Social origins of inventorsSocial origins of inventors
Social origins of inventorsmustafa sarac
 
Social enterprise - ACM
Social enterprise - ACMSocial enterprise - ACM
Social enterprise - ACMDotionmo7797
 
RPA Spatial Planning and Inequality Fourth Regional Plan Roundtable
RPA Spatial Planning and Inequality Fourth Regional Plan RoundtableRPA Spatial Planning and Inequality Fourth Regional Plan Roundtable
RPA Spatial Planning and Inequality Fourth Regional Plan RoundtableJonathan Dunnemann
 
Aspirations and women's empowerment: Evidence from Kyrgyzstan
Aspirations and women's empowerment: Evidence from KyrgyzstanAspirations and women's empowerment: Evidence from Kyrgyzstan
Aspirations and women's empowerment: Evidence from KyrgyzstanCGIAR
 
Variation in the role and coping mechanism of 4 ps beneficiaries in northern ...
Variation in the role and coping mechanism of 4 ps beneficiaries in northern ...Variation in the role and coping mechanism of 4 ps beneficiaries in northern ...
Variation in the role and coping mechanism of 4 ps beneficiaries in northern ...Alexander Decker
 
Spider Internship Fund Summer Fellowship LSanti
Spider Internship Fund Summer Fellowship LSanti Spider Internship Fund Summer Fellowship LSanti
Spider Internship Fund Summer Fellowship LSanti Laurina Santi
 
Gender Equality and Pro-Poor Growth - Women’s Economic Empowerment
Gender Equality and Pro-Poor Growth - Women’s Economic Empowerment Gender Equality and Pro-Poor Growth - Women’s Economic Empowerment
Gender Equality and Pro-Poor Growth - Women’s Economic Empowerment Dr Lendy Spires
 
Performance of women in small scale enterprises (ss es) marital status and fa...
Performance of women in small scale enterprises (ss es) marital status and fa...Performance of women in small scale enterprises (ss es) marital status and fa...
Performance of women in small scale enterprises (ss es) marital status and fa...Alexander Decker
 
Women in the labour force 23 9-2004
Women in the labour force 23 9-2004Women in the labour force 23 9-2004
Women in the labour force 23 9-2004VIBHUTI PATEL
 
Building a Notion of Equality: Thoughts on Women, Work and Welfare
 Building a Notion of Equality: Thoughts on Women, Work and Welfare Building a Notion of Equality: Thoughts on Women, Work and Welfare
Building a Notion of Equality: Thoughts on Women, Work and WelfareEconomic Research Forum
 
Session 2 d cigdem gedikli
Session 2 d cigdem gedikliSession 2 d cigdem gedikli
Session 2 d cigdem gedikliIARIW 2014
 
From targets of charity to citizens? Emerging lessons on gender-responsive so...
From targets of charity to citizens? Emerging lessons on gender-responsive so...From targets of charity to citizens? Emerging lessons on gender-responsive so...
From targets of charity to citizens? Emerging lessons on gender-responsive so...Economic Research Forum
 
11.examining gender difference in socio economic development
11.examining gender difference in socio economic development11.examining gender difference in socio economic development
11.examining gender difference in socio economic developmentAlexander Decker
 

What's hot (20)

Trang Hoang_Research Paper
Trang Hoang_Research PaperTrang Hoang_Research Paper
Trang Hoang_Research Paper
 
Institutional Foundations of Gender Inequality in Entrepreneurship across 24 ...
Institutional Foundations of Gender Inequality in Entrepreneurship across 24 ...Institutional Foundations of Gender Inequality in Entrepreneurship across 24 ...
Institutional Foundations of Gender Inequality in Entrepreneurship across 24 ...
 
2016 Citizen's Committee for Children of New York - Community Risk Ranking
2016 Citizen's Committee for Children of New York - Community Risk Ranking2016 Citizen's Committee for Children of New York - Community Risk Ranking
2016 Citizen's Committee for Children of New York - Community Risk Ranking
 
Gender, social norms and the gender segmentation of labour markets: a case st...
Gender, social norms and the gender segmentation of labour markets: a case st...Gender, social norms and the gender segmentation of labour markets: a case st...
Gender, social norms and the gender segmentation of labour markets: a case st...
 
Social origins of inventors
Social origins of inventorsSocial origins of inventors
Social origins of inventors
 
Social enterprise - ACM
Social enterprise - ACMSocial enterprise - ACM
Social enterprise - ACM
 
The Cost of Dropping Out of High School
The Cost of Dropping Out of High SchoolThe Cost of Dropping Out of High School
The Cost of Dropping Out of High School
 
RPA Spatial Planning and Inequality Fourth Regional Plan Roundtable
RPA Spatial Planning and Inequality Fourth Regional Plan RoundtableRPA Spatial Planning and Inequality Fourth Regional Plan Roundtable
RPA Spatial Planning and Inequality Fourth Regional Plan Roundtable
 
Aspirations and women's empowerment: Evidence from Kyrgyzstan
Aspirations and women's empowerment: Evidence from KyrgyzstanAspirations and women's empowerment: Evidence from Kyrgyzstan
Aspirations and women's empowerment: Evidence from Kyrgyzstan
 
Variation in the role and coping mechanism of 4 ps beneficiaries in northern ...
Variation in the role and coping mechanism of 4 ps beneficiaries in northern ...Variation in the role and coping mechanism of 4 ps beneficiaries in northern ...
Variation in the role and coping mechanism of 4 ps beneficiaries in northern ...
 
Spider Internship Fund Summer Fellowship LSanti
Spider Internship Fund Summer Fellowship LSanti Spider Internship Fund Summer Fellowship LSanti
Spider Internship Fund Summer Fellowship LSanti
 
Gender Equality and Pro-Poor Growth - Women’s Economic Empowerment
Gender Equality and Pro-Poor Growth - Women’s Economic Empowerment Gender Equality and Pro-Poor Growth - Women’s Economic Empowerment
Gender Equality and Pro-Poor Growth - Women’s Economic Empowerment
 
Determinants of Off-farm Employment Participation of Women in Rural Uganda
Determinants of Off-farm Employment Participation of Women in Rural UgandaDeterminants of Off-farm Employment Participation of Women in Rural Uganda
Determinants of Off-farm Employment Participation of Women in Rural Uganda
 
Performance of women in small scale enterprises (ss es) marital status and fa...
Performance of women in small scale enterprises (ss es) marital status and fa...Performance of women in small scale enterprises (ss es) marital status and fa...
Performance of women in small scale enterprises (ss es) marital status and fa...
 
`For the Love of the Republic' Education, Secularism, and Empowerment
`For the Love of the Republic' Education, Secularism, and Empowerment`For the Love of the Republic' Education, Secularism, and Empowerment
`For the Love of the Republic' Education, Secularism, and Empowerment
 
Women in the labour force 23 9-2004
Women in the labour force 23 9-2004Women in the labour force 23 9-2004
Women in the labour force 23 9-2004
 
Building a Notion of Equality: Thoughts on Women, Work and Welfare
 Building a Notion of Equality: Thoughts on Women, Work and Welfare Building a Notion of Equality: Thoughts on Women, Work and Welfare
Building a Notion of Equality: Thoughts on Women, Work and Welfare
 
Session 2 d cigdem gedikli
Session 2 d cigdem gedikliSession 2 d cigdem gedikli
Session 2 d cigdem gedikli
 
From targets of charity to citizens? Emerging lessons on gender-responsive so...
From targets of charity to citizens? Emerging lessons on gender-responsive so...From targets of charity to citizens? Emerging lessons on gender-responsive so...
From targets of charity to citizens? Emerging lessons on gender-responsive so...
 
11.examining gender difference in socio economic development
11.examining gender difference in socio economic development11.examining gender difference in socio economic development
11.examining gender difference in socio economic development
 

Similar to determinants of Intrahousehold income inequality

Demographic analysis of poverty
Demographic analysis of povertyDemographic analysis of poverty
Demographic analysis of povertyAlexander Decker
 
Characteristics of poverty in pakistan
Characteristics of poverty in pakistanCharacteristics of poverty in pakistan
Characteristics of poverty in pakistanAlexander Decker
 
Impact of housing environment on poverty
Impact of housing environment on povertyImpact of housing environment on poverty
Impact of housing environment on povertyAlexander Decker
 
Rural urban poverty nexus impact of housing environment
Rural urban poverty nexus impact of housing environmentRural urban poverty nexus impact of housing environment
Rural urban poverty nexus impact of housing environmentAlexander Decker
 
Rural-Urban Household Saving Behavior: A Case Study of District Chitral, Paki...
Rural-Urban Household Saving Behavior: A Case Study of District Chitral, Paki...Rural-Urban Household Saving Behavior: A Case Study of District Chitral, Paki...
Rural-Urban Household Saving Behavior: A Case Study of District Chitral, Paki...Conferenceproceedings
 
Running head income distribution
Running head income distribution                               Running head income distribution
Running head income distribution SHIVA101531
 
A STUDY ON THE SOCIO-ECONOMIC STATUS OF AGRICULTURAL FARMERS
A STUDY ON THE SOCIO-ECONOMIC STATUS OF AGRICULTURAL FARMERSA STUDY ON THE SOCIO-ECONOMIC STATUS OF AGRICULTURAL FARMERS
A STUDY ON THE SOCIO-ECONOMIC STATUS OF AGRICULTURAL FARMERSClaudia Acosta
 
Running head INCOME INEQUALITY1INCOME INEQUALITY6A.docx
Running head INCOME INEQUALITY1INCOME INEQUALITY6A.docxRunning head INCOME INEQUALITY1INCOME INEQUALITY6A.docx
Running head INCOME INEQUALITY1INCOME INEQUALITY6A.docxcowinhelen
 
Rural-Urban Household Saving Behavior: A Case Study of District Chitral, Paki...
Rural-Urban Household Saving Behavior: A Case Study of District Chitral, Paki...Rural-Urban Household Saving Behavior: A Case Study of District Chitral, Paki...
Rural-Urban Household Saving Behavior: A Case Study of District Chitral, Paki...Conferenceproceedings
 
Urbanization and Fertility Rates in Ethiopia
Urbanization and Fertility Rates in EthiopiaUrbanization and Fertility Rates in Ethiopia
Urbanization and Fertility Rates in Ethiopiaessp2
 
Education and Earnings Inequality in Cameroon
Education and Earnings Inequality in CameroonEducation and Earnings Inequality in Cameroon
Education and Earnings Inequality in CameroonAJHSSR Journal
 
Canadian Journal of Economics Revue canadienne d’économique.docx
Canadian Journal of Economics  Revue canadienne d’économique.docxCanadian Journal of Economics  Revue canadienne d’économique.docx
Canadian Journal of Economics Revue canadienne d’économique.docxdewhirstichabod
 
WEBINAR: Aspirations, trust, and poverty reduction
WEBINAR: Aspirations, trust, and poverty reductionWEBINAR: Aspirations, trust, and poverty reduction
WEBINAR: Aspirations, trust, and poverty reductionIFPRI-PIM
 
Housing: Opportunity, Security, and Empowerment for the Poor
Housing: Opportunity, Security, and Empowerment for the PoorHousing: Opportunity, Security, and Empowerment for the Poor
Housing: Opportunity, Security, and Empowerment for the Pooridspak
 
Transforming gender relations through the market: The impact of smallholder d...
Transforming gender relations through the market: The impact of smallholder d...Transforming gender relations through the market: The impact of smallholder d...
Transforming gender relations through the market: The impact of smallholder d...ILRI
 
Download part two families on the front line report
Download part two families on the front line reportDownload part two families on the front line report
Download part two families on the front line reportFamily and Childcare Trust
 

Similar to determinants of Intrahousehold income inequality (20)

Demographic analysis of poverty
Demographic analysis of povertyDemographic analysis of poverty
Demographic analysis of poverty
 
Characteristics of poverty in pakistan
Characteristics of poverty in pakistanCharacteristics of poverty in pakistan
Characteristics of poverty in pakistan
 
Impact of housing environment on poverty
Impact of housing environment on povertyImpact of housing environment on poverty
Impact of housing environment on poverty
 
Rural urban poverty nexus impact of housing environment
Rural urban poverty nexus impact of housing environmentRural urban poverty nexus impact of housing environment
Rural urban poverty nexus impact of housing environment
 
Rural-Urban Household Saving Behavior: A Case Study of District Chitral, Paki...
Rural-Urban Household Saving Behavior: A Case Study of District Chitral, Paki...Rural-Urban Household Saving Behavior: A Case Study of District Chitral, Paki...
Rural-Urban Household Saving Behavior: A Case Study of District Chitral, Paki...
 
Running head income distribution
Running head income distribution                               Running head income distribution
Running head income distribution
 
A STUDY ON THE SOCIO-ECONOMIC STATUS OF AGRICULTURAL FARMERS
A STUDY ON THE SOCIO-ECONOMIC STATUS OF AGRICULTURAL FARMERSA STUDY ON THE SOCIO-ECONOMIC STATUS OF AGRICULTURAL FARMERS
A STUDY ON THE SOCIO-ECONOMIC STATUS OF AGRICULTURAL FARMERS
 
Running head INCOME INEQUALITY1INCOME INEQUALITY6A.docx
Running head INCOME INEQUALITY1INCOME INEQUALITY6A.docxRunning head INCOME INEQUALITY1INCOME INEQUALITY6A.docx
Running head INCOME INEQUALITY1INCOME INEQUALITY6A.docx
 
Rural-Urban Household Saving Behavior: A Case Study of District Chitral, Paki...
Rural-Urban Household Saving Behavior: A Case Study of District Chitral, Paki...Rural-Urban Household Saving Behavior: A Case Study of District Chitral, Paki...
Rural-Urban Household Saving Behavior: A Case Study of District Chitral, Paki...
 
Urbanization and Fertility Rates in Ethiopia
Urbanization and Fertility Rates in EthiopiaUrbanization and Fertility Rates in Ethiopia
Urbanization and Fertility Rates in Ethiopia
 
Education and Earnings Inequality in Cameroon
Education and Earnings Inequality in CameroonEducation and Earnings Inequality in Cameroon
Education and Earnings Inequality in Cameroon
 
Canadian Journal of Economics Revue canadienne d’économique.docx
Canadian Journal of Economics  Revue canadienne d’économique.docxCanadian Journal of Economics  Revue canadienne d’économique.docx
Canadian Journal of Economics Revue canadienne d’économique.docx
 
WEBINAR: Aspirations, trust, and poverty reduction
WEBINAR: Aspirations, trust, and poverty reductionWEBINAR: Aspirations, trust, and poverty reduction
WEBINAR: Aspirations, trust, and poverty reduction
 
Structural Determinants of Poverty in Pakistan
Structural Determinants of Poverty in PakistanStructural Determinants of Poverty in Pakistan
Structural Determinants of Poverty in Pakistan
 
Housing: Opportunity, Security, and Empowerment for the Poor
Housing: Opportunity, Security, and Empowerment for the PoorHousing: Opportunity, Security, and Empowerment for the Poor
Housing: Opportunity, Security, and Empowerment for the Poor
 
Taxing Families: The Impact of Child-related Transfers on Maternal Labor Supply
Taxing Families: The Impact of Child-related Transfers on Maternal Labor SupplyTaxing Families: The Impact of Child-related Transfers on Maternal Labor Supply
Taxing Families: The Impact of Child-related Transfers on Maternal Labor Supply
 
Income Differentials and Returns to Education in India
Income Differentials and Returns to Education in IndiaIncome Differentials and Returns to Education in India
Income Differentials and Returns to Education in India
 
Transforming gender relations through the market: The impact of smallholder d...
Transforming gender relations through the market: The impact of smallholder d...Transforming gender relations through the market: The impact of smallholder d...
Transforming gender relations through the market: The impact of smallholder d...
 
Download part two families on the front line report
Download part two families on the front line reportDownload part two families on the front line report
Download part two families on the front line report
 
Families on the front line report: Part Two
Families on the front line report: Part TwoFamilies on the front line report: Part Two
Families on the front line report: Part Two
 

Recently uploaded

HỌC TỐT TIẾNG ANH 11 THEO CHƯƠNG TRÌNH GLOBAL SUCCESS ĐÁP ÁN CHI TIẾT - CẢ NĂ...
HỌC TỐT TIẾNG ANH 11 THEO CHƯƠNG TRÌNH GLOBAL SUCCESS ĐÁP ÁN CHI TIẾT - CẢ NĂ...HỌC TỐT TIẾNG ANH 11 THEO CHƯƠNG TRÌNH GLOBAL SUCCESS ĐÁP ÁN CHI TIẾT - CẢ NĂ...
HỌC TỐT TIẾNG ANH 11 THEO CHƯƠNG TRÌNH GLOBAL SUCCESS ĐÁP ÁN CHI TIẾT - CẢ NĂ...Nguyen Thanh Tu Collection
 
Transaction Management in Database Management System
Transaction Management in Database Management SystemTransaction Management in Database Management System
Transaction Management in Database Management SystemChristalin Nelson
 
ANG SEKTOR NG agrikultura.pptx QUARTER 4
ANG SEKTOR NG agrikultura.pptx QUARTER 4ANG SEKTOR NG agrikultura.pptx QUARTER 4
ANG SEKTOR NG agrikultura.pptx QUARTER 4MiaBumagat1
 
GRADE 4 - SUMMATIVE TEST QUARTER 4 ALL SUBJECTS
GRADE 4 - SUMMATIVE TEST QUARTER 4 ALL SUBJECTSGRADE 4 - SUMMATIVE TEST QUARTER 4 ALL SUBJECTS
GRADE 4 - SUMMATIVE TEST QUARTER 4 ALL SUBJECTSJoshuaGantuangco2
 
Global Lehigh Strategic Initiatives (without descriptions)
Global Lehigh Strategic Initiatives (without descriptions)Global Lehigh Strategic Initiatives (without descriptions)
Global Lehigh Strategic Initiatives (without descriptions)cama23
 
ENGLISH6-Q4-W3.pptxqurter our high choom
ENGLISH6-Q4-W3.pptxqurter our high choomENGLISH6-Q4-W3.pptxqurter our high choom
ENGLISH6-Q4-W3.pptxqurter our high choomnelietumpap1
 
4.16.24 21st Century Movements for Black Lives.pptx
4.16.24 21st Century Movements for Black Lives.pptx4.16.24 21st Century Movements for Black Lives.pptx
4.16.24 21st Century Movements for Black Lives.pptxmary850239
 
Proudly South Africa powerpoint Thorisha.pptx
Proudly South Africa powerpoint Thorisha.pptxProudly South Africa powerpoint Thorisha.pptx
Proudly South Africa powerpoint Thorisha.pptxthorishapillay1
 
Virtual-Orientation-on-the-Administration-of-NATG12-NATG6-and-ELLNA.pdf
Virtual-Orientation-on-the-Administration-of-NATG12-NATG6-and-ELLNA.pdfVirtual-Orientation-on-the-Administration-of-NATG12-NATG6-and-ELLNA.pdf
Virtual-Orientation-on-the-Administration-of-NATG12-NATG6-and-ELLNA.pdfErwinPantujan2
 
Barangay Council for the Protection of Children (BCPC) Orientation.pptx
Barangay Council for the Protection of Children (BCPC) Orientation.pptxBarangay Council for the Protection of Children (BCPC) Orientation.pptx
Barangay Council for the Protection of Children (BCPC) Orientation.pptxCarlos105
 
USPS® Forced Meter Migration - How to Know if Your Postage Meter Will Soon be...
USPS® Forced Meter Migration - How to Know if Your Postage Meter Will Soon be...USPS® Forced Meter Migration - How to Know if Your Postage Meter Will Soon be...
USPS® Forced Meter Migration - How to Know if Your Postage Meter Will Soon be...Postal Advocate Inc.
 
INTRODUCTION TO CATHOLIC CHRISTOLOGY.pptx
INTRODUCTION TO CATHOLIC CHRISTOLOGY.pptxINTRODUCTION TO CATHOLIC CHRISTOLOGY.pptx
INTRODUCTION TO CATHOLIC CHRISTOLOGY.pptxHumphrey A Beña
 
Karra SKD Conference Presentation Revised.pptx
Karra SKD Conference Presentation Revised.pptxKarra SKD Conference Presentation Revised.pptx
Karra SKD Conference Presentation Revised.pptxAshokKarra1
 
Like-prefer-love -hate+verb+ing & silent letters & citizenship text.pdf
Like-prefer-love -hate+verb+ing & silent letters & citizenship text.pdfLike-prefer-love -hate+verb+ing & silent letters & citizenship text.pdf
Like-prefer-love -hate+verb+ing & silent letters & citizenship text.pdfMr Bounab Samir
 
MULTIDISCIPLINRY NATURE OF THE ENVIRONMENTAL STUDIES.pptx
MULTIDISCIPLINRY NATURE OF THE ENVIRONMENTAL STUDIES.pptxMULTIDISCIPLINRY NATURE OF THE ENVIRONMENTAL STUDIES.pptx
MULTIDISCIPLINRY NATURE OF THE ENVIRONMENTAL STUDIES.pptxAnupkumar Sharma
 
Science 7 Quarter 4 Module 2: Natural Resources.pptx
Science 7 Quarter 4 Module 2: Natural Resources.pptxScience 7 Quarter 4 Module 2: Natural Resources.pptx
Science 7 Quarter 4 Module 2: Natural Resources.pptxMaryGraceBautista27
 
Keynote by Prof. Wurzer at Nordex about IP-design
Keynote by Prof. Wurzer at Nordex about IP-designKeynote by Prof. Wurzer at Nordex about IP-design
Keynote by Prof. Wurzer at Nordex about IP-designMIPLM
 

Recently uploaded (20)

HỌC TỐT TIẾNG ANH 11 THEO CHƯƠNG TRÌNH GLOBAL SUCCESS ĐÁP ÁN CHI TIẾT - CẢ NĂ...
HỌC TỐT TIẾNG ANH 11 THEO CHƯƠNG TRÌNH GLOBAL SUCCESS ĐÁP ÁN CHI TIẾT - CẢ NĂ...HỌC TỐT TIẾNG ANH 11 THEO CHƯƠNG TRÌNH GLOBAL SUCCESS ĐÁP ÁN CHI TIẾT - CẢ NĂ...
HỌC TỐT TIẾNG ANH 11 THEO CHƯƠNG TRÌNH GLOBAL SUCCESS ĐÁP ÁN CHI TIẾT - CẢ NĂ...
 
Transaction Management in Database Management System
Transaction Management in Database Management SystemTransaction Management in Database Management System
Transaction Management in Database Management System
 
ANG SEKTOR NG agrikultura.pptx QUARTER 4
ANG SEKTOR NG agrikultura.pptx QUARTER 4ANG SEKTOR NG agrikultura.pptx QUARTER 4
ANG SEKTOR NG agrikultura.pptx QUARTER 4
 
GRADE 4 - SUMMATIVE TEST QUARTER 4 ALL SUBJECTS
GRADE 4 - SUMMATIVE TEST QUARTER 4 ALL SUBJECTSGRADE 4 - SUMMATIVE TEST QUARTER 4 ALL SUBJECTS
GRADE 4 - SUMMATIVE TEST QUARTER 4 ALL SUBJECTS
 
Global Lehigh Strategic Initiatives (without descriptions)
Global Lehigh Strategic Initiatives (without descriptions)Global Lehigh Strategic Initiatives (without descriptions)
Global Lehigh Strategic Initiatives (without descriptions)
 
ENGLISH6-Q4-W3.pptxqurter our high choom
ENGLISH6-Q4-W3.pptxqurter our high choomENGLISH6-Q4-W3.pptxqurter our high choom
ENGLISH6-Q4-W3.pptxqurter our high choom
 
4.16.24 21st Century Movements for Black Lives.pptx
4.16.24 21st Century Movements for Black Lives.pptx4.16.24 21st Century Movements for Black Lives.pptx
4.16.24 21st Century Movements for Black Lives.pptx
 
Proudly South Africa powerpoint Thorisha.pptx
Proudly South Africa powerpoint Thorisha.pptxProudly South Africa powerpoint Thorisha.pptx
Proudly South Africa powerpoint Thorisha.pptx
 
FINALS_OF_LEFT_ON_C'N_EL_DORADO_2024.pptx
FINALS_OF_LEFT_ON_C'N_EL_DORADO_2024.pptxFINALS_OF_LEFT_ON_C'N_EL_DORADO_2024.pptx
FINALS_OF_LEFT_ON_C'N_EL_DORADO_2024.pptx
 
Virtual-Orientation-on-the-Administration-of-NATG12-NATG6-and-ELLNA.pdf
Virtual-Orientation-on-the-Administration-of-NATG12-NATG6-and-ELLNA.pdfVirtual-Orientation-on-the-Administration-of-NATG12-NATG6-and-ELLNA.pdf
Virtual-Orientation-on-the-Administration-of-NATG12-NATG6-and-ELLNA.pdf
 
Barangay Council for the Protection of Children (BCPC) Orientation.pptx
Barangay Council for the Protection of Children (BCPC) Orientation.pptxBarangay Council for the Protection of Children (BCPC) Orientation.pptx
Barangay Council for the Protection of Children (BCPC) Orientation.pptx
 
USPS® Forced Meter Migration - How to Know if Your Postage Meter Will Soon be...
USPS® Forced Meter Migration - How to Know if Your Postage Meter Will Soon be...USPS® Forced Meter Migration - How to Know if Your Postage Meter Will Soon be...
USPS® Forced Meter Migration - How to Know if Your Postage Meter Will Soon be...
 
INTRODUCTION TO CATHOLIC CHRISTOLOGY.pptx
INTRODUCTION TO CATHOLIC CHRISTOLOGY.pptxINTRODUCTION TO CATHOLIC CHRISTOLOGY.pptx
INTRODUCTION TO CATHOLIC CHRISTOLOGY.pptx
 
Karra SKD Conference Presentation Revised.pptx
Karra SKD Conference Presentation Revised.pptxKarra SKD Conference Presentation Revised.pptx
Karra SKD Conference Presentation Revised.pptx
 
Like-prefer-love -hate+verb+ing & silent letters & citizenship text.pdf
Like-prefer-love -hate+verb+ing & silent letters & citizenship text.pdfLike-prefer-love -hate+verb+ing & silent letters & citizenship text.pdf
Like-prefer-love -hate+verb+ing & silent letters & citizenship text.pdf
 
MULTIDISCIPLINRY NATURE OF THE ENVIRONMENTAL STUDIES.pptx
MULTIDISCIPLINRY NATURE OF THE ENVIRONMENTAL STUDIES.pptxMULTIDISCIPLINRY NATURE OF THE ENVIRONMENTAL STUDIES.pptx
MULTIDISCIPLINRY NATURE OF THE ENVIRONMENTAL STUDIES.pptx
 
Science 7 Quarter 4 Module 2: Natural Resources.pptx
Science 7 Quarter 4 Module 2: Natural Resources.pptxScience 7 Quarter 4 Module 2: Natural Resources.pptx
Science 7 Quarter 4 Module 2: Natural Resources.pptx
 
LEFT_ON_C'N_ PRELIMS_EL_DORADO_2024.pptx
LEFT_ON_C'N_ PRELIMS_EL_DORADO_2024.pptxLEFT_ON_C'N_ PRELIMS_EL_DORADO_2024.pptx
LEFT_ON_C'N_ PRELIMS_EL_DORADO_2024.pptx
 
Keynote by Prof. Wurzer at Nordex about IP-design
Keynote by Prof. Wurzer at Nordex about IP-designKeynote by Prof. Wurzer at Nordex about IP-design
Keynote by Prof. Wurzer at Nordex about IP-design
 
YOUVE_GOT_EMAIL_PRELIMS_EL_DORADO_2024.pptx
YOUVE_GOT_EMAIL_PRELIMS_EL_DORADO_2024.pptxYOUVE_GOT_EMAIL_PRELIMS_EL_DORADO_2024.pptx
YOUVE_GOT_EMAIL_PRELIMS_EL_DORADO_2024.pptx
 

determinants of Intrahousehold income inequality

  • 1. Journal of Economic Impact, 1 (1) 12-18, 2019 12 Available Online Journal of Economic Impact http://www.scienceimpactpub.com/jei DETERMINANTS OF INTRA-HOUSEHOLD INCOME INEQUALITY: A CASE STUDY FROM RURAL PAKISTAN Sania Malik a, *, Muhammad Abdullah b , Iqbal Javed a a Department of Economics, University of Lahore, Sargodha Campus, Sargodha, Pakistan b Department of Management Sciences, Khwaja Fareed University of Engineering & Information Technology, Rahim Yar Khan, Pakistan HIGHLIGHTS  Inequality has emerged at macro level but by finding the solutions of the problem our debates come to the micro level. By exploring the root causes of income inequality at micro level we cannot ignore the role of a household head for effective planning for their children.  The household members less than the selected age are considered under training to make them responsible person for contribution in total household income.  This approach to family welfare analysis is a new dimension may become controversial as the hypothesized explanatory variables mostly belongs to household head who has decision making powers, as the determinants of intra-household inequality.  The significance of most of the variables shows some reality that household head in some way become the reason of intra-household inequality.  The positive relationship between number of females and within family inequality is a call for sound policies to reduce gender gap and get women into mainstream economy.  The fall in occupations such as farming and livestock sector and other elementary occupations are also becoming the reason of intra- household inequality which needs policy maker’s attention. ABSTRACT Inequality has emerged at macro level but by finding the solutions of the problem our debate comes to the micro level. By exploring the root causes of income inequality at micro level we cannot ignore the role of a household head for effective planning for their children. The purpose of this study is to estimate the income inequality of households and to find the impact of the most relevant factors on the income inequality at a household level. The data about 400 household including 2266 individuals is extracted from the Household Integrated Economic Survey (HIES) which is conducted in 2015-16 under special survey namely Household Integrated Income and Consumption Survey. This approach to family welfare analysis is a new dimension may become controversial as the hypothesized explanatory variables mostly belongs to household head who has decision making powers, as the determinants of intra-household inequality. The significance of most of the variables shows some reality that household head in some way become the reason of intra-household inequality. Though some results are not according to expectations such as negative relationship of intra-household inequality and household size but this is trending result as a positive sign towards more sharing and cooperation within a family. The positive relationship between number of females and within family inequality is a call for sound policies to reduce gender gap and get women into mainstream economy. The fall in occupations such as farming and livestock sector and other elementary occupations are also becoming the reason of intra-household inequality which needs policy maker’s attention. Keywords: Intra-household income inequality; rural inequality; family occupations * Correspondence: Department of Management Sciences, Khwaja Fareed University of Engineering & Information Technology, Rahim Yar Khan, Pakistan; Email: dr.abdullah@kfueit.edu.pk Introduction By the end of 20th century, the research on intra- household inequality begun when attention shifted from inequality at macro level to inequality at micro level intra- household inequality. Before that it was thought as private matter of households and impossible to measure. Then it first started by taking mean of household data to find intra- household inequality (Haddad & Kanbur, 1990). Afterwards the intra-household inequality calculated by taking expenditure data on food and clothing of individuals in the household (Browning et al., 1994; Browning & Chiappori, 1998). The research with labor supply data also conducted by many (Apps & Rees, 1996) to reveal the within household inequality in wage rate, working and leisure time. But intra-household inequality has many other dimensions such as decision making and control on household resources by household head. Intra-household inequality is important in measurement of inequality and poverty. It is inevitable to investigate intra-household inequality for sound economic policy which will lead to the wellbeing of individuals. In existing literature mostly individual welfare is computed by taking average welfare of households. Some have created link between average household inequality and intra-household inequality (Haddad & Kanbur, 1992). The inequality in incomes or
  • 2. Malik et al. / Journal of Economic Impact, 1(1), 12-18 (2019) 13 Determinants of Intra-Household Income Inequality expenditure of individuals of household exists but aggregate data of household conceals deprivation within the household which leads to underestimation of inequality and poverty in society (Lise & Seitz, 2011) and this leads to wrong welfare policies and wrong estimates of income for taxation in any country. Intra-household inequalities present in both developed (Apps & Savage 1989; Browning & Chiappori, 1998) & developing nations (Haddad & Kanbur 1990; Kumar and Mahadevan, 2011) but more in poor countries. These studies had shown that intra-household inequality is high in underdeveloped nation. Moreover, in resource- constrained households with joint family system where altruism is weak and selfishness exist, the probability of distribution asymmetries remain high that give rise to poor individuals within well settled household. It has strong implications in developing countries where resource- constrained households and family system are more prevalent than in developed nations. In such developing societies, it is possible that in some cases extreme poverty is hidden. Thus intra-household inequality estimation is crucial. Though, it is not easy to target individuals within household and in some cases may be impossible. But intra- household inequality is helpful for policymakers to make sound policy. Existing studies on intra-household inequality ignored the influence of decision makers (household head) on household income distribution. The purpose of this research is twofold. First, intra-household inequality at income levels of individuals in the household in both rural and urban society. Second, determinants that affect within household inequality particularly impact of household head characteristics and decision making on intra- household inequality. Role of decision maker in intra-household inequality The concept of within household inequality was first developed by Sen (1984). In growing literature, it has been examined that whether resources are equally distributed within household (Thomas 1990; Phipps & Burton 1995; Lise & Seitz, 2011; Kumar & Mahadevan, 2011). These studies have recognized that rise in average welfare of individuals within a household is not necessarily attached by a decline in intra-household inequality in welfare. Thus, by neglecting this dimension, there is lack of policy intervention that target intra-household inequality. Most of the existing literature has considered unitary household decision making and has used collective models by considering single utility function of household (Bourguignon & Chiappori, 1992; Browning & Chiappori, 1998). Other non-unitary models are based on bargaining rule in decision making of household members related to allocation of resources, i.e. consumption and labor supply decisions. These are based on cooperative decision making (Manser & Brown, 1980; McElroy & Horney, 1981; Lundberg & Pollak, 1994) and non-cooperative decision making (Chen & Woolley, 2001; Konrad & Lommerud, 2000; Lundberg et al., 1997; Udry, 1996). Another phenomenon is also present as first income goes in control of household head and then it is redistributed by his decision as described by Becker (1974, 1981) in his ‘Rotten Kid Theorem’ using unified household model.1 So, the decision of household head affects intra-household inequality among other economic and cultural factors. The reason is social values bondage that the main economic provider control family decision making. Household head control in the family is twofold; control on management of family finances and influence on family decision making. This study which is conducted in Pakistan will explore a new dimension in which household Gini is taken on left- hand side of equation and determinants that affect intra- household inequality on right-hand side. Methodology The data used in the study is micro data of Household Income and Expenditure Survey collected by Pakistan Bureau of Statistics in 2015-16. During the current study under hand, total 400 households with 2266 individuals from Punjab are included, among them 200 are rural residents and 200 are urban residents. They are linked mainly to occupations such as administrative services, professional services, teaching, manufacturing and retail sale business, construction and real estate, elementary occupations, farming and livestock. In rural areas, mostly people are less educated and low skilled engaged in farming and livestock, and some are migrated to cities, for working in industries of garments and construction and others are engaged in elementary occupations. Intra-household inequality To find intra-household inequality we have used annual income data of individual’s in a household by including individuals above 25 years of age. Like previous studies we have used the method of Gini coefficient to find intra-household inequality (Haddad & Kanbur, 1992; Thomas, 1990). 1 Becker’s "Rotten Kid Theorem" (1974, 1981), this theorem suggests that altruistic parents and their children maximize the same utility function, even if the kids are selfish. If an altruistic parent provides a transfer to his The formula of Gini coefficient: Gini-coefficient = Area between Lorenz Curve and Diagonal / Total Area under Diagonal When G is based on the Lorenz curve of income distribution, it can be interpreted as the expected income children, then the children have incentives to behave in such a manner that household income is maximized.
  • 3. Malik et al. / Journal of Economic Impact, 1(1), 12-18 (2019) 14 gap between two individuals randomly selected from the population (Sen, 1973) The classical definition of G appears in the notation of the theory of relative mean difference: Where x is an observed value, n is the number of values observed and x bar is the mean value. If the x values are first placed in ascending order, such that each x has rank i, the some of the comparisons above can be avoided and computation is quicker: Where x is an observed value, n is the number of values observed and i is the rank of values in ascending order. G is a measure of inequality, defined as the mean of absolute differences between all pairs of individuals for some measure. The minimum value is 0 when all measurements are equal and the theoretical maximum is 1 for an infinitely large set of observations where all measurements but one has a value of 0, which is the ultimate inequality (Stuart & Ord, 1994). The simple linear regression model is used to check the impact of different variables on intra-household inequality. All the variables in the model are shown in table 1 by following the equation as; The linear regression model is as: Gi = βo+ β1AGE + β2REG + β3HHSIZ + β4NFEM + β5EDU + β6OCC1 + β7OCC2 + β8OCC3 + β9OCC4 + β10OCC6 + β11OCC7 + β12JSTAT + µ Table 1: Description of variables Variables Description GINI (G) Gini coefficient of every household in the data AGE Age of household head REG Urban = 1; 0 = rural HHSIZ Number of individuals in a household NFEM Number of females in a household EDU Education of household head Occupation OCC1 OCC2 OCC3 OCC4 OCC5 OCC6 OCC7 Dummy variable if professional, technician, then1; 0 otherwise Dummy variable if clerk then 1; 0 otherwise Dummy variable if teacher then 1; 0 otherwise Dummy variable if farming and livestock then 1; 0 otherwise Base category Dummy variable if construction and real estate then 1; 0 otherwise Dummy variable if elementary occupation then 1; 0 otherwise JSTAT If paid employee then 1; 0 if self employed Results and Discussion All the variables in the model have different expected results. Some variables’ results are not according to expectations but this is due to trending dimensions. For example it was expected that by increase in household size, intra-household inequality will also increase but in our study results are different.
  • 4. Malik et al. / Journal of Economic Impact, 1(1), 12-18 (2019) 15 Determinants of Intra-Household Income Inequality Table 2: Sample Statistics Variables Mean Std. Deviation Gini coefficient of individuals in a household .449 .1560 Age of household head 49.20 12.942 Urban or rural .500 .500 Household size 5.66 2.105 No of females in a household 2.90 1.436 Schooling years of household head education 7.33 4.072 Data Source: PBS data 2015-16 Mean values of all variables in table 2, where average Gini coefficient is 0.45 means almost 45% inequality is present between households. Average age of household head is 49 years. The average number of members in a family is 6 and average number of females in a household is 3. The average number of schooling years of household head is 7. Table 3: Statistics related to occupation and job status Variables Frequency Percentage Professionals 23 5.8 Clerks 66 16.5 Teachers 13 3.3 Farming and livestock 74 18.5 Manufacturing and retail sale 115 28.3 Construction and real estate 46 11.5 Elementary occupations 63 15.8 Paid employee 228 57 Data Source: PBS data 2015-16 The frequency and percentage of different occupations is shown in table 3 where manufacturing and retail sale business has highest frequency among all other occupations as 28.3% of total households while teachers are only 3.3% of total. Farming and livestock has the second highest frequency as 18.5% people linked with this occupation. Table 4: Gini coefficient Income inequality within a household (0 means perfect equality and 100 means perfect inequality) Lowest Gini index 0.15 Highest Gini index 0.70 Average Gini index 0.45 Source: Calculated by using HIES micro data The Gini coefficient is shown in table 4, which show the lowest and highest Gini coefficients among all calculated Gini coefficient of every household separately. Among them lowest Gini coefficient is 0.15 and highest Gini coefficient is 0.70. Average Gini coefficient value which is 0.45 shows total inequality between households which is useful for policy makers for making the policies for the welfare of households.
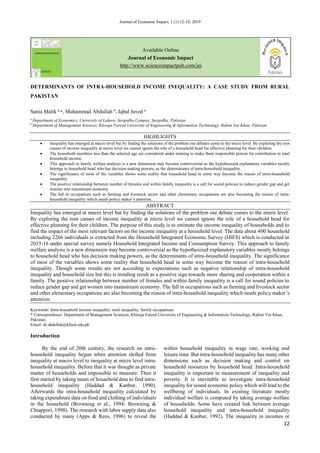
  • 5. Malik et al. / Journal of Economic Impact, 1(1), 12-18 (2019) 16 Figure 1: Lorenz curves for lower and upper range of income inequality within households Equality and inequality lines as 450 line shows the perfect equality when Gini coefficient is 0 and Lorenz curve 1 (dotted line) shows 15% inequality within a household while Lorenz curve 2 (dashed line) shows a high level of inequality within a family (say, 70%) as shown in figure 1. These estimates clearly revealing that by taking household as a single entity the estimates of inequality in a society become wrong which further leads towards misperceived policies to increase welfare in the society. All the above described variables are assumed determinants that cause intra-household inequality when household head has a control over household resources; finances and assets and decision making related to all members of a family. In this case household head characteristics and family background are the main factors that affect intra-household inequality. This is mostly the case of under developed countries where people are still living in large units and joint family system which is in the control of a single person. Moreover, mostly this household head remains a main economic provider for a single large family unit. There is no multicollinearity between different variables as shown in table 5. For model estimation, from dummy variable occupation one category is considered as base category such as OCC5 (manufacturing and retail sale) which is common category in rural and urban residents, for avoiding dummy variable trap (perfect multicollinearity). Table 5: Estimation of multicollinearity Variables Tolerance VIF AGE .934 1.070 REG .724 1.381 HHSIZ .418 2.395 NFEM .431 2.321 EDU .865 1.157 OCC1 .832 1.202 OCC2 .585 1.710 OCC3 .826 1.211 OCC4 .535 1.868 OCC6 .652 1.535 OCC7 .693 1.444 JSTAT .588 1.702 Source: Author’s calculations Model summary is discussed where R square is 0.2 which is low but in line with other studies who find out determinants of intra-household inequality by taking individual expenditure data (Haddad & Kanbur, 1992; Kumar and Mahadevan, 2011). The reason of low coefficient of determination is that intra-household inequality is not only affected by the determinants assumed in this study but also by some other economic and cultural factors. Overall the model is best because F- test is showing significance value as shown in table 6. Separate effect of each determinant on intra- household inequality is estimated. Among these household -20 0 20 40 60 80 100 0 20 40 60 80 100 equality lorenz 1 lorenz 2
  • 6. Malik et al. / Journal of Economic Impact, 1(1), 12-18 (2019) 17 Determinants of Intra-Household Income Inequality head age has significant negative relationship with intra- household inequality. The region has negative and insignificant relationship with inequality. As existing literature on intra-household inequality shows that within household inequality exists in both developed and developing nations but high in poor nations. Same in the region’s case where more developed region (urban) has less intra-household inequality as compare to rural areas where mostly women are not allowed to work due to social taboos. Household size has significant but negative relationship with intra-household inequality. These results are opposite to our expectations but it is possible as number of a family members increases, the number of income earners in family will also increase. Table 6: Determinants of intra-household income inequality Variables B Std. Error t Sig. (Constant) .529 .039 13.456 .000 AGE -.001 .001 -2.287 .023*** REG -.002 .017 -.112 .911 HHSIZ -.011 .005 -2.109 .036** NFEM .021 .007 2.804 .005*** EDU .002 .002 .958 .339 OCC1 -.093 .033 -2.813 .005*** OCC2 -.056 .025 -2.261 .024** OCC3 -.147 .044 -3.375 .001*** OCC4 .056 .025 2.250 .025** OCC6 -.056 .027 -2.065 .040** OCC7 .063 .023 2.702 .007*** JSTAT -.039 .019 -2.099 .036** R 0.462 R Square 0.214 Adjusted R Square 0.189 F- test 8.759 Probability 0.000 Dependent Variable: Gini coefficient of individuals in a household; ** and *** significance at 5% level and 1% level respectively The number of females in a household has positive and significant relationship with inequality. This situation is mostly seen in developing nations where women are less educated and skilled, engaged in household chores. So, they are considered economic burden on household head of a family. Education of household has also positive and insignificant relationship with inequality. Professional workers, clerks, teachers and construction business have significant and negative relationship with intra-household inequality. In Pakistan, these are considered high income earning sectors in which people mostly work as paid employee. Farming, livestock and other elementary occupation have positive and significant effect on intra- household inequality. Farming and livestock sector is neglected sector in Pakistan due to which the families based on agricultural sector face resource-constraints within household. Elementary occupations are less paid works and the household head engaged in these occupations are unable to support their family finances efficiently. In case of job status, as paid employee will increase intra-household inequality will decrease as opposite to self-employment. Conclusion This approach to family welfare analysis is a new dimension may become controversial as the hypothesized explanatory variables mostly belongs to household head who has decision making powers, as the determinants of intra-household inequality. But the significance of most of the variables shows some reality that household head in some way become the reason of intra-household inequality. Though some results are not according to expectations such as negative relationship of intra-household inequality and household size but this is trending result as a positive sign towards more sharing and cooperation within a family. The positive relationship between number of females and within family inequality is a call for sound policies to reduce gender gap and get women into mainstream economy. The fall in occupations such as farming and livestock sector and other elementary occupations are also becoming the reason of intra-household inequality which needs policy maker’s attention. There is need to be tested this model again with larger sample size to get better results. The primary data may be more appropriate for this study as some important information related to household decision is missing in HIES data. Despite its weaknesses, this research has given way forward for more detailed analysis on individuals’ income and expenditure data. Such
  • 7. Malik et al. / Journal of Economic Impact, 1(1), 12-18 (2019) 18 researches would lead towards better understanding of distributions of resources within a family. It also helps government to make more competent welfare policies by keeping individual level welfare phenomenon in mind. References Apps, P., Savage, E., 1989. Labour supply, welfare rankings and the measurement of inequality, Journal of Public Economics, 39, 335-364. Bourguignon, F., Chiappori, P.A., 1992. Collective models of household behavior: An introduction. European Economic Review, 36, 355-364. Browning, M., Bourguignon, F., Chiappori, P., Lechene, V., 1994. Income and outcomes: A structural model of intra-household allocation. Journal of Political Economy, 102(6), 1067-1096. Browning, M., Chiappori, P., 1998. Efficient intra- household allocations: a general characterization and empirical tests. Econometrica, 66 (6), 1241-1278. Chen, Z., Woolley, F., 2001. A cournot-nash model of family decision making. Economic Journal, 111, 722- 748. Haddad, L., Kanbur, R., 1990. How serious is the neglect of intra-household inequality. The Economic Journal, 100, 866-881. Konrad, K.A., Lommerud, K.E., 2000. The bargaining family revisited. The Canadian Journal of Economics, 33, 471–487. Kumar, S., Mahadevan, R., 2011. Intra-household income inequality and poverty in a small developing economy. Journal of the Asia Pacific Economy, 143-162 Haddad, L., Kanbur, R., 1992. Intrahousehold inequality and the theory of targeting, European Economic Review, 36 (2), 372-378. https://doi.org/10.1016/0014- 2921(92)90093-C. Lise, J., Seitz, S., 2011. Consumption inequality and intra- household allocations. Review of Economic Studies, 78, 328-355. Lundberg, S.J., Pollak, R., Wales, T., 1997. Do husbands and wives pool their resources? Evidence from the United Kingdom child benefit. Journal of Human Resources, 32(3), 463-480. Lundberg, S., Pollak, R A., 1994. Non-cooperative bargaining models of marriage. American Economic Review, 84, 132-137. Manser, M., Brown, M., 1980. Marriage and household decision theory-A bargaining analysis. International Economic Review, 21, 21-34. McElroy, M.B., Horney, M.J., 1981. Nash-Bargained household decision: Toward a generalization of the theory of demand. International Economic Review, 22 (2), 333-349. Apps, P.F., Rees, R., 1996. Labor supply, household production and intra-family welfare distribution, Journal of Public Economics, 60 (2), 199-219. Phipps, S., Burton, P.S., 1995. Sharing within families: Implications for the measurement of poverty among individuals in Canada. Canadian Journal of Economics, 28 (1), 177-204. Sen, A., 1973. Economic inequality. Cambridge, MA: Oxford University Press. Sen, A., 1984. Values, resources and development. Cambridge, MA: Harvard University Press. Stuart, A., Ord, J.K., 1994. Kendall's advanced theory of statistics. Vol.1: Distribution theory, 6th ed. 3 Volume by A. Stuart and J.K. Ord. London: Hodder Arnold Thomas, D., 1990. Intra-household resource allocation: An inferential approach. Journal of Human Resources, 25 (4), 635-664. Udry, C., 1996. Gender, agricultural production, and the theory of the household. The Journal of Political Economy, 104(5), 1010-1046.