CFO and the Corporate Performance
•
2 likes•1,586 views

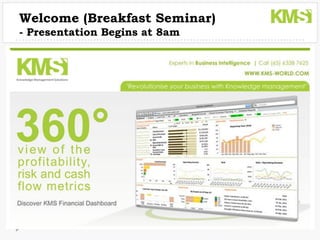
CFOs and the Corporate Performance event presentation is now available for download!! Don't miss out the chance to discover KMS Financial Dashboard and gain a 360 degree view of the profitability, risk and cash flow metrics of your organization. Get in touch with us and learn how to perform Dynamic Analysis, Simulation of Profits, Sensitivity Analysis and uncover key value drivers.

Recommended
Recommended
More Related Content
What's hot
What's hot (19)
Viewers also liked
Viewers also liked (20)
Similar to CFO and the Corporate Performance
Similar to CFO and the Corporate Performance (20)
Recently uploaded
Recently uploaded (20)
CFO and the Corporate Performance
- 1. Welcome (Breakfast Seminar) - Presentation Begins at 8am Knowledge Management Solutions
- 2. CFO & Corporate Performance – Financial Dashboard A 360 Degrees View of your Financial Reporting
- 3. Piecing the Financial Bits Together
- 4. An Overview • Finance professionals are at the heart of any enterprise and significantly impact the Operational Performance, Strategy Planning, Execution & Control. • Stakeholders are increasingly looking to the CFOs as not only those overseeing the books and dealing with the financials. • Today, significant amount of time and effort are spent daily in preparing and digesting voluminous spreadsheets that provide a lot of data but limited decision- making capability. Since Financial Crisis • 3 Mega Shift in Trends • Loss of Trust from Customers, Corporations & Government • Demographics: • New Emerging Markets (Rise of the East) • Customer Behaviors : Going Mobile, Electronic Forms, etc. • Technology Shift & Lifestyle Integration • Social Media, Connecting World, Accessibility of Financial Info Online
- 5. Agenda • Introduction to Knowledge Management Solutions • User Experience – Adrian Chan, CFO of Luxasia Pte Ltd • Leveraging Dashboard to Optimize the Role of CFOs & Walk through the KMS Financial Dashboard – Demo • QlikTech sharing • Jason Bissel, Managing Director for QlikTech Asia • Q & A and Closing
- 6. Knowledge Management Solutions Company Profile & Experiences - Seet Teck Kiang, Head of Sales - Singapore
- 7. About Us • Business Intelligence and Corporate Performance company in Singapore since 2004 • Regional focus 250 customers served 50 Financial Dashboards to MNCs. • Regional Presence • Presence in Singapore ,Malaysia ,Thailand, Hong Kong, New Jersey,(USA) • Specializes in the Large MNCs / Government sector
- 8. Financial Dashboard Platform - QlikView
- 9. Unique Value • KMS key differentiating factor is our consulting talent. • Elite Solution Provider of 7 Years with over Financial Dashboards Implementations in over 50 Corporations • Wealth of experience in Large Enterprise Global Projects with Complex Requirements • Different Verticals Expertise • Consultants with a deep functionality understanding across business domains (Finance, human resources, risk analysis, manufacturing, supply chain, production, etc.)
- 10. Why did they buy it? Similar Conditions • Most have Excel Reporting or Existing Dashboards Challenges • Business Visualization was Poor (i.e. Lack of 360 degrees View) • Technology cause information to display in Silos or In Summary • Lack of Business Associativity & Granularity • Risk vs Revenue vs Assets (Granular at the Business Segment Level) • Canned Reports lack “Dynamism” • Changes to business rules / dimensions were slow to implement • Pressure for Transparency & Accurate Reporting demanded by both Internal Customers & the Financial Community • Senior Management, Line Managers, Investors, Regulators (MAS), Auditors • Increase Speed of Financial Reporting (Closing the books) • What is my exact financial position now & compared to our peers? Our Platform was the Differentiator
- 11. Finance Management & Analytics Dashboard A User Experience - Mr. Adrian Chan, CFO for Luxasia
- 12. Luxasia Pte Ltd and its Subsidiaries/JV A leading distributor of prestigious fragrance, cosmetics, skincare and hair care products with extensive regional business network and presence in more than 10 countries. It is also a retailer, spa operator, distribution agent for apparels and accessories logistic specialist. As a one-stop or complete solution service provider, the Group manages and supports the joint-ventures with partners from the US and Europe. 14
- 13. Financial Dash Board (Before) Key Business Requirements • Brand/Division-wise profitability analysis required • Source system does not capture the overhead exp at brand level • More than 100 brands need to be analyzed • P&L Reports based on complex grouping rules • Complex business rules for apportionment of overhead expenses by Brand by Month • Allocation had to be manually done using thousands of excel sheets • Multi-country with different base currency needed consolidated views • Data issues in the source system captured wrongly affecting the reports 15
- 14. Financial Dash Board (After) Simplification & Standardization Fast Response Data Integrity, to Business Consistency & Changes Transparency Great Speed & Real Time and Values Flexibility: Automated Balance & What If Scenario, Benefits Predictive & Scorecard Detailed Analysis User-friendly & Easy & Short Low Maintenance Implementation Time Productivity Gains 16
- 15. Knowledge Management Solution • Able to understand the business problem because of their experience and wide exposures • Commitment and creativity in finding solutions when constraints are faced 17
- 16. Leveraging Dashboard to Optimize the Role of CFOs A Review of the KMS Financial Dashboard KPI Metrics - Nagesh, Regional Consulting Head - Ramas, Director for Services
- 17. Key Challenges • Integration of information • internal sources • external sources • delivery issues • timeliness • Identifying key indicators • Information delivery • Static • Cross functional data • Disjointed • Interpretation “#$@” • metrics definitions • cross functional challenges • stakeholders vs internal • accounting estimates • qualitative data like market info • Investigative hurdles • Cross the IT wall – knowledge owners • Using the delivered data/info - knowledge users • Inflexible navigation path • Lack of intuitive interface
- 18. KMS Financial Dashboard •Objective •Bridging the gap between the information residing in data and the knowledge users •Enable a user driven platform to Identify, Investigate and Act on items of significance •One view to allow multiple role players to have a single version of the data •Identify •Focus on allowing user to navigate to items of significance •Flexible and intuitive interface using the best in class BI Tool •Knowledge area well defined and easy to interpret --dynamic display of metrics and definitions •navigation path and depth of data required for analysis like summary and detail level •Communicate information of significance •Using a data display medium leveraging on the users knowledge – going beyond exception reporting •Using visual display for easy interpretation •Investigate •enable user defined analysis path for investigation •Act •simulate scenarios for impact analysis •generate actionable information •User Defined Adhoc Analysis and Reports •Deliver Custom Reports for meeting oversight responsibilities
- 19. KMS Financial Dashboard Analytics: A “Fly By Wire” Approach A Demonstration
- 20. Financial Dashboard – Global Mobility
- 25. Financial Dashboard Platform - QlikView
- 26. Conclusion Benefits Powerful Visualization & Interactivity “Qlik & View” 360 Degrees View of Business (Unlimited Dimensions/Transaction Level) Rapid Prototyping to Production Model Quick Review & Change before Launching Associativity between Business Units Finance vs Market Exposure vs Operations Leverages Existing Reports / Data Sources Rapid Change to Business Rules / Dimensions Automate All Standard Reporting (Inc. Time / Effort Savings) Rapid Deployment of Analytics/Reports to Line Managers MOBILITY (Anytime, Any Platform, Anywhere) 30
- 27. Q&A Questions & Answers?
- 28. Financial Dashboard- 1st Come Basis Thank you for coming! Proof of Concept / Workshop – Limited Places If you like what you have seen today and will like to review the Financial Dashboard using your own data. Please indicate on the form/checkbox: i) I’m Interested in a One to One Meeting to explore KMS Financial Dashboard Further. e.g. 26th April, AM i) Proof of Concept ii) Workshop << Limited Dates: 26th (Tues), 27th (Wed), 28th (Thurs) April >> *Please return form to Martha (at door) to obtain your FREE Thumb-Drive!
- 29. Reading the Financial Statement
- 30. We Make Things Easier Customer Profiling (e.g. DW) Financials Projections (Excel ) Local Intelligence (MS Access) ERP/CRM Systems External Data Source (e.g. Currency Exchange)