Overweight underweight and obesity in hertfordshire adults
•
1 like•1,635 views

This slideshow provides the data for adult obesity, underweight and overweight in Hertfordshire, broken down by District and compared to England and Hertfordshire.

Recommended
Recommended
More Related Content
What's hot
What's hot (6)
Viewers also liked
Viewers also liked (20)
Similar to Overweight underweight and obesity in hertfordshire adults
Similar to Overweight underweight and obesity in hertfordshire adults (20)
More from Professor Jim McManus AFBPsS,FFPH,CSci, FRSB, CPsychol
More from Professor Jim McManus AFBPsS,FFPH,CSci, FRSB, CPsychol (20)
Recently uploaded
Recently uploaded (20)
Overweight underweight and obesity in hertfordshire adults
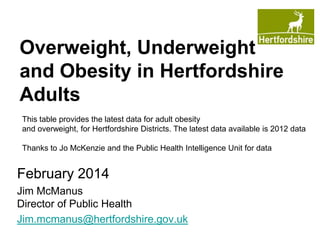
- 1. Overweight, Underweight and Obesity in Hertfordshire Adults This table provides the latest data for adult obesity and overweight, for Hertfordshire Districts. The latest data available is 2012 data Thanks to Jo McKenzie and the Public Health Intelligence Unit for data February 2014 Jim McManus Director of Public Health Jim.mcmanus@hertfordshire.gov.uk
- 2. Why are we issuing this? • Previously our adult obesity survey came from the Health Survey for England • This data comes from the Active People Survey • We explain the benefits of this new data below • Original data source http://www.noo.org.uk/visualisation
- 3. Background • The obesity information which follows has been taken from the Active People Survey 2012. • Obesity data has previously been obtained from the Health Survey for England. • The Active People Survey data is considered to be more accurate as the sample size is greater (133,618 participants in England) than Health Survey for England (15,000 participants). • In addition the data in the Active People Survey has been adjusted to allow for under reporting of weight and over reporting of height.
- 4. Differences between the Health Survey for England and Active Adults Survey • In comparison to the Health Survey to England data, obesity levels for Hertfordshire in the Active Adults Survey are approximately the same. However the distribution across the districts is different and the new Active People Survey has a greater range across the districts than the Health Survey for England. • Those districts with differences greater than 1% are listed below: – – – – – – – – Broxbourne is higher - 28.3% compared to 26.4% Dacorum is higher - 25.2% compared to 22.5%, Three Rivers is higher – 24% compared to 18.6% Watford is higher – 20.9% compared to 17.3% Hertsmere is lower – 20.2% compare to 22.3% North Hertfordshire is lower – 19.1% compared to 22.3% East Hertfordshire is lower – 18.7% compared to 21.4% St Albans is lower – 15.5% compared to 17.3%
- 5. Distribution of obesity, overweight, healthy weight and underweight • The chart on the next slide shows the distribution of obesity, overweight, healthy weight and under weight across Hertfordshire and the districts. • For the first time it includes underweight adults. – Watford has 2.6% underweight adults which is significantly greater than the percentage for Hertfordshire (0.8%). • Welwyn Hatfield has the highest percentage of adults (47%) at a healthy weight and is significantly better than Hertfordshire (37.5%). • Broxbourne has the lowest percentage of healthy weight adults (29.2%) and is significantly worse than Hertfordshire.
- 6. Underweight Healthy Overweight Obese tfo ns sh i re ire Al ba rd sh e rd m er ts tfo rd St . tH er Ea s H er H er fo 40.0% 33.6% 39.5% 38.2% 39.6% 47.0% 35.6% 35.5% 35.6% 30% W at ld rs fie R iv e H at e W el w yn Th re or um na ge 10% 29.2% 44.0% 46.7% 40.9% 41.0% 36.9% 31.5% 39.9% 39.2% 37.1% 41.9% 40.3% 40.8% 70% th ve 37.5% 50% D ac St e ire ne sh 20% 35.0% 21.5% 23.0% 15.5% 18.7% 19.1% 20.2% 20.9% 21.2% 24.0% 25.2% 25.6% 28.3% 80% N or rd d 60% xb ou r tfo la n 90% Br o H er En g Adult obesity in Hertfordshire 2012 100% 40% 0% Source: Active People Survey (Sport for England)
- 7. Adults with Excess Weight • The next slide shows the percentage of adults with excess weight (BMI >= 25) and is split into the categories of overweight and obesity. – Broxbourne has the highest percentage of excess weight and is significantly higher than Hertfordshire. – Welwyn Hatfield is the only district to have a percentage of excess weight which is significantly less than Hertfordshire. – Hertfordshire has significantly less adults with excess weight than England.
- 8. % Overweight % Obese rs W el w yn H at f ie ld W at fo rd St .A lb an s St ev en ag e He rts m No er rth e H er tfo rd sh ire Ri ve 20% Th re e 40% 30% 23.0% 50% 31.5% 36.9% 21.2% 20.9% 15.5% 19.1% 40.9% 44.0% 20.2% 25.6% 24.0% 25.2% 18.7% 41.0% 37.1% 39.9% 39.2% 46.7% 28.3% 40.3% 41.9% 21.5% 40.8% 60% Da co ru m He rtf or ds hi re Br ox bo ur Ea ne st He r tf or ds hi re En gl an d Overweight and obesity in Hertfordshire adults (16+) 2012 80% 70% 10% 0% Source: Active People Survey (Sport for England)
- 9. Obesity in Hertfordshire • The next slide shows the percentages of obesity (BMI >= 30) in Hertfordshire Adults, each district and England. – Broxbourne has a significantly higher percentage of obesity than Hertfordshire while St Albans has significantly less. – There is no significant difference between Hertfordshire and England.
- 10. H at f ie ld rs er e W at fo rd H He rts m yn Ri ve St .A lb an s er tfo rd sh Ea ire st He r tf or ds hi re No rth W el w Th re e Da co ru m St ev en ag e He rtf or ds hi re Br ox bo ur ne En gl an d Obesity in Hertfordshire 2012 (Adults) 30% 25% 20% 15% 10% 5% 0% Source: Active People Survey (Sport for England)
- 11. Is Obesity a Priority for Hertfordshire? • Yes, the Health and Wellbeing Strategy for Hertfordshire set a priority of maintaining a healthy weight and increasing physical activity • The Public Health Strategy adopted this priority • Action is already being taken...see next slide
- 12. 15 Actions being taken so far (more will be done) 1. New weight management service already commissioned and reached 1st 1,000 referrals in three months, more will be commissioned 2. Obesity pathway in place for tiers 1 -3 obesity care. Revision late 2014 3. New lifestyle partnership launched with lifestyle offer for Herts residents to be ready by Easter for phased roll out 4. New online lifestyle service launched in February 5. Workplace physical activity challenge funded and running (Herts Sports Partnership) 6. Workplace Health improvement programme running (Business in the Community) 7. 93% of GPs in Herts now doing NHS HealthChecks 1. Obesity Plan approval by Cabinet due March 2014 2. New child weight management service to be commissioned in 2014 3. Broxbourne whole area obesity pilot underway with Borough and County Council, schools and NHS 4. Fast food takeaway restrictions 5. Countryside walks scheme 6. Year of Cycling launching May 2014 7. Funding for District Councils to work on health improvement agreed and each District working out its plans 8. Continue child weight measurement programme