AB4Web: An On-Line A/B Tester for Comparing User Interface Design Alternatives
•Download as PPTX, PDF•
1 like•183 views

This document describes AB4Web, a web-based tool for conducting randomized A/B tests of user interface designs. The tool allows researchers to collect preference data from online participants on pairs of UI variants. It summarizes the results with measures like preference percentage, latent score of preference, and a preference matrix. The document demonstrates the tool by analyzing preferences across 49 existing graphical adaptive menu designs. Results showed which designs were most and least preferred overall. The tool provides a low-cost way to compare UI alternatives and study design preferences over time without technical expertise.

Recommended
Recommended
More Related Content
More from Jean Vanderdonckt
More from Jean Vanderdonckt (20)
Recently uploaded
Recently uploaded (20)
AB4Web: An On-Line A/B Tester for Comparing User Interface Design Alternatives
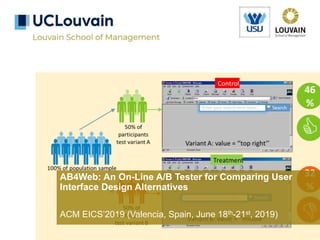
- 1. AB4Web: An On-Line A/B Tester for Comparing User Interface Design Alternatives ACM EICS’2019 (Valencia, Spain, June 18th-21st, 2019)
- 2. AB4Web: An On-Line A/B Tester for Comparing User Interface Design Alternatives ACM EICS’2019 (Valencia, Spain, June 18th-21st, 2019) Jean Vanderdonckt LouRIM Université catholique de Louvain, Belgium Mathieu Zen SIPS Université catholique de Louvain, Belgium Radu-Daniel Vatavu Machine Intelligence & Information Visualization Lab University of Suceava, Romania
- 3. 100% of population sample 32 % 46 % Overall Evaluation Criteria (OEC)= conversion rate Original bi-split testing Stimulus = search box Factor = location 50% of participants test variant A Enter your search term here… Search Variant A: value = ‘’top right’’ Control 50% of participants test variant B Enter your search term here… Search Variant B: value = ‘’middle’’ Treatment EICS’2019 (Valencia, June 18th–21st, 2019) 3
- 4. EICS’2019 (Valencia, June 18th–21st, 2019) 4 100% of population sample Enter your search term here… Search Variant A: value = ‘’top right’’ Control Enter your search term here… Search Variant B: value = ‘’middle’’ Treatment Overall Evaluation Criteria (OEC)= Effort (minutes) Almost certain loser Almost certain winner +5 +4 +3 +2 +1 0 -1 -2 -3 -4 -5 +2.75 Based on 40 tests and a +2.75 repeatability, variant A will likely win with 13.3% median effect Original bi-split testing with full sample Stimulus = search box Factor = location
- 5. EICS’2019 (Valencia, June 18th–21st, 2019) 5 Source: https://goodui.org/patterns/screen/shopping-cart/
- 6. EICS’2019 (Valencia, June 18th–21st, 2019) • Commercial A/B testing tools exist for web sites 6
- 7. EICS’2019 (Valencia, June 18th–21st, 2019) • A/B testing tools also exist for smartphones 7 SplitForce Apptimize Amazon A/B testing Optimimo
- 8. EICS’2019 (Valencia, June 18th–21st, 2019) • A multivariate Split Testing by pairs: with one factor 8 100% of Population sample Stimulus = search box, Factor #1= location (56 values) Treatments = All pairs Variant A Variant B Amount of pairs with one factor = n (n-1)/2 = 56 x 55/2 = 1540
- 9. EICS’2019 (Valencia, June 18th–21st, 2019) • A multivariate Split Testing by pairs: with two factors 9 Amount of pairs with two factors = 1540 x 6 = 9240 Stimulus = search box, Factor #1= location (56 values) Treatments = All pairs 100% of Population sample Variant A Variant B Amount of pairs with one factor = n (n-1)/2 = 56 x 55/2 = 1540 Factor #2= style (4 values)
- 10. EICS’2019 (Valencia, June 18th–21st, 2019) • Our contribution: randomized split testing, a multivariate, multivalued Split Testing with balance 10 Stimulus = search box, Factor #1= location (56 values) Treatments = All pairs 100% of Population sample Variant A Variant B Factor #2= style (4 values) Balanced computationAmount of pairs = P n (n-1)/2 = 50 (for example)
- 11. EICS’2019 (Valencia, June 18th–21st, 2019) 11 A/B testing: Randomized pairs of UI variants are presented to participants and preferences elicited 2 Summary/statistics: summary preference measures computed by AB4Web 3 Transparencymenu MenuItem1 MenuItem2 MenuItem3 MenuItem4 MenuItem5 MenuItem6 MenuItem7 ItemA MenuItem1 MenuItem2 MenuItem3 MenuItem4 MenuItem5 MenuItem6 MenuItem7 ItemA Greyscalingmenu Welcome page: Brief introduction, participation consent, demographics 1 • Our contribution: AB4Web, a web-based tool for conducting randomized split testing
- 12. EICS’2019 (Valencia, June 18th–21st, 2019) 12 • Our contribution: 4 output measures Number of presentations = Total amount of times a UI variant is presented Preference percentage = Number of times a UI variant is preferred Number of presentations Latent Score of Preference= Number of times a UI variant is preferred – Number of times a UI variant is not preferred Number of presentations Matrix of preference = Symmetric matrix where m(i,j) = LSP(i,j) Example 37 23=62% 37 23-11 = 32% 37
- 13. EICS’2019 (Valencia, June 18th–21st, 2019) 13 • Application to Graphical Adaptive Menus (GAMs) • Many GAMs exist today (we found 49!) • Studies analyze performance, awareness, predictability, accuracy,… • Comparing performance (e.g., menu selection time) of 49 GAMs is virtually impossible • Analysing preferences has never been achieved, yet doable thanks to AB4Web
- 14. EICS’2019 (Valencia, June 18th–21st, 2019) 14 • Application to Graphical Adaptive Menus (GAMs) • Building a catalogue of 49 GAMs with animation ItemA MenuItem1 MenuItem2 MenuItem4 MenuItem5 MenuItem3 MenuItem6 MenuItem7 MenuItem3 MenuItem6 Evanescent menu [Bouzit et al., 2015] ItemA MenuItem1 MenuItem2 MenuItem4 MenuItem5 MenuItem3 MenuItem6 MenuItem7 Pulsing menu [Ponsard et al., 2015] ItemA ItemB ItemC MenuItem1 MenuItem2 MenuItem3 MenuItem4 MenuItem5 MenuItem6 MenuItem7 Static menu Split menu (without replication) [Sears & Shn., 1994] MenuItem3 MenuItem6 MenuItem1 MenuItem2 MenuItem4 MenuItem5 MenuItem7 ItemA
- 15. EICS’2019 (Valencia, June 18th–21st, 2019) 15 • Application to Graphical Adaptive Menus (GAMs) • Random population sampling • N=163 participants – 55 outliers = 108 (M=39, SD=12) • 16 countries, 8 languages Male 66% Female 34% Male Female 16 14 12 10 8 6 4 2 0 2 4 6 8 10 20-24 years 25-29 years 30-34 years 35-39 years 40-44 years 45-49 years 50-54 years 55-59 years 60-64 years 65 years and over Male Female
- 16. EICS’2019 (Valencia, June 18th–21st, 2019) 16 • Application to Graphical Adaptive Menus (GAMs) • Procedure: P=50 pairs per participant (instead of 1176)
- 17. 81% 77% 76% 70% 69% 66% 63% 63% 61% 57% 57% 54% 54% 53% 52% 52% 49% 48% 46% 46% 45% 45% 44% 43% 41% 41% 40% 40% 39% 39% 37% 37% 36% 35% 34% 33% 32% 32% 31% 30% 29% 28% 28% 28% 27% 24% 21% 19% 8% 14% 18% 18% 24% 26% 26% 31% 28% 30% 32% 36% 36% 38% 33% 40% 41% 40% 39% 43% 43% 43% 44% 46% 44% 48% 48% 44% 49% 45% 43% 48% 52% 51% 56% 51% 58% 54% 57% 52% 57% 56% 57% 57% 63% 57% 63% 64% 60% 79% 5% 5% 6% 6% 6% 8% 6% 9% 10% 10% 7% 10% 8% 14% 8% 7% 11% 14% 10% 10% 12% 11% 10% 13% 11% 11% 15% 11% 15% 19% 15% 12% 14% 8% 15% 10% 14% 11% 17% 13% 16% 15% 15% 10% 15% 13% 15% 21% 13% 0% 10% 20% 30% 40% 50% 60% 70% 80% 90% 100% 1. Greyscaling Menu (170) 2. Transparency Menu (218) 3. Highlighting Menu (192) 4. Rating Menu (212) 5. Underlying Menu (198) 6. Pushpin Menu (191) 7. Bowing Menu (179) 8. Fish-eye Menu (187) 9. Bolding Menu (168) 10. Morphing Menu (197) 11. Split Menu with Replication (189) 12. Patined Menu (171) 13. Probability-based Menu (190) 14. Prediction-by-bar Menu (192) 15. Smart Menu (196) 16. Frequency-based Menu (175) 17. Prediction-by-line Menu (184) 18. Font-changing Menu (197) 19. Blurring Menu (196) 20. Bubbling Menu (182) 21. Split Menu without replication (170) 22. Split Menu with Scrollbar (179) 23. Pulsing Menu (178) 24. Glowing Menu (208) 25. Prediction-by-scale Menu (163) 26. Blinking Menu (190) 27. Cloud Menu (188) 28. Fish-eye colored menu (192) 29. Time-based Menu (185) 30. Ephemeral Menu (178) 31. Rainbow menu (201) 32. Step-by-step Menu (180) 33. In-context Appearing Menu (200) 34. Split Menu with Arrowbar (192) 35. Twisting Menu (174) 36. Square Menu (187) 37. Italiczing Menu (192) 38. Temporal Menu (214) 39. Out-context Disappearing Menu (183) 40. Heatmap Menu (167) 41. Polymodal Menu (160) 42. Tree Menu (181) 43. Prediction-by-color Menu (192) 44. Evanescent Menu (178) 45. Weared Menu (204) 46. Prediction-by-rainbow Menu (183) 47. Hyperbolic Menu (190) 48. Flower Menu (176) 49. Rotating Menu (179) Percentage[%] Menutype(order,numberofpresentations) Preferred Not preferred Undecided 50% 30 % 20 % <20 % EICS’2019 (Valencia, June 18th–21st, 2019) 17 • Results: Preference percentage
- 18. EICS’2019 (Valencia, June 18th–21st, 2019) 18 • Results: Latent score of preference 127 114 110 99 85 76 64 58 52 49 40 39 32 30 23 19 18 17 6 5 4 3 -3 -4 -7 -8 -12 -13 -14 -17 -22 -27 -29 -30 -38 -40 -42 -44 -45 -47 -52 -54 -55 -61 -63 -71 -72 -82 -128 -140 -90 -40 10 60 110 Transparency Menu Greyscaling Menu Highlighting Menu Rating Menu Underlying Menu Pushpin Menu Fish-eye Menu Bowing Menu Bolding Menu Morphing Menu Split Menu with Replication Prediction-by-bar Menu Patined Menu Probability-based Menu Smart Menu Frequency-based Menu Font-changing Menu Prediction-by-line Menu Blurring Menu Bubbling Menu Split Menu without replication Split Menu with Scrollbar Glowing Menu Pulsing Menu Cloud Menu Ephemeral Menu Prediction-by-scale Menu Time-based Menu Blinking Menu Fish-eye colored menu Rainbow menu Step-by-step Menu Twisting Menu In-context Appearing Menu Out-context Disappearing Menu Split Menu with Arrowbar Italiczing Menu Polymodal Menu Heatmap Menu Square Menu Tree Menu Temporal Menu Prediction-by-color Menu Weared Menu Evanescent Menu Flower Menu Prediction-by-rainbow Menu Hyperbolic Menu Rotating Menu Menutype BTL score
- 19. EICS’2019 (Valencia, June 18th–21st, 2019) 19 • Results: Matrix of preference Bounding value: b=8
- 20. EICS’2019 (Valencia, June 18th–21st, 2019) • Cost-benefit analysis 20 Low cost operationalization Flexibility of UI variants Continuity of the experiment Comparison over time No technical expertise Free format of UI variants Fixed presentation policy Single OEC Only 4 implemented measures Segmentation and targeting
- 21. EICS’2019 (Valencia, June 18th–21st, 2019) • Future Work: More flexibility in experiment design • Segmentation • Tournament 21
- 22. Thank you very much for your attention Try it yourself at https://mathieuzen.github.io/adaptive-menus-ranking/ See results at https://mathieuzen.github.io/adaptive-menus-ranking/#/stats