SlideShare a Scribd company logo
1 of 56
Reducing Company Health Cost – Draft 3


Reducing Company Health Cost
   $                     Average Premiums
  800
                                                              U.S. Avg.

  700

                                                       Your Company
  600

  500

  400


   Year    04             05               06                 07             08


 Proven Strategies to Empower Managers
  and Employees to Reduce Health Cost


           By Keith Center

                     Karen Mehl, RN, BSN

                               Donald Barker, MHA

           © 2009 Keith Center, Karen Mehl, Don Barker. All rights reserved.
          May not be duplicated, reproduced or retransmitted without permission
                  www.masonbiz.com www.healthservicereview.com
                                                                                  1
Reducing Company Health Cost – Draft 3


  © 2009 Keith Center, Karen Mehl, Don Barker. All rights reserved.
 May not be duplicated, reproduced or retransmitted without permission
         www.masonbiz.com www.healthservicereview.com
                                                                         2
Reducing Company Health Cost – Draft 3


                      Don Barker, MHA
                      Founder, President & CEO of HSR
                      Prior to founding Health Service Review in 1983, Mr. Barker had many years of
                      experience in hospital management and patient care. His experience includes
                      several executive positions with responsibility for patient care, PPO development,
                      customer service, marketing, human resources and hospital planning.


                      Karen Mehl, RN, BSN
                      Founder, Vice-President , Operations & CFO of HSR
                      Before founding HSR, Ms. Mehl was Vice President of nursing at a regional hospital.
                      Prior to this, her experience included executive positions in patient care, staff
                      development and a School of Nursing.


                      Keith Center
                      President, Mason International Business Group
                      Speaker, author and consultant, Keith has worked with large and small companies
                      for over 30 years including IBM, Toyota, GE Capital, International Harvester and
                      Fujitsu Consulting. He is an Accredited Associate of the Institute for Independent
                      Business, a Certified Guerrilla Marketing Coach and author of Money, Time &
                      People…will kill your business.


If you would like to connect with Don and his team today, simply fire off an email to
dbarker@healthservicereview.com


© Copyright 2009 by Keith Center, Karen Mehl and Donald Barker

All rights reserved under International and Pan-American Copyright Conventions. Published in the
United States by Mason International Business Group, Ltd. Mason, OH, U.S.A. No part of this publication
may be reproduced, stored in a retrieval system, or transmitted in any form or by any means – electronic,
mechanical, or photocopying, recording or scanning – without the prior written permission of the authors,
or publisher. Requests for permission should be addressed to Mason International Business Group, Ltd.
Mason, OH, U.S.A.

keithcenter@masonbiz.com; 513-459-7309

ISBN Number

Manufactured in the United States of America
081011


                       © 2009 Keith Center, Karen Mehl, Don Barker. All rights reserved.
                      May not be duplicated, reproduced or retransmitted without permission
                              www.masonbiz.com www.healthservicereview.com
                                                                                                           3
Reducing Company Health Cost – Draft 3


Welcome

The purpose of this book is to demystify health care for the business owner, and also show how
to implement concrete strategies for monitoring and managing health care costs. As a result,
the reader will be better equipped to reduce health care costs for his or her business.

Many in this industry say that “claims are claims.” In other words, claims are going to happen
and there is not a thing that you can do about it. The purpose of this book is to show that
there is something that the business owner can do to reduce the high cost of claims.

There are two modules in this book. Module I gives the landscape of the root causes of major
areas of cost in the U.S. today. Module II provides the dashboard for getting control of your
costs as well as an outline of the players and the questions to ask.

This book will also act as a guide for the employee to ensure that they get the best quality
health care from their plan.

It is our sincere hope that you use this material to discover new ways in which you can not only
get control of your health care spend, but also to reduce current costs.

                                                                Don, Karen & Keith
                                                                    www.healthservicereview.com


                     © 2009 Keith Center, Karen Mehl, Don Barker. All rights reserved.
                    May not be duplicated, reproduced or retransmitted without permission
                            www.masonbiz.com www.healthservicereview.com
                                                                                                  4
Reducing Company Health Cost – Draft 3

  Reducing Company Health Cost
                            Table of Contents
                                       Module I

                      Root Causes of Health Cost
Chapter One: Cost of Medical Service
  What Do We Get for All of Our Money Spent on Health Care?
  Insurance Premiums Are Sky Rocketing!
  Key Cause of Health Cost
  How Do People Get That Sick?

Chapter Two: Availability of Medical Service
  Deterioration of the Quality of Life
  Reasons Why Disease Progresses So Fast

Chapter Three: The Quality of Medicine
  Event Rates in U.S. Hospitals
  The Cost of Hospital Avoidable Events
  Causes of Medication Errors

                                       Module II

          Three Actions to Reduce Your Health Cost
Chapter Four: Which Key Performance Indicators to Use?
  Setting up Your Medical Management Dashboard
  Step One: Predictive Modeling
  Step Two: The True Key Performance Indicators

Chapter Five: What To Do To Get Key Players Accountable?
  Health Insurance Provider
  Hospital & Preferred Provider Organization (PPO)
  What to Do to Get Your Broker Working for You
  Third Party Administrator

Chapter Six: Empower Your Employees to Reduce Cost
  Five Steps to Safer Health Care
  Twenty Tips to Prevent Medical Error
  Getting Prepared for Medical Appointments


              © 2009 Keith Center, Karen Mehl, Don Barker. All rights reserved.
             May not be duplicated, reproduced or retransmitted without permission
                     www.masonbiz.com www.healthservicereview.com
                                                                                     5
Reducing Company Health Cost – Draft 3


  © 2009 Keith Center, Karen Mehl, Don Barker. All rights reserved.
 May not be duplicated, reproduced or retransmitted without permission
         www.masonbiz.com www.healthservicereview.com
                                                                         6
Reducing Company Health Cost – Draft 3


                            Part I


Root Causes of Health Cost


  © 2009 Keith Center, Karen Mehl, Don Barker. All rights reserved.
 May not be duplicated, reproduced or retransmitted without permission
         www.masonbiz.com www.healthservicereview.com
                                                                         7
Reducing Company Health Cost – Draft 3


  © 2009 Keith Center, Karen Mehl, Don Barker. All rights reserved.
 May not be duplicated, reproduced or retransmitted without permission
         www.masonbiz.com www.healthservicereview.com
                                                                         8
Reducing Company Health Cost – Draft 3

Chapter One
Cost of Medical Service
When it comes to any industry, the three top things that are most important are quality, cost
and timing.

Health care is no different, only we might say “quality, cost and availability of service”.

America’s health care system has long been considered superior to that of other countries
because there is very little to no waiting time for major interventions. But how do we really
compare? And what about the other two areas of cost and quality?


                Figure 1: International Comparison of Spending on Health,
                                         1980–2006
               Average spending on health                                    Total expenditures on health
                  per capita ($US PPP)                                            as percent of GDP
7000                                                             16

              Australia
              Canada
                                                                 14
6000          Denmark
              France
              Germany
              Netherlands                                        12
5000          New Zealand
              Sweden
              Switzerland                                        10
              United Kingdom
4000          United States
                                                                  8

3000
                                                                  6                                      Australia
                                                                                                         Canada
                                                                                                         Denmark
2000                                                                                                     France
                                                                  4                                      Germany
                                                                                                         Netherlands
                                                                                                         New Zealand
1000
                                                                  2
                                                                                                         Sweden
                                                                                                         Switzerland
                                                                                                         United Kingdom
                                                                                                         United States
   0                                                              0
       1980   1984    1988     1992   1996    2000   2004 2006        1980   1984   1988   1992   1996    2000   2004 2006


       Data: OECD Health Data 2008 (June 2008)


From this graph it is clear that the U.S. expenditure on health care is double that of major
industrialized, western countries, but why?

Before we get into the answer, let’s look at what we get for all the money spent on health care.


                              © 2009 Keith Center, Karen Mehl, Don Barker. All rights reserved.
                             May not be duplicated, reproduced or retransmitted without permission
                                     www.masonbiz.com www.healthservicereview.com
                                                                                                                             9
Reducing Company Health Cost – Draft 3

What Do We Get For All of Our Money Spent on Health Care?

Avoidable Events Leading Cause of Death

In 1997, the Institute of Medicine published a paper stating that preventable medical events
account for nearly 100,000 deaths every year. By contrast, motor vehicle accidents cause about
46,000 deaths yearly.

                       Figure 2: Number of Deaths
                        100,000


                          80,000


                          60,000


                          40,000


                          20,000


                                         98,000               45,485                42,297
                                         Errors in         Motor Vehicle         Breast Cancer
                                         Hospitals          Accidents


Source: Institute of Medicine


This study by the Institute of Medicine is referred to over and over again by people researching
medical events.

That being said, a more recent study of 37 Million patient records in 2001, 2002 and 2003, by
HealthGrades determined that the Institute for Medicine’s number of deaths is low! From
HealthGrade’s data the number is more like 195,000 deaths per year in hospitals due to
potentially preventable, in-hospital medical events.

To put that in perspective, that’s about 2,000,000 people that have died since the original
Institute of Medicine study and yet little has been accomplished. Why aren’t we hearing more
about this? The same number of people died in the Killing Fields in Cambodia and the world
was shocked and outraged. Journalists described the Killing Fields as genocide. So how would
they describe what goes on in hospitals?

Dr. Samantha Collier, HealthGrades' vice president of medical affairs said, "The equivalent of
390 jumbo jets full of people are dying each year due to likely preventable, in-hospital medical
events, making this one of the leading killers in the U.S."

Consider this: if the FAA allowed jets to crash at a rate of over one per day for a year, don’t
you think that there would be a public outcry? Do you think that the public would put up with
the FAA plodding along at their own pace?

                             © 2009 Keith Center, Karen Mehl, Don Barker. All rights reserved.
                            May not be duplicated, reproduced or retransmitted without permission
                                    www.masonbiz.com www.healthservicereview.com
                                                                                                    10
Reducing Company Health Cost – Draft 3
But that is exactly is what the medical industry is doing: plodding along at their own pace. And
the death toll continues to increase. At the same time, the politicians, not to mention the health
care industry, are doing little to improve the situation.

According to Lucian Leape , a major factor is fatigue.

          “Health care is the only industry that does not believe that fatigue
          diminishes performance.”
                                Lucian Leape, MD, Department of Health and Policy, Harvard University.

Aircrews are monitored for fatigue, and as people get more tired the opportunity for diminished
communication effectiveness and increased conflict. With aircrew, 90% of disagreements are
resolved in the cockpit, but with medical teams only 10% are resolved in the operating room.

          “Being awake for 24 hours results in impairment of judgment and physical
          dexterity equivalent to a blood alcohol level of 0.1”
                                Steven Meisel, Pharm D., Director of Medication Safety,
                                Fairview Health Services, Minneapolis, Minnesota.


Insurance Premiums Are Sky Rocketing!

Insurance companies like to spin the numbers and say that your premium only went up by “x
percent” this year. In fact, insurance premiums have risen dramatically in recent times.

In the following chart, the percentage of increase per year for insurance premiums is shown.

                Figure 3: Cumulative Changes in Health Insurance Premiums,
                         Inflation, and Workers’ Earnings, 1999-2008
   140%
                                                                                                               119%
   120%

   100%

     80%

     60%

     40%                                                                                                       34%

     20%                                                                                                       29%

      0%
               1999        2000        2001       2002        2003          2004   2005      2006       2007   2008

 Source: Kaiser/HRET Survey of Employer-Sponsored Health Benefits,
 2000-2008. Bureau of Labor Statistics, Consumer Price Index, U.S. City                   Health Insurance Premiums
 Average of Annual Inflation (April to April), 2000-2008; Bureau of Labor
                                                                                          Workers' Earnings
 Statistics, Seasonally Adjusted Data from the Current Employment
 Statistics Survey, 2000-2008 (April to April).                                           Overall Inflation

As can be seen, the accumulated cost increase is a whopping 119%. More than three times the
rate of inflation!
                            © 2009 Keith Center, Karen Mehl, Don Barker. All rights reserved.
                           May not be duplicated, reproduced or retransmitted without permission
                                   www.masonbiz.com www.healthservicereview.com
                                                                                                                      11
Reducing Company Health Cost – Draft 3
It is no wonder that after payroll and plant equipment, health care is the third largest cost to
businesses.

Not only is it a large expense, it is the least likely to be understood. Health care is complex,
and the internal operations of the health care industry are a mystery to many business
executives.


Key Cause of Health Cost
Many in the health care insurance industry say “Claims are claims,” meaning that medical claims
are going to happen anyway that there is little that a business owner can do to impact them.
But is this true? Do we just sit back and accept that rising health care insurance cost will drive
us out of business? Or do we expect the government to pay for it all, and then close our doors
due to increased taxation to pay for it all?

What can we do? First we need to understand where the claims, or costs, are coming from. In
the following chart, we see the distribution of cost across the population in the United States.

            Figure 4: U.S. Health Care Spending Disproportionate for Patients with
                      Chronic Conditions


From this chart we can see that 47% of the health care cost is driven by only 14% of the
population. And in fact, 85% of the cost comes from less than half of the population.

How Do People Get That Sick?
In today’s health care landscape it is just a matter of time before “an actuarial moment”, or
catastrophic event occurs. And with most catastrophes there are signs leading up to the event.
And when one understands the signs, evasive measures can be taken.

People can be divided into three categories, high, medium and low risk. This may be due to a
variety of factors, health, medical care and compliance, and just plain bad luck.


                      © 2009 Keith Center, Karen Mehl, Don Barker. All rights reserved.
                     May not be duplicated, reproduced or retransmitted without permission
                             www.masonbiz.com www.healthservicereview.com
                                                                                                   12
Reducing Company Health Cost – Draft 3
Those who are high risk, may exhibit symptoms of a major health impact for years before it
finally happens. The key to cost control is the early detection of these symptoms and to
mitigate the risk before the catastrophic event happens.

The major cost impacts are triggered by catastrophic events such as premature births, major
cardiac events, complications due to diabetes, as well as others that can be detected early, and
the risks mitigated.

Let’s look at the progression of disease in a general population. In the following chart, there are
three different graph lines representing people at high, medium and low risk. The Y-Axis is the
cost impact to a medical plan. The X-Axis shows time over twenty-four quarters, or six years.
Twelve quarters (three years) before the catastrophic event, point Q0, and twelve quarters
after.

                         Figure 5: Today’s Health Care Landscape

                                 Medical Management
9000
8000          Serious Cost
7000          Medium Cost

6000          Low Cost

5000
4000                                                             Condition Management
         Health Promotion
                                                                     Opportunity
3000       Opportunity
2000
1000
   0
       Q-12     Q-9        Q-6         Q-3          Q0          Q+3         Q+6        Q+9    Q+12
                 Musich, Schultz, Burton, Edington. Michigan Health Management Institute


The green line shows the medical cost of a healthy person over the same timeframe of six years.

The yellow line shows the increased cost for a moderately healthy individual. This person is
most likely under medical supervision, takes their medication and is what we call compliant with
the medical directions given, called medical protocols.

Let’s look at the progression of the financial impact of event that happened to a patient. Q0 is
the point at which the cost peaked due to a major illness. Moving left from this point, Q-3
through Q-12 show that the costs were increasing as a result of the condition getting worse.
The cost started to climb from Q-9 through Q-3. The increasing cost is clearly visible. It is
during this period of escalating medical care should have been a signal for intervention. Medical
intervention during this timeframe would have preempted the need for extremely expensive
Medical Care Management. It’s what we call a “Health Promotion Opportunity.”


                       © 2009 Keith Center, Karen Mehl, Don Barker. All rights reserved.
                      May not be duplicated, reproduced or retransmitted without permission
                              www.masonbiz.com www.healthservicereview.com
                                                                                                     13
Reducing Company Health Cost – Draft 3
Unchecked, this disease escalated, and so did the cost. After the disease peaked, ongoing
medical attention was necessary and the ongoing cost was higher than it had been before the
event.

There is the potential for another major health episode if the patient’s condition, and adherence
to medical protocols, is not monitored. That is why the timeframe after the event is called a
“Condition Management Opportunity.”

As D. Edington says, “The solution is for sick people to not get any sicker.”


                     © 2009 Keith Center, Karen Mehl, Don Barker. All rights reserved.
                    May not be duplicated, reproduced or retransmitted without permission
                            www.masonbiz.com www.healthservicereview.com
                                                                                               14
Reducing Company Health Cost – Draft 3


Chapter Two
Availability of Medical Service
The availability of medical service is not a great issue in this country, but having the right medical
care at the right time is. In other words, going to the wrong specialist means that the care
administered may be neither timely, nor correct. The specialist may have been incorrectly
recommended, or the patient made the decision on who to see by themselves.

This often results in what is called “Rule Out Medicine.” In other words, the clinician does all
that they can, and in the end says “I can’t help you.” More often than not, a patient who decides
for themselves to see a particular specialist makes the wrong choice. The patient calls their
insurance carrier. A person at the carrier’s help desk tells them whether or not the clinician is
on their approved list, not whether they are going to get the right treatment.

This results in running up the cost to the health plan and the patient, but without a solution.

The insurance company should be making sure that the patient is getting the right treatment.
Not from a provider who is merely on their list, not someone who is the lowest cost, but a
provider who has the right expertise to deliver quality health care and provide the right
treatment.

This should also include out of network providers. For some conditions, the best clinician may
not be within the network. Large insurance companies tend to be inflexible and do not typically
negotiate out of network deals. As a result, out of network health care runs up the cost to the
health plan even more.

It’s a function of getting the right care, at the right time, for the right price.

Also, as stated earlier, the U.S. health care system has historically delivered service with very
little waiting compared to other nations. But has this resulted in healthier people?

In order to get an answer to that question, we need to first ask “Are interventions happening at
the correct time?”


                       © 2009 Keith Center, Karen Mehl, Don Barker. All rights reserved.
                      May not be duplicated, reproduced or retransmitted without permission
                              www.masonbiz.com www.healthservicereview.com
                                                                                                    15
Reducing Company Health Cost – Draft 3
Deterioration of the Quality of Life
In Figure 1, we saw how much higher the cost for health care in the U.S. was. Why? Well,
we’ve already discussed D. Edington’s chart of how catastrophic events happen. Now let’s look
at how the U.S. approach to medical intervention creates greater expense.

We are paying for healthcare in more than dollars.

The following chart shows the focus in the U.S. on expensive medical management known as
Disease Management and Case Management.

Figure 6: Deterioration of the Quality of Life
                   $
                                                                      Utilization Review &
                                                                      Case Management
                                                                           This is
                                              Disease Management           where the
                                                                                        R.I.P
                                                                           major             .
                                                                                      D
                                              Controls Future Costs        costs are x ead


                             Well


As can be seen in the above chart, the difficulty with the American approach to medicine is that
major intervention occurs toward the end of life. And that is when the cost of health care is the
greatest.

If those who are at risk are detected earlier, then medical intervention action can also be earlier.
Protocols can be set in place, and patient compliance to those protocols can be monitored and
coached so that patients will not get any sicker.

The results are clear. Improved health, or at least stabilized health, will result in moving the
patient more to the left of this chart. Earlier intervention will avoid the escalation of medical
management costs, and improve the patient’s quality of life.

Predictive Modeling
Predictive modeling is a technique for the early detection of people that are at risk. It is best
described as artificial intelligence software.

Most insurance providers may claim to use predictive modeling software. But in addition to the
variation in quality of the software products used, any tool is only as good as the craftsman using
it. The effectiveness of this artificial intelligence software needs to be sharpened by medical
professionals who understand at a deep level how to set up the right filters to detect those
patients who are at maximum risk.

Once at risk people are detected, they can be placed under supervision of a RN health coach.
The coach ensures that their health does not deteriorate due to lack of knowledge, or lack of
compliance with medical protocols that are designed to help them stabilize and improve their
health.

                        © 2009 Keith Center, Karen Mehl, Don Barker. All rights reserved.
                       May not be duplicated, reproduced or retransmitted without permission
                               www.masonbiz.com www.healthservicereview.com
                                                                                                    16
Reducing Company Health Cost – Draft 3


Reasons Why Diseases Progress So Fast
Let’s look at some specific examples of disease progression, the opportunities for intervention,
and the cost impact.

Example 1: The Progression of Heart Disease
In the following example of the progression of heart disease, there are multiple opportunities
for medical intervention.

Figure 7: The Progression of Heart Disease

                                                                      Transplant
              $160,000

                                                           By-Pass
                                                           Surgery
               $60,000

                                              Angiogram
                                              Angioplasty
                                              Stents                 Historical UR/CM
               $30,000                                               Intervention
       Cost


                                                                Current Disease Mgt.
                                                                Industry Intervention

                $6,000                                          Office Visit - Medication
                                                                Intervention
                                 Early
                    $600
                                 Intervention                   Diet and Exercise
                                 Opportunity                    Lifestyle Changes


                                                                               Irreversible Disease
                                 Undetected              Chest Pain
                          s
                      ion


                                                                                   Heart Failure
                                 Symptoms            Mild Heart Damage
                        t
                     en


                                 & Trends
                  rv


                                           Hypertension           Myocardial Infarct
               te


                                           Hyperlipidemia           Moderate Heart
              In


                                                                      Damage
                                                 Manifestations

If ignored, or undetected, the cost of intervention increases dramatically. Delay in intervention
impacts the quality of life for the patient, and their family, as well as dramatically increasing the
cost of health care.

The medical insurance plan takes a major hit when the probability of this event may have been
readily detected earlier. Predictive modeling software, regular visits to a Primary Care Physician,
and ensuring that the patient is complying with the medical protocols set in place by the
physician, could have impacted the progression of the disease.

Once again, getting the right care from the right clinician, at the right time, would have a positive
impact on the wellness of the patient, and reduce the overall cost to the health plan.


                             © 2009 Keith Center, Karen Mehl, Don Barker. All rights reserved.
                            May not be duplicated, reproduced or retransmitted without permission
                                    www.masonbiz.com www.healthservicereview.com
                                                                                                      17
Reducing Company Health Cost – Draft 3

Example 2: Diabetic 57 Year Old Male
This next example is of a 57 year old male diabetic. Over the space of only 26 months went
from clearly detected and treatable Type II diabetes, to having a leg amputated. In addition to
the amputation, he ended up in a nursing home.

This tragic situation could have been avoided.

Figure 8: The Progression of Diabetes

$300,000


                                                                      09/07/07


                                                                                                                    05/08/09
$200,000
                                             09/04/06
                  01/25/06


$100,000


    $0.00


                                                                                                                           or
                                                                        d


                                                                                                                            e
                                 II
                 s


                                                                        z


                                                                                         s
                                                                      3)


                                                                                                                         aj )


                                                                                                                            e
                                                                                                                    - M yr
                                                                     D


                                                                                        iti
                er


                                                                                                                         ar
                                                                    lle


                                                                                                                        en
                               pe


                                                                  (X


                                                                                         l
              lc


                                                                                                                       C
                                                                                      ya


                                                                                                                  n 1
                                                                sc
                                                                 ro


                                                                                                                      gr
                             Ty


                                                                                                               tio (
             U


                                                              nt
                                                              se


                                                                                                                    e
                                                                                     m
                                                             Va


                                                                                                                   an


                                                                                                             ta X 3


                                                                                                                 om
            in


                                                            co
                           s


                                                                                   eo
                                                            U


                                                                                                                 G
                        te
         Sk


                                                           h
                                                       Un


                                                                                                               H
                                                                                                          pu re
                                                                                 st
                                       lin


                                                       r ip
                     be


                                                                                 O


                                                                                                     Am Ca
     ic


                                                                                                            ng
                                    su


                                                    Pe
                  ia


                                                     s
    on


                                                   te


                                                                                                         si
                 D


                                 In


                                                                                                        nt
                                               t ic
  hr


                                              be


                                                                                                      ur
                                                                                                    tie
 C


                                                                                                   N
                                            be
                                            ia


                                                                                                 pa
                                          D


                                         ia


                                                                                              In
                                        D


As can be seen in this chart, there were several plateaus where the disease could have been
contained through treatment, education, coaching and compliance.

The impact to the health plan was greater than the $300,000 shown here. The ongoing cost of
the nursing home became a continual cost drain on the health plan.

In both of the preceding examples there were prior events that indicated the impending severity
of risk to the patient. If detected and treated at an earlier stage, the result would have been
better quality of life for the patient, and lower impact to the health care plan.

It is events like these that can be detected, but are not addressed until late in the progression of
the disease, that creates the major impact on spiraling health care costs.

That being said, there is more to health care cost than early intervention and compliance.


                                © 2009 Keith Center, Karen Mehl, Don Barker. All rights reserved.
                               May not be duplicated, reproduced or retransmitted without permission
                                       www.masonbiz.com www.healthservicereview.com
                                                                                                                                18
Reducing Company Health Cost – Draft 3


Chapter Three
The Quality of Medicine
Physicians today still take the Hippocratic Oath stated by Hippocrates, the father of medicine.
What ever happened to the statement that is attributed to Hippocrates?

                                                     “First do no harm?”

(By the way, this statement is not actually in the Hippocratic Oath, but is often quoted.
Nonetheless, it is an excellent principle for all businesses to adhere to, not just medicine).

Health care today has become a very complex industry with many moving parts and players.

                         “Medicine used to be simple, ineffective, and relatively safe…
                         …Now it is complex, effective, and potentially dangerous.”
                                                                                    Sir Cyril Chantler


Event Rates in U.S. Hospitals

The Institute of medicine stated in 1999 that there are over 98,000 deaths per year due to
mistakes in hospitals alone, not counting the rest of the industry. And HealthGrades reported
from their data, that the number is more like 195,000.

                                              Figure 9: Event Rates in US Hospitals

                        -7

                        -6                                                                                              ???
   Log(10) Error Rate


                        -5                                                                   Scheduled Airlines,
                                                                                             Nuclear Power,
                        -4                                                                   European Railroads,
                                  Hospitals                                                  Aircraft Carriers
                        -3                                    Auto driving
                                                              Chemical Industry
                                                              Charter Flights
                        -2
                             Bungee Jumping
                        -1   Extreme Mountain Climbing
                             Motor Cycle Racing
                        0
                             Dangerous                         Regulated                           Ultra Safe       Ideal System
                              Systems                           Systems                             Systems

                                                                                   Amalberti, R. Safety Science, 2001


The chart speaks for itself. Hospitals are not as safe as most people assume. Note that both
axes are logarithmic.


                                        © 2009 Keith Center, Karen Mehl, Don Barker. All rights reserved.
                                       May not be duplicated, reproduced or retransmitted without permission
                                               www.masonbiz.com www.healthservicereview.com
                                                                                                                                   19
Reducing Company Health Cost – Draft 3
What is the root cause of these mistakes?

         “Medical accidents are usually the result of complex systems failure. Although
         incompetent and malfeasant staff exist, adverse outcomes are more commonly
         the result of systems problems. As safety in the aviation industry improved only
         after its leaders adopted this tenet, safety in medicine will not improve unless its
         complex systems are redesigned.”

                                                    Steven Meisel, Pharm.D., Director of Medication Safety,
                                                    Fairview Health Services, Minneapolis, Minnesota


The key areas are medical errors, hospital acquired infections, drug toxicity, and recommended
care not being administered.

Consider these statistics from the New England Journal of Medicine.

    •    3% or more of hospital patients are hurt by medical error.
    •    1 in 300 patients die from such mistakes. In U.S. aviation only 1 in 5 million
         flights ends in a deadly accident.
    •    24% of people say they or a family member have been harmed by a medical
         error.
    •    90,000 people die of hospital-acquired infections annually. More than half of
         these deaths may be preventable.
    •    180,000 elderly outpatients die or are seriously injured by drug toxicity. Half of
         these incidents may be preventable.
    •    7,000 patients die from drug errors each year.
    •    554 errors in four months were found at one six-bed intensive care unit; 147
         were potentially serious or life-threatening.
    •    55% of recommended care actually gets administered.
    •    $2,000 Annual cost to employers per insured worker, due to poor-quality care.

    Sources: Lucian Leape; New England Journal of Medicine; CDC; Forbes; Journal of the American Medical Association;
    Institute of Medicine; Quality and Safety in Health Care; RAND; Midwest Business Group on Health.


    “Research estimates that more than one million serious medication errors
    occur each year in U.S. hospitals, with 7,000 deaths annually from adverse drug
    events (ADEs). In addition to the human price paid, each ADE adds $2,000 on
    average to the cost of a hospitalization. This translates to more than $7.5 billion
    per year nationwide in hospital costs alone.”
                                                    The Leapfrog Group, 2008 Hospital Annual Report

Everyone knows someone with a story about the negative impact of sub standard medicine, but
what can you do about it? After all, business executives do care about their employees, for
without them they would not have a business.

But how to determine which hospitals are safest? The Leapfrog group is striving to get
the data, but most of the participating hospitals are already among the best in the
country.


                          © 2009 Keith Center, Karen Mehl, Don Barker. All rights reserved.
                         May not be duplicated, reproduced or retransmitted without permission
                                 www.masonbiz.com www.healthservicereview.com
                                                                                                                        20
Reducing Company Health Cost – Draft 3
Medical management company Case Managers should also be able to do this for you and
make recommendations to hospitals based on qualitative aspects, especially within your
region.


The Cost of Hospital Avoidable Events
We need to be aware of the quality of service as well as the cost. That is where a
competent, educated Medical Management Provider comes in. Most of the large
companies run their facilities like call centers. People answering calls do have a lot of
medical training in many cases. Furthermore they are measured on time per call, calls
per hour and cost savings, not on the quality of the care given.

                        Surgical errors cost nearly $1.5 billion annually

Potentially preventable medical errors that occur during or after surgery may cost employers
nearly $1.5 billion a year, according to new estimates by researchers William E. Encinosa, Ph.D.,
and Fred J. Hellinger, Ph.D., of the Agency for Healthcare Research and Quality (AHRQ). The
study found that insurers paid an additional $28,218 (52 percent more) and an additional
$19,480 (48 percent more) for surgery patients who experienced acute respiratory failure or
post-operative infections, respectively, compared with patients who did not experience either
error. The authors also found these additional costs for surgery patients who experienced the
following medical errors compared with those who did not:

    •   Nursing care associated with avoidable errors, including pressure ulcers and hip
        fractures—$12,196 (33 percent more).
    •   Metabolic problems associated with medical errors, including kidney failure or
        uncontrolled blood sugar—$11,797 (32 percent more).
    •   Blood clots or other vascular or pulmonary problems associated with avoidable
        errors—$7,838 (25 percent more).
    •   Wound opening associated with avoidable errors—$1,426 (6 percent more).

The study also found that 1 of every 10 patients who died within 90 days of surgery did so
because of a preventable error, and that one-third of the deaths occurred after the initial
hospital discharge. The study was based on a nationwide sample of more than 161,000 patients,
age 18 to 64, in employer-based health plans who underwent surgery between 2001 and 2002.

Causes of Medication Errors:

Drug interaction kills 180,000 people per year and injures up to 1,000,000 according to Eileen G.
Holland, Pharm D. This leads to employers paying an estimated cost of more than $136 billion a
year. And these numbers are increasing every year.

Something as simple as the pharmacist not being able to read the physician’s handwriting
correctly can lead to disaster. The patient needs to read the prescription and confirm what it is,
and what it is supposed to do, before leaving the doctor’s office.

People with kidney conditions, liver conditions, or known drug allergies were at the greatest
risk.

                      © 2009 Keith Center, Karen Mehl, Don Barker. All rights reserved.
                     May not be duplicated, reproduced or retransmitted without permission
                             www.masonbiz.com www.healthservicereview.com
                                                                                                21
Reducing Company Health Cost – Draft 3
An Institute of Medicine report cites the following factors as causal in medication errors:

    Failure to alter a medication or dosage due to patient's reduced kidney or liver function
    (13.9%)
    A known allergy to same medication class (12.1%)
    Using the wrong drug name, dosage form, or abbreviation (11.4%)
    Incorrect dosage calculations (11.1%)
    Atypical or unusual and critical dosage frequency considerations (10.8%)

Data indicates the greatest risk in prescription errors is from the doctor rather than the
pharmacist, with estimates as follows:

    Prescribing errors (68%)
    Administration errors (25%)
    Supply errors (7%)


The bottom line: Health care is complex and scary, you need a knowledgeable,
caring, friend who can guide you through the maze. That’s what we at HSR do
every day.


                     © 2009 Keith Center, Karen Mehl, Don Barker. All rights reserved.
                    May not be duplicated, reproduced or retransmitted without permission
                            www.masonbiz.com www.healthservicereview.com
                                                                                                22
Reducing Company Health Cost – Draft 3


                       Module II

   Three Actions to Reduce

      Company Health Cost


  © 2009 Keith Center, Karen Mehl, Don Barker. All rights reserved.
 May not be duplicated, reproduced or retransmitted without permission
         www.masonbiz.com www.healthservicereview.com
                                                                         23
Reducing Company Health Cost – Draft 3


  © 2009 Keith Center, Karen Mehl, Don Barker. All rights reserved.
 May not be duplicated, reproduced or retransmitted without permission
         www.masonbiz.com www.healthservicereview.com
                                                                         24
Reducing Company Health Cost – Draft 3

Chapter Four
Which Key Performance Indicators to Use?
As documented earlier, the primary issues are quality, cost and availability of service. According
to Midwest Business Group, poor quality health care results in $2,000 annual cost to employers
per insured worker. So if you have 1,000 employees, the result is $2,000,000 additional annual
cost due to poor quality.

There is a balance between employee quality of life and the cost involved. The best
quality health care, at the earliest point of intervention, will ultimately result in the
lowest cost.

Figure 10: Health Care Balance

                                                                                            Healthcare Cost

    Employee Wellbeing
                                                      .


                                                                   U.
                                                      M


                                                                      R.
                                                   C.


                                                          TPA
                                                       Disease
                                                     Management


C.M. is Case Management, U.R. is Utilization Review, TPA is the Third Party Administrator


What makes medicine complex is the number of players in it. These can be divided into two
categories. First there are providers of health care - hospitals, physicians, allied medical
professionals. Second there are insurance professionals. - Brokers, Insurance Providers, Third
Party Administrators and Preferred Provider Organizations.


Just as you would develop measurements and a scorecard to run various elements
of your business, you can also develop one for your health care plan. We will take
you through the process of identifying the health care Key Performance Indicators
(KPI’s) and how to get them.


                            © 2009 Keith Center, Karen Mehl, Don Barker. All rights reserved.
                           May not be duplicated, reproduced or retransmitted without permission
                                   www.masonbiz.com www.healthservicereview.com
                                                                                                              25
Reducing Company Health Cost – Draft 3

Setting Up Your Medical Management Dashboard
In order to control costs for any area of business it is necessary to convert those vital few
critical success factors into Key Performance Indicators (KPI’s). Managing your company’s
health care cost is no different.

Step One: Predictive Modeling
Start with a baseline for your employees and their families. By this we mean, do an
advanced health assessment of your employees by using advanced predictive modeling
software. The insurance company, or medical management company, should have
access to this type of software.

The benefit to the employer is that this software will forecast potential cost impacts to
the health plan.

The way that this works is artificial intelligence software is utilized to assess the past
two years of medical records and predict candidates for…

        1. Health Promotion, or “Keeping low risk people healthy”*
        2. Condition Management – “Just don’t get worse”*
        3. Medical care management for advanced cases using Case Management,
           Disease Management and Utilization Review.
                                             *Dee Edington, University of Michigan


Although most insurance carriers claim to use software of this nature, few have the
trained staff to accurately set up the scripts to clearly identify the majority of people
who are at risk. Also, there is a great variation in the predictive modeling software
available today.


Step Two: The True Key Performance Indicators

KPI 1: Utilization Review
This compares the request for medical services, or utilization, to treatment guidelines.

The Key Performance Indicator for Utilization Review is Patient Days per 1,000. Utilization
Review combines the Admissions Rate per 1,000 with Length of Stay per 1,000 to give a true
indicator of hospital usage by patients. i.e. by employees and their dependents.

This KPI is designed to control the use of acute care services. Inpatient stays are pre-certified,
hospital stays are reviewed, and alerts for Case Management are generated in order to ensure
the right care for quality of life. As a result, cost is also reduced by providing the right care at
the right time.

It’s more than watching the numbers. Done right, it is the monitoring of the treatment plan, and
the patient’s compliance to their plan, that produces results.

In our experience, by treating patients like family members, the quality of life for the patient is
improved and the byproduct is reduced cost impact to the health plan.

                      © 2009 Keith Center, Karen Mehl, Don Barker. All rights reserved.
                     May not be duplicated, reproduced or retransmitted without permission
                             www.masonbiz.com www.healthservicereview.com
                                                                                                      26
Reducing Company Health Cost – Draft 3
KPI 2: Case Management
The Key Performance Indicator for Case Management (CM) is savings derived by
managing the patient. The savings derived by Case Management is divided by the cost of
that patient’s specific case. A typical return is a ratio of 10:1, or $10 in savings for every
$1 spent on CM.

                                                         Total Savings
            Case Management (CM)             =         ______________

                                                       Total Cost of Case

Case Management is used when patient’s condition is severe, and as a result has the
potential for a significant expenditure of health care plan dollars.

The objective of medical case management is to evaluate the patient’s medical condition
and develop and implement health care planning for the patient that coordinates medical
resources communicates with the patient and monitors the patient’s progress.

When done correctly, the result is improved patient health and healing. When
combined with predictive modeling, “actuarial events” can be avoided and therefore
costs to the plan are reduced while increasing patient’s quality of life.

KPI 3: Disease Management
The Key Performance Indicator for Disease Management (DM) is once again, Return on
Investment.
                                               Total Savings
            Disease Management (DM)      = ______________

                                                       Total Cost of Case

A good program can produce a return of anywhere from 3:1 to 6:1. This variation in
ROI is due to whether on not, a Wellness Program is integrated into DM.

The objective of disease management is to improve the quality of life and cost of
management of the most prevalent and major cost diseases.

The main idea behind a disease management program is to focus on a set of chronic
illnesses that are most amenable to management control. Some chronic diseases that
lend themselves to cost management are as follows.
        Asthma
        COPD
        Diabetes
        Hypertension
        Hyperlipidemia (high cholesterol)
        Coronary Artery Disease
        Congestive Heart Failure
        Coronary Vascular Disease
        Obesity

                      © 2009 Keith Center, Karen Mehl, Don Barker. All rights reserved.
                     May not be duplicated, reproduced or retransmitted without permission
                             www.masonbiz.com www.healthservicereview.com
                                                                                                 27
Reducing Company Health Cost – Draft 3
Medical management companies may monitor different diseases, but these are the most
common in our opinion.

A strong emphasis is must be placed on preventative care. As an employer, make sure
that your employees are getting regular screenings, tests, such as PSA’s mammograms,
colon cancer, diabetes, blood pressure, etc. to ensure that they are in the low risk
category.


KPI 4: Cost Per Member Per Month
The last Key Performance Indicator is the one that almost all employers are tuned into,
the Cost Per Member Per Month (PMPM).

This KPI is actually the result of monitoring and managing the other KPI’s.

The Cost per member per month is usually provided by the insurance provider.

In our dashboard both health care plan PMPM and pharmaceutical PMPM are one
consolidated number representing the total cost per member per month.


The Medical Management Dashboard
The following table shows how the above mentioned KPI’s work together, and
compares HSR’s key metrics for all clients to the U.S. average.

        Table 1: Medical Management Dashboard

                                                                            Performance
                         Metrics
                                                               U.S.       HSR         HSR improvement
                                                                                       over US average
                     Admissions / 1000                          62         48                22.6%
    Utilization
                     Days / 1000                               252       187.2               25.7%
    Review
                     Length per stay                            4.1       3.9                4.9%

    Case Management                                            10:1       30:1               300%

    Disease management                                          3:1       5:1

    Health Care spend pmpm*                                   $289       $225                22.1%

        *pmpm = Cost per member per month


These metrics form the dashboard for measuring medical management performance. And as
stated earlier, medical management is a major opportunity for mitigation of cost to any health
plan.


                      © 2009 Keith Center, Karen Mehl, Don Barker. All rights reserved.
                     May not be duplicated, reproduced or retransmitted without permission
                             www.masonbiz.com www.healthservicereview.com
                                                                                                         28
Reducing Company Health Cost – Draft 3
When large Case Management with Predictive Modeling, Utilization Review and Disease
Management are combined, the result is a substantial cost control benefit to the employer.

Use this dashboard to compare to how your plan is performing today.

Your broker should be able to provide you with the data for each of these metrics.


                     © 2009 Keith Center, Karen Mehl, Don Barker. All rights reserved.
                    May not be duplicated, reproduced or retransmitted without permission
                            www.masonbiz.com www.healthservicereview.com
                                                                                             29
Reducing Company Health Cost – Draft 3


  © 2009 Keith Center, Karen Mehl, Don Barker. All rights reserved.
 May not be duplicated, reproduced or retransmitted without permission
         www.masonbiz.com www.healthservicereview.com
                                                                         30
Reducing Company Health Cost – Draft 3

Chapter Five
What to Do to Get Key Players Accountable?
The information in your medical management dashboard will enable you to manage your health
care spend and hold the different players accountable.

Hospitals are the place where major costs occur, but the employer cannot manage hospital
costs directly. However, by getting the KPI’s from the Insurance provider, the Preferred
Provider Organization and the Insurance Broker, you can start to get control of costs.

In this chapter, we will cover the key players and how to hold them accountable.


Health Insurance Provider
Employers Should Ask Insurance Providers:
       What are the hospital admissions per thousand?
       What are the hospital stay days per thousand?
       What is the average length of time per stay in days?
       What is my company’s health care spend per employee, per month?
       What is the ROI for Case Management?

Case Management is particularly important because that is where the majority of the
cost of health care comes from.

By tracking over time the actual health care spend per employee per month, you can
see the trend toward increasing cost, or lowering cost.

Also, armed with these metrics, you can use them to negotiate annual renewals or new
contracts with insurance providers.

If and you and your employees have used the dashboard to measure the spend on health care,
and your health care insurance provider increases the cost the following year, you should
demand an explanation.


Predictable Spend Model
In addition to the above metrics, consider negotiating a three year plan with your health
care insurance provider using existing health care strategists, underwriters and
predictive modeling software. This will result in a plan that provides the health care
needs of your business over a predictable, three year timeframe.

Renegotiation points could also be established so the cost could be smoothed out over
a longer timeframe.


This chart shows an example of the impact of implementing all the previous steps.
                     © 2009 Keith Center, Karen Mehl, Don Barker. All rights reserved.
                    May not be duplicated, reproduced or retransmitted without permission
                            www.masonbiz.com www.healthservicereview.com
                                                                                             31
Reducing Company Health Cost – Draft 3

Figure 11: Flattening Health Care Costs


Initially this plan had a higher cost than the U.S. average. But through use of predictive
modeling, the dashboard, and a predictable spend payment schedule, rising health plan
costs were quickly brought under control. Note that the slight increase after the third
year is dramatically below the U.S. average.

Hospitals
We have already identified two basic KPI’s for hospitals, a quality rating determined by infection
rates, mortality rates, etc., and also cost.

There are a number of sources for quality measurements. Most states have agencies that track
hospital quality. Many of these are listed on the Useful Internet Links section.

The other Key Performance Indicator is a little harder to get, and that is cost. Hospitals are not
very transparent with respect to cost and most do not reveal the cost until they present the
patient with a bill.

The ideal situation, is to know what they cost before your employee goes there.

If you know the relative cost of hospitals where your employees are located, you can let them
know in advance which hospitals are going to cost them the least, balanced with quality
measurements. Once again, the Insurance Provider, the Preferred Provider Organization or the
Insurance Broker should be able to provide you with this information.

Of course, if the hospital costs the employee less, then the impact on the health care plan is also
less.


                      © 2009 Keith Center, Karen Mehl, Don Barker. All rights reserved.
                     May not be duplicated, reproduced or retransmitted without permission
                             www.masonbiz.com www.healthservicereview.com
                                                                                                32
Reducing Company Health Cost – Draft 3

Medical Billing

According to Kenneth W. Harvey, 80% to 90% of all hospital bills are incorrect. This impacts
the patient’s out of pocket costs, and ultimately what you as the employer, pay for health care
insurance.
                White Paper By Kenneth W. Harvey, Corporate Benefit Services, Inc., May 2006

If your company is self funded, your Third Party Administrator (TPA) should be getting audits
done in order to reduce cost to themselves, as well as to you as their client.

Employers Should Ask Their Insurance Provider:
       Which providers (hospitals, physicians, ambulatory care facilities, etc.) do your
       employees use the most?
           - Rank provider by the frequency of use
           - Total cost by provider
           - Cost/frequency ratio
       What are the results of your audits for the hospitals my people primarily use? The
       three areas of audit are quality, cost and billing accuracy?


So Where Do I Get These Two Measurements?

You should be able to get this information from your health insurance provider, or broker. And
ask how you can know if the numbers give a fair and accurate comparison.

The broker has access to this information via the PPO. If the broker doesn’t know how to ask
for the comparative information and get it, then perhaps you need a broker.

The PPO, Preferred Provider Organization: It’s their job to track costs, but they may refuse to
give the data to you. In any case, it is reasonable to expect to get the data from your insurance
provider.


Other Ways to Get Hospital Cost and Quality Comparisons

A good website that we’ve found gives both quality and cost metrics is www.leapfrog.org. This
is a non-profit organization that tracks quality and cost. It is mostly funded by insurance
providers. However, there is no incentive for hospitals to participate by providing cost metrics.
Although the list of hospitals reporting cost is growing, there are relatively few hospitals
providing this data in some areas.


                     © 2009 Keith Center, Karen Mehl, Don Barker. All rights reserved.
                    May not be duplicated, reproduced or retransmitted without permission
                            www.masonbiz.com www.healthservicereview.com
                                                                                                  33
Reducing Company Health Cost – Draft 3

Preferred Provider Organization (PPO)

Employers Should Ask PPO’s:
       List the hospitals in the PPO network?
       What are the relative costs for each hospital and how are they measured?
       What are the consumers saying?
       What is their technical quality like?
       What are their specialties?

The role of the PPO, Preferred Provider Organization, is to negotiate discounts with providers -
physicians, hospitals, and other allied medical professionals. These reduced rates are given to
the insurer's or administrator's clients.

        Table 2: Typical Rates:

         Health Care Category                Company Avg. PPO Discount

         Physician                                         20% to 50%

         Hospital Inpatient                                17% to 50%

         Hospital Outpatient                               15% to 45%

         Hospital ER                                       15% to 35%


Note that the discount rate becomes meaningless if there is a great disparity in the actual pricing
of the hospital network.

The discount rates may look good, but are they really?

To illustrate this point, let’s look at an example of four hospitals within the same county. A
“market basket” sample of 10 outpatient procedures (including surgeries), was put together and
the hospitals asked to provide total costs. The results are shown in the table below.

        Table 3: Hospital Cost Comparison

        Hospital              Average Outpatient Procedure Cost

            A                                    $1,800

            B                                    $1,900

            C                                    $3,800

            D                                    $5,800


As can be seen, the variance in the average cost is rather dramatic. The highest cost hospital is
three times the cost of the lowest. These hospitals were all approved by the same PPO, so if
                        © 2009 Keith Center, Karen Mehl, Don Barker. All rights reserved.
                       May not be duplicated, reproduced or retransmitted without permission
                               www.masonbiz.com www.healthservicereview.com
                                                                                                34
Reducing Company Health Cost – Draft 3
your employee was to call the PPO they would be told that the hospital is in the network and
their health plan would apply.

Assume for the moment that all have the same quality. If your employees decided to go to
Hospital D because it is closer, or their physician wanted to do the surgery at Hospital D
because they practice at that hospital.

Even if your employees stay within the network, you pay more for the health care plan and your
employees are paying more out of pocket. You both take a big hit, in this case an additional
$4,000 for the average cost.

Repeat this often enough and it’s no wonder that your health plan increases dramatically every
year.

It is quality, cost and availability that are important. And an educated employee will make the
best decision for their family’s health care based on quality of the care, then out of pocket cost.

Even if the PPO includes all hospitals, the patient, needs to be made aware of what their out of
pocket would be for each hospital so they can make an informed decision.

An educated employee who knows they are not sacrificing quality by getting a lower cost
service will purchase from Hospital A, or B, not the high cost Hospital D.


Quality
There are two primary quality rating systems that one should be aware of.
           1. Consumer ratings, or customer satisfaction reports
           2. Technical quality, or clinical performance measures

Consumer Ratings: One of the better sources of consumer ratings is Consumer Assessment of
Health Plans (CAHPS). There are many other surveys based on this.

Technical Quality: In this area the Health Plan Employer Data and Information Set
(HEDIS) looks at how well a health care organization prevents and treats illness. It also includes
questions from the CAHPS survey mentioned above.


What to Do to Get Your Broker Working For You
Most businesses insure their health plan through a broker that acts as a consultant on health
care insurance or a sales rep working for a health care insurance company. These people have
the objective to be perceived as the trusted advisor in all insurance matters.

They make commission from the sale of policies and benefit from increases in insurance
premiums, the overall cost that they add in the grand scheme of health care is not that great,
but to the individual small business owner it could represent a sizeable chunk of cost.

For this reason, there is a current trend in business for companies to put their broker on a flat
fee basis. In this way there is a predictable cost. Also, the broker enhances their position as a
trusted advisor on health care insurance products.
                      © 2009 Keith Center, Karen Mehl, Don Barker. All rights reserved.
                     May not be duplicated, reproduced or retransmitted without permission
                             www.masonbiz.com www.healthservicereview.com
                                                                                                 35
Reducing Company Health Cost – Draft 3

Employers Should Ask Brokers:
       Who are the PPO’s and HMO’s? In other words, the options.
       What are the best health plans in this area and why?
       Which hospitals are in / not in the network?
       Provide relative cost data for each hospital
       Provide relative quality data for each hospital
       Rank them according to how they do at keeping people well and getting them better.
       What is the case management ratio of dollars spent to dollars saved by each PPO or
       HMO?

Third Party Administrator (TPA)
TPA’s are one of the best kept secrets in the country. Many people do not know TPA
firms exist…yet about 2/3 of all employee benefit plans in the U.S. use some kind of
TPA out-sourcing services. Personalized service is the key to TPAs’ success.

A third party administrator (TPA) is an organization that processes insurance claims or
certain aspects of employee benefit plans for a company or union. This can be viewed
as “outsourcing” the administration of the claims processing, since the TPA is
performing a task traditionally handled by the company providing the insurance or the
company itself. Often, in the case of insurance claims, a TPA handles the claims
processing for an employer that self-insures its employees. Thus, the employer is acting
as an insurance company and underwrites the risk. The risk of loss remains with the
employer, and not with the TPA. The employer may also contract with a reinsurer to
pay amounts in excess of a certain threshold, in order to share the risk for potential
catastrophic claims.

Third party administrators are prominent players in the managed care industry and have
the expertise and capability to administer all or a portion of the claims process. They
are normally contracted by a health insurer or self-insuring companies to administer
services, including claims administration, premium collection, enrollment and other
administrative activities.

TPA’s have a relationship with their clients much like that of their sister professions
CPA and law firms. Too many people wrongly think of TPA’s being like the insurance
industry. Instead, the relationship resembles that between an employer or plan and
their independent CPA firm or outside law firm with retainer. In both cases….like the
relationship between TPA’s and their clients….the service is on an ongoing,
personalized closely-involved, long term basis. The difference between TPA’s and
consulting firms is that the TPA provides a variety of services to the whole plan +
implements it + operates it on an on-going basis. Obviously, the TPA does lots of
consulting in this process.

TPA’s are especially known for their responsiveness and close personalized service to
client plans and participants. This means that claims are usually processed and finalized

                    © 2009 Keith Center, Karen Mehl, Don Barker. All rights reserved.
                   May not be duplicated, reproduced or retransmitted without permission
                           www.masonbiz.com www.healthservicereview.com
                                                                                            36
Reducing Company Health Cost – Draft 3

in shorter periods of time, questions are handled promptly, and plans can be adapted as
the wants and needs of the client plan change.

A related advantage of the flexibility and personalized service of TPA’s comes in the area
of efficiency and cost-containment. The personalized (and often geographically close)
service from TPA’s tends to spot obvious errors or abuses (such as everyone who goes
to Dr. X ends up getting some untraceable diagnosis, like an appendectomy, no matter
what the original ailment might have been). It also means that a senior person of that
TPA firm is readily available to cut red tape to help an employer or patient get things
straightened out, or brain-storm about other options.

Finally, I would attribute much of the success of the TPA business to the spirit of the
people. It is still a fresh and dynamic industry. TPA’s and self-funding are not widely
known and understood.

For all these reasons, SPBA TPA’s attract a special niche of employers. They have
roughly 75 to 4,000 workers. At this size, it means that the boss tends to see the
workers often in the parking lot, or in town, or at church or at the PTA. The boss
tends to have a caring & protective feeling towards the employees and plan design.

The future for TPA’s is bright. Their flexibility, adaptability, compact management, low
overhead and entrepreneur-like spirit mean that they can roll with the punches (and
usually prosper from them). TPA’s are also perfectly positioned to maximize the rise in
new innovations of health plans, which are usually very eager to have cost-effective
administrative expertise.


                    © 2009 Keith Center, Karen Mehl, Don Barker. All rights reserved.
                   May not be duplicated, reproduced or retransmitted without permission
                           www.masonbiz.com www.healthservicereview.com
                                                                                           37
Reducing Company Health Cost – Draft 3


  © 2009 Keith Center, Karen Mehl, Don Barker. All rights reserved.
 May not be duplicated, reproduced or retransmitted without permission
         www.masonbiz.com www.healthservicereview.com
                                                                         38
Reducing Company Health Cost – Draft 3

Chapter Six
Empower Your Employees to Reduce Cost
When patients become educated consumers their cost to the health plan becomes
lower. Also, out of pocket costs to the employee are reduced.

For these reasons, we recommend that your employees seek guidance from the health
plan administrator in making decisions. They will also get better educated on their
condition, what protocols they should be receive. The plan administrator will also
provide a double check on the medication to ensure that the right prescription has been
filled.

What follows are ideas for both the patient and the employer for increasing quality of
health care. As a result, this will reduce the cost and ensure that they are getting the
right health care at the right time.


Medication Errors
Something as simple as the pharmacist not being able to read the physician’s handwriting
correctly can lead to disaster. The patient needs to read the prescription, confirm what it is,
and what it is supposed to do, before leaving the doctor’s office.


Causes of medication errors:

People with kidney conditions, liver conditions, or known drug allergies were at the greatest
risk. An Institute of Medicine report cites the following factors as causal in medication errors:

    Failure to alter a medication, or dosage, due to a patient's reduced kidney or liver function
    (13.9%)
    Known allergy to same medication class (12.1%)
    Using the wrong drug name, dosage form, or abbreviation (11.4%)
    Incorrect dosage calculations (11.1%)
    Atypical or unusual and critical dosage frequency considerations (10.8%)

Data indicates the greatest risk in prescription errors is from the doctor rather than the
pharmacist, with estimates as follows:

    Prescribing errors (68%)
    Administration errors (25%)
    Supply errors (7%)


                     © 2009 Keith Center, Karen Mehl, Don Barker. All rights reserved.
                    May not be duplicated, reproduced or retransmitted without permission
                            www.masonbiz.com www.healthservicereview.com
                                                                                                    39
Reducing Company Health Cost – Draft 3

Choosing a hospital
Patients Should Ask:
        Which hospital has the best care for my condition?
        Is this hospital covered by my health insurance?
        Does the hospital meet national quality standards?
        How does the hospital compare with others in my area?
        Has the hospital had success with my condition?
        Does my clinician have privileges (is allowed to work) at this hospital?
        How well does the hospital check and improve on its own quality of care?

Physician
How to find a good quality physician/clinician? When it comes to specialists your employees
really need to seek guidance. As mentioned before, “Rule Out Medicine” wastes the patient’s
time and money and also burns through health plan funding, driving up annual costs.

Patients Should Ask:
        Is this clinician part of my health plan?
        Does this clinician have the background and training I need?
        Is this clinician able to work at the hospital I like?
        Can I talk to this clinician and ask questions easily?
        Does this clinician listen to me?
        Does this clinician wash his or her hands between examining each patient?

This last question may seem a little odd. However, according to a University of Geneva study
cited in the Annals of Internal Medicine, 61% of doctors wash their hands before examining a
patient if they know someone is watching, and only 44% wash their hands if they think no one is
watching. If the clinicians are not good examples with hand washing then this sets the tone for
others who care for patients, further contributing to infection rates. Considering that infection
is the number one cause of death in hospitals, this becomes a very important question.

Note: Chapter Six has a series of questions that patients and their families need to be aware
of when discussing treatment with a physician. The list of questions was developed by the U.S.
Department of Health and Human Services, Agency for Healthcare Research and Quality (AHRQ). It
covers the following areas.

        Did your clinician give you a prescription?
        Are you scheduled to have medical tests?
        Did you recently receive a diagnosis?
        Are you considering treatment for an illness or condition?
        Did your clinician recently recommend surgery?
        Are you choosing a health plan?
        Are you choosing a clinician?
        Are you choosing a hospital?
        Are you choosing long-term care?

Please see Chapter Six for more detailed information on preparing your employees for a
medical appointment.
                     © 2009 Keith Center, Karen Mehl, Don Barker. All rights reserved.
                    May not be duplicated, reproduced or retransmitted without permission
                            www.masonbiz.com www.healthservicereview.com
                                                                                               40
Reducing Company Health Cost – Draft 3

Five Steps to Safer Health Care
Patient Fact Sheet


Patient safety is one of the Nation's most pressing health care challenges. A 1999 report by the
Institute of Medicine estimates that as many as 44,000 to 98,000 people die in U.S. hospitals
each year as the result of lapses in patient safety. In 2001 through 2003 a study of 37 Million
patient records by HealthGrades showed that the number is more like 195,000 deaths per year
due to potentially preventable, in-hospital medical events.

This fact sheet tells what you can do to get safer health care. It was developed by the U.S.
Department of Health and Human Services in partnership with the American Hospital
Association and the American Medical Association.


1. Ask questions if you have doubts or concerns. Ask questions and make sure you
understand the answers. Choose a doctor you feel comfortable talking to. Take a relative or
friend with you to help you ask questions and understand the answers.

2. Keep and bring a list of ALL the medicines you take. Give your doctor and
pharmacist a list of all the medicines that you take, including non-prescription medicines. Tell
them about any drug allergies you have. Ask about side effects and what to avoid while taking
the medicine. Read the label when you get your medicine, including all warnings. Make sure your
medicine is what the doctor ordered and know how to use it. Ask the pharmacist about your
medicine if it looks different than you expected.

3. Get the results of any test or procedure. Ask when and how you will get the results of
tests or procedures. Don't assume the results are fine if you do not get them when expected,
be it in person, by phone, or by mail. Call your doctor and ask for your results. Ask what the
results mean for your care.

4. Talk to your doctor about which hospital is best for your health needs. Ask your
doctor about which hospital has the best care and results for your condition if you have more
than one hospital to choose from. Be sure you understand the instructions you get about follow
up care when you leave the hospital.

5. Make sure you understand what will happen if you need surgery. Make sure you,
your doctor, and your surgeon all agree on exactly what will be done during the operation. Ask
your doctor, "Who will manage my care when I am in the hospital?" Ask your surgeon:

        Exactly what will you be doing?
        About how long will it take?
        What will happen after the surgery?
        How can I expect to feel during recovery?

Tell the surgeon, anesthesiologist, and nurses about any allergies, bad reaction to anesthesia, and
any medications you are taking.
                     © 2009 Keith Center, Karen Mehl, Don Barker. All rights reserved.
                    May not be duplicated, reproduced or retransmitted without permission
                            www.masonbiz.com www.healthservicereview.com
                                                                                                41
Reducing Company Health Cost – Draft 3

More Information

For more information, go to: http://www.ahrq.gov/questionsaretheanswer

Source:
U.S. Department of Health and Human Services, AHRQ Agency for Healthcare Research and
Quality www.ahrq.gov


                    © 2009 Keith Center, Karen Mehl, Don Barker. All rights reserved.
                   May not be duplicated, reproduced or retransmitted without permission
                           www.masonbiz.com www.healthservicereview.com
                                                                                           42
Reducing Company Health Cost – Draft 3

20 Tips to Help Prevent Medical Errors
Patient Fact Sheet


Medical errors are one of the Nation's leading causes of death and injury. A recent report by
the Institute of Medicine estimates that as many as 44,000 to 98,000 people die in U.S. hospitals
each year as the result of medical errors. This means that more people die from medical errors
than from motor vehicle accidents, breast cancer, or AIDS.

Government agencies, purchasers of group health care, and health care providers are working
together to make the U.S. health care system safer for patients and the public. This fact sheet
tells what you can do.


What are Medical Errors?
Medical errors happen when something that was planned as a part of medical care doesn't work
out, or when the wrong plan was used in the first place. Medical errors can occur anywhere in
the health care system:

    •   Hospitals.
    •   Clinics.
    •   Outpatient Surgery Centers.
    •   Doctors' Offices.
    •   Nursing Homes.
    •   Pharmacies.
    •   Patients' Homes.

Errors can involve:
        Medicines.
        Surgery.
        Diagnosis.
        Equipment.
        Lab reports.

They can happen during even the most routine tasks, such as when a hospital patient on a salt-
free diet is given a high-salt meal.

Most errors result from problems created by today's complex health care system. But errors
also happen when doctors and their patients have problems communicating. For example, a
recent study supported by the Agency for Healthcare Research and Quality (AHRQ) found that
doctors often do not do enough to help their patients make informed decisions. Uninvolved and
uninformed patients are less likely to accept the doctor's choice of treatment and less likely to
do what they need to do to make the treatment work.

                        © 2009 Keith Center, Karen Mehl, Don Barker. All rights reserved.
                       May not be duplicated, reproduced or retransmitted without permission
                               www.masonbiz.com www.healthservicereview.com
                                                                                                  43
Reducing Company Health Cost – Draft 3

What Can You Do? Be Involved in Your Health Care
1. The single most important way you can help to prevent errors is to be an active
member of your health care team.

That means taking part in every decision about your health care. Research shows that patients
who are more involved with their care tend to get better results. Some specific tips, based on
the latest scientific evidence about what works best, follow.

Medicines
2. Make sure that all of your doctors know about everything you are taking. This
includes prescription and over-the-counter medicines, and dietary supplements
such as vitamins and herbs.

At least once a year, bring all of your medicines and supplements with you to your doctor.
"Brown bagging" your medicines can help you and your doctor talk about them and find out if
there are any problems. It can also help your doctor keep your records up to date, which can
help you get better quality care.

3. Make sure your doctor knows about any allergies and adverse reactions you
have had to medicines.

This can help you avoid getting a medicine that can harm you.

4. When your doctor writes you a prescription, make sure you can read it.

If you can't read your doctor's handwriting, your pharmacist might not be able to either.

5. Ask for information about your medicines in terms you can understand—both
when your medicines are prescribed and when you receive them.

    •   What is the medicine for?
    •   How am I supposed to take it, and for how long?
    •   What side effects are likely? What do I do if they occur?
    •   Is this medicine safe to take with other medicines or dietary supplements I am taking?
    •   What food, drink, or activities should I avoid while taking this medicine?

6. When you pick up your medicine from the pharmacy, ask: “Is this the medicine
that my doctor prescribed?”

A study by the Massachusetts College of Pharmacy and Allied Health Sciences found that 88
percent of medicine errors involved the wrong drug or the wrong dose.

7. If you have any questions about the directions on your medicine labels, ask.

Medicine labels can be hard to understand. For example, ask if "four doses daily" means taking a
dose every 6 hours around the clock or just during regular waking hours.
                     © 2009 Keith Center, Karen Mehl, Don Barker. All rights reserved.
                    May not be duplicated, reproduced or retransmitted without permission
                            www.masonbiz.com www.healthservicereview.com
                                                                                                 44
Reducing Company Health Cost – Draft 3
8. Ask your pharmacist for the best device to measure your liquid medicine. Also,
ask questions if you're not sure how to use it.

Research shows that many people do not understand the right way to measure liquid medicines.
For example, many use household teaspoons, which often do not hold a true teaspoon of liquid.
Special devices, like marked syringes, help people to measure the right dose. Being told how to
use the devices helps even more.

9. Ask for written information about the side effects your medicine could cause.

If you know what might happen, you will be better prepared if it does—or, if something
unexpected happens instead. That way, you can report the problem right away and get help
before it gets worse. A study found that written information about medicines can help patients
recognize problem side effects and then give that information to their doctor or pharmacist.

Hospital Stays

10. If you have a choice, choose a hospital at which many patients have the
procedure or surgery you need.

Research shows that patients tend to have better results when they are treated in hospitals that
have a great deal of experience with their condition.

11. If you are in a hospital, consider asking all health care workers who have direct
contact with you whether they have washed their hands.

Hand washing is an important way to prevent the spread of infections in hospitals. Yet, it is not
done regularly or thoroughly enough. A recent study found that when patients checked whether
health care workers washed their hands, the workers washed their hands more often and used
more soap.

12. When you are being discharged from the hospital, ask your doctor to explain
the treatment plan you will use at home.

This includes learning about your medicines and finding out when you can get back to your
regular activities. Research shows that at discharge time, doctors think their patients understand
more than they really do about what they should or should not do when they return home.

Surgery

13. If you are having surgery, make sure that you, your doctor, and your surgeon
all agree and are clear on exactly what will be done.

Doing surgery at the wrong site (for example, operating on the left knee instead of the right) is
rare. But even once is too often. The good news is that wrong-site surgery is 100 percent
preventable. The American Academy of Orthopaedic Surgeons urges its members to sign their
initials directly on the site to be operated on before the surgery.


                     © 2009 Keith Center, Karen Mehl, Don Barker. All rights reserved.
                    May not be duplicated, reproduced or retransmitted without permission
                            www.masonbiz.com www.healthservicereview.com
                                                                                                45
Reducing Company Health Cost

More Related Content

What's hot

About Cypress Benefit Administrators
About Cypress Benefit AdministratorsAbout Cypress Benefit Administrators
About Cypress Benefit Administratorsjustinhorn
 
Maine HR Summit 2010- Rules for Wellness Programs
Maine HR Summit 2010- Rules for Wellness ProgramsMaine HR Summit 2010- Rules for Wellness Programs
Maine HR Summit 2010- Rules for Wellness ProgramsDenise Dumont-Bernier
 
CFMA Obesity Costs 2015
CFMA Obesity Costs 2015CFMA Obesity Costs 2015
CFMA Obesity Costs 2015Nils Sorenson
 
What Veterinarians Can Learn From Physician Practice Models
What Veterinarians Can Learn From Physician Practice ModelsWhat Veterinarians Can Learn From Physician Practice Models
What Veterinarians Can Learn From Physician Practice Modelsmjmcgaunn
 
Proven Strategies for Tackling Health Care Cost
Proven Strategies for Tackling Health Care CostProven Strategies for Tackling Health Care Cost
Proven Strategies for Tackling Health Care CostDigital Measures
 
Structure of us healthcare
Structure of us healthcareStructure of us healthcare
Structure of us healthcarePhilip Corsano
 
Broker & Consultant Disclosure Standards for Health & Welfare Plans
Broker & Consultant Disclosure Standards for Health & Welfare PlansBroker & Consultant Disclosure Standards for Health & Welfare Plans
Broker & Consultant Disclosure Standards for Health & Welfare PlansDave Chase
 
Prime Care Presentation
Prime Care PresentationPrime Care Presentation
Prime Care PresentationJohn Lore
 
TenetQ306PreparedRemarks1
TenetQ306PreparedRemarks1TenetQ306PreparedRemarks1
TenetQ306PreparedRemarks1finance42
 
Wellness Programs and WC_March 2016 (2)
Wellness Programs and WC_March 2016 (2)Wellness Programs and WC_March 2016 (2)
Wellness Programs and WC_March 2016 (2)Dr. Charlie Cartwright
 
Employer Ltc Presentation
Employer Ltc PresentationEmployer Ltc Presentation
Employer Ltc PresentationCAFenton
 
Modern healthcare magazine article 2014
Modern healthcare magazine article 2014Modern healthcare magazine article 2014
Modern healthcare magazine article 2014Healthtrax
 
Servant Leadership Approach to Employee Wellness
Servant Leadership Approach to Employee WellnessServant Leadership Approach to Employee Wellness
Servant Leadership Approach to Employee Wellnessjeffreytabor
 
DPC Overview - Final (long version)
DPC Overview - Final (long version)DPC Overview - Final (long version)
DPC Overview - Final (long version)Dave Chase
 

What's hot (19)

About Cypress Benefit Administrators
About Cypress Benefit AdministratorsAbout Cypress Benefit Administrators
About Cypress Benefit Administrators
 
Maine HR Summit 2010- Rules for Wellness Programs
Maine HR Summit 2010- Rules for Wellness ProgramsMaine HR Summit 2010- Rules for Wellness Programs
Maine HR Summit 2010- Rules for Wellness Programs
 
CFMA Obesity Costs 2015
CFMA Obesity Costs 2015CFMA Obesity Costs 2015
CFMA Obesity Costs 2015
 
What Veterinarians Can Learn From Physician Practice Models
What Veterinarians Can Learn From Physician Practice ModelsWhat Veterinarians Can Learn From Physician Practice Models
What Veterinarians Can Learn From Physician Practice Models
 
Proven Strategies for Tackling Health Care Cost
Proven Strategies for Tackling Health Care CostProven Strategies for Tackling Health Care Cost
Proven Strategies for Tackling Health Care Cost
 
EAP Employee Assistance Programs by Healthepath
EAP Employee Assistance Programs by HealthepathEAP Employee Assistance Programs by Healthepath
EAP Employee Assistance Programs by Healthepath
 
Structure of us healthcare
Structure of us healthcareStructure of us healthcare
Structure of us healthcare
 
KPCO
KPCOKPCO
KPCO
 
Broker & Consultant Disclosure Standards for Health & Welfare Plans
Broker & Consultant Disclosure Standards for Health & Welfare PlansBroker & Consultant Disclosure Standards for Health & Welfare Plans
Broker & Consultant Disclosure Standards for Health & Welfare Plans
 
IDIC_Health_And_Wellness_Overview
IDIC_Health_And_Wellness_OverviewIDIC_Health_And_Wellness_Overview
IDIC_Health_And_Wellness_Overview
 
SPCR107_Suite
SPCR107_SuiteSPCR107_Suite
SPCR107_Suite
 
Prime Care Presentation
Prime Care PresentationPrime Care Presentation
Prime Care Presentation
 
TenetQ306PreparedRemarks1
TenetQ306PreparedRemarks1TenetQ306PreparedRemarks1
TenetQ306PreparedRemarks1
 
Wellness Programs and WC_March 2016 (2)
Wellness Programs and WC_March 2016 (2)Wellness Programs and WC_March 2016 (2)
Wellness Programs and WC_March 2016 (2)
 
Employer Ltc Presentation
Employer Ltc PresentationEmployer Ltc Presentation
Employer Ltc Presentation
 
Modern healthcare magazine article 2014
Modern healthcare magazine article 2014Modern healthcare magazine article 2014
Modern healthcare magazine article 2014
 
Servant Leadership Approach to Employee Wellness
Servant Leadership Approach to Employee WellnessServant Leadership Approach to Employee Wellness
Servant Leadership Approach to Employee Wellness
 
DPC Overview - Final (long version)
DPC Overview - Final (long version)DPC Overview - Final (long version)
DPC Overview - Final (long version)
 
IDN 101
IDN 101IDN 101
IDN 101
 

Viewers also liked

Application development for mobile phones
Application development for mobile phonesApplication development for mobile phones
Application development for mobile phonesSanjeev Kumar Jaiswal
 
Dyu各學系網站2014招生行銷力提升對策 20140207
Dyu各學系網站2014招生行銷力提升對策 20140207Dyu各學系網站2014招生行銷力提升對策 20140207
Dyu各學系網站2014招生行銷力提升對策 20140207gctarng gctarng
 
Vietnam Real Estate Newsletter - No. 73, Week 2 Mar, 2009
Vietnam Real Estate Newsletter - No. 73, Week 2 Mar, 2009Vietnam Real Estate Newsletter - No. 73, Week 2 Mar, 2009
Vietnam Real Estate Newsletter - No. 73, Week 2 Mar, 2009internationalvr
 
Summary of Digital Archive Package Tools Research and Development Project
Summary of Digital Archive Package Tools Research and Development ProjectSummary of Digital Archive Package Tools Research and Development Project
Summary of Digital Archive Package Tools Research and Development ProjectRachabodin Suwannakanthi
 
43 Things_Heitman-Russakoff
43 Things_Heitman-Russakoff43 Things_Heitman-Russakoff
43 Things_Heitman-Russakoffdboling
 
Triangles lesson
Triangles lessonTriangles lesson
Triangles lessonlandml
 
P161_Vietnam_Economics_Quarter_1_2008
P161_Vietnam_Economics_Quarter_1_2008P161_Vietnam_Economics_Quarter_1_2008
P161_Vietnam_Economics_Quarter_1_2008internationalvr
 
Morgan c psychology-2
Morgan c   psychology-2Morgan c   psychology-2
Morgan c psychology-2Steve Kashdan
 
Benchmark
BenchmarkBenchmark
BenchmarkBloom
 
VietRees_Newsletter_50_Tuan4_Thang09
VietRees_Newsletter_50_Tuan4_Thang09VietRees_Newsletter_50_Tuan4_Thang09
VietRees_Newsletter_50_Tuan4_Thang09internationalvr
 
Om Max Power Of Having A Spritual Friend 1
Om Max   Power Of Having A Spritual Friend 1Om Max   Power Of Having A Spritual Friend 1
Om Max Power Of Having A Spritual Friend 1Bryan Sumendap
 
Marketing 450 Guest Lecture
Marketing 450 Guest LectureMarketing 450 Guest Lecture
Marketing 450 Guest LectureNathan Smith
 
Social Business Conference 2013- From Mahjong Strategy to Social Media
Social Business Conference 2013- From Mahjong Strategy to Social MediaSocial Business Conference 2013- From Mahjong Strategy to Social Media
Social Business Conference 2013- From Mahjong Strategy to Social MediaHKAIM
 

Viewers also liked (20)

Wimax vsWi-fi
Wimax vsWi-fiWimax vsWi-fi
Wimax vsWi-fi
 
Blocks Extensible Exchange Protocol
Blocks Extensible Exchange  ProtocolBlocks Extensible Exchange  Protocol
Blocks Extensible Exchange Protocol
 
Application development for mobile phones
Application development for mobile phonesApplication development for mobile phones
Application development for mobile phones
 
Dyu各學系網站2014招生行銷力提升對策 20140207
Dyu各學系網站2014招生行銷力提升對策 20140207Dyu各學系網站2014招生行銷力提升對策 20140207
Dyu各學系網站2014招生行銷力提升對策 20140207
 
Vietnam Real Estate Newsletter - No. 73, Week 2 Mar, 2009
Vietnam Real Estate Newsletter - No. 73, Week 2 Mar, 2009Vietnam Real Estate Newsletter - No. 73, Week 2 Mar, 2009
Vietnam Real Estate Newsletter - No. 73, Week 2 Mar, 2009
 
Energy multiutility v3
Energy  multiutility v3Energy  multiutility v3
Energy multiutility v3
 
Quantum Teleportation
Quantum TeleportationQuantum Teleportation
Quantum Teleportation
 
Summary of Digital Archive Package Tools Research and Development Project
Summary of Digital Archive Package Tools Research and Development ProjectSummary of Digital Archive Package Tools Research and Development Project
Summary of Digital Archive Package Tools Research and Development Project
 
43 Things_Heitman-Russakoff
43 Things_Heitman-Russakoff43 Things_Heitman-Russakoff
43 Things_Heitman-Russakoff
 
Triangles lesson
Triangles lessonTriangles lesson
Triangles lesson
 
P161_Vietnam_Economics_Quarter_1_2008
P161_Vietnam_Economics_Quarter_1_2008P161_Vietnam_Economics_Quarter_1_2008
P161_Vietnam_Economics_Quarter_1_2008
 
Morgan c psychology-2
Morgan c   psychology-2Morgan c   psychology-2
Morgan c psychology-2
 
Benchmark
BenchmarkBenchmark
Benchmark
 
DrupalCon jQuery
DrupalCon jQueryDrupalCon jQuery
DrupalCon jQuery
 
VietRees_Newsletter_50_Tuan4_Thang09
VietRees_Newsletter_50_Tuan4_Thang09VietRees_Newsletter_50_Tuan4_Thang09
VietRees_Newsletter_50_Tuan4_Thang09
 
Om Max Power Of Having A Spritual Friend 1
Om Max   Power Of Having A Spritual Friend 1Om Max   Power Of Having A Spritual Friend 1
Om Max Power Of Having A Spritual Friend 1
 
Morphological Image Processing
Morphological Image ProcessingMorphological Image Processing
Morphological Image Processing
 
Marketing 450 Guest Lecture
Marketing 450 Guest LectureMarketing 450 Guest Lecture
Marketing 450 Guest Lecture
 
Social Business Conference 2013- From Mahjong Strategy to Social Media
Social Business Conference 2013- From Mahjong Strategy to Social MediaSocial Business Conference 2013- From Mahjong Strategy to Social Media
Social Business Conference 2013- From Mahjong Strategy to Social Media
 
Utility Fog
Utility FogUtility Fog
Utility Fog
 

Similar to Reducing Company Health Cost

Supreme Court Ruling: Implications For The Field Of Health Promotion with Pau...
Supreme Court Ruling: Implications For The Field Of Health Promotion with Pau...Supreme Court Ruling: Implications For The Field Of Health Promotion with Pau...
Supreme Court Ruling: Implications For The Field Of Health Promotion with Pau...HPCareer.Net / State of Wellness Inc.
 
Corporate Wellness Conference Brochure
Corporate Wellness Conference BrochureCorporate Wellness Conference Brochure
Corporate Wellness Conference Brochurepskelton77
 
The Future of Employer Health Insurance
The Future of Employer Health InsuranceThe Future of Employer Health Insurance
The Future of Employer Health InsuranceHealth Catalyst
 
Fit4business Tips Book Edit
Fit4business Tips Book EditFit4business Tips Book Edit
Fit4business Tips Book EditMartin Crisp
 
6 Factors for Top Line Growth in Dentistry
6 Factors for Top Line Growth in Dentistry6 Factors for Top Line Growth in Dentistry
6 Factors for Top Line Growth in DentistryScott Cairns
 
20100922 nccbh avalere employer webinar final
20100922 nccbh avalere employer webinar final20100922 nccbh avalere employer webinar final
20100922 nccbh avalere employer webinar finalThe National Council
 
Reducing Health Insurance Costs The Year Ahead
Reducing Health Insurance Costs   The Year AheadReducing Health Insurance Costs   The Year Ahead
Reducing Health Insurance Costs The Year Aheadcheryllagun
 
Business presentation
Business presentationBusiness presentation
Business presentationWebMD
 
10 Best Healthcare Solution Companies in 2022.pdf
10 Best Healthcare Solution Companies in 2022.pdf10 Best Healthcare Solution Companies in 2022.pdf
10 Best Healthcare Solution Companies in 2022.pdfinsightscare
 
Career representatives overview-pc-jun 2012
Career  representatives overview-pc-jun 2012Career  representatives overview-pc-jun 2012
Career representatives overview-pc-jun 2012jae3477
 
WellPoint 2006 summary annual report
WellPoint 2006 summary annual report WellPoint 2006 summary annual report
WellPoint 2006 summary annual report finance4
 
Corporate Wellness Pogramming To Maximize Return on Investment (ROI)
Corporate Wellness Pogramming To Maximize Return on Investment (ROI)Corporate Wellness Pogramming To Maximize Return on Investment (ROI)
Corporate Wellness Pogramming To Maximize Return on Investment (ROI)Health Fairs Direct
 
Rising Healthcare Costs: Why We Have to Change
Rising Healthcare Costs: Why We Have to ChangeRising Healthcare Costs: Why We Have to Change
Rising Healthcare Costs: Why We Have to ChangeHealth Catalyst
 
Five Ways For Improving Hospital Revenue Cycle Management
Five Ways For Improving Hospital Revenue Cycle ManagementFive Ways For Improving Hospital Revenue Cycle Management
Five Ways For Improving Hospital Revenue Cycle ManagementHealth Catalyst
 
Mad ancillary short
Mad ancillary shortMad ancillary short
Mad ancillary shortmel4success
 
Five effective methods for companies to reduce health care costs
Five effective methods for companies to reduce health care costsFive effective methods for companies to reduce health care costs
Five effective methods for companies to reduce health care costsOutsource Strategies International
 
Trend Neutralizer - Health Plan Strategy
Trend Neutralizer - Health Plan Strategy  Trend Neutralizer - Health Plan Strategy
Trend Neutralizer - Health Plan Strategy Ronald Lain
 

Similar to Reducing Company Health Cost (20)

Supreme Court Ruling: Implications For The Field Of Health Promotion with Pau...
Supreme Court Ruling: Implications For The Field Of Health Promotion with Pau...Supreme Court Ruling: Implications For The Field Of Health Promotion with Pau...
Supreme Court Ruling: Implications For The Field Of Health Promotion with Pau...
 
About us
About usAbout us
About us
 
Corporate Wellness Conference Brochure
Corporate Wellness Conference BrochureCorporate Wellness Conference Brochure
Corporate Wellness Conference Brochure
 
The Future of Employer Health Insurance
The Future of Employer Health InsuranceThe Future of Employer Health Insurance
The Future of Employer Health Insurance
 
Fit4business Tips Book Edit
Fit4business Tips Book EditFit4business Tips Book Edit
Fit4business Tips Book Edit
 
6 Factors for Top Line Growth in Dentistry
6 Factors for Top Line Growth in Dentistry6 Factors for Top Line Growth in Dentistry
6 Factors for Top Line Growth in Dentistry
 
20100922 nccbh avalere employer webinar final
20100922 nccbh avalere employer webinar final20100922 nccbh avalere employer webinar final
20100922 nccbh avalere employer webinar final
 
Reducing Health Insurance Costs The Year Ahead
Reducing Health Insurance Costs   The Year AheadReducing Health Insurance Costs   The Year Ahead
Reducing Health Insurance Costs The Year Ahead
 
Business presentation
Business presentationBusiness presentation
Business presentation
 
10 Best Healthcare Solution Companies in 2022.pdf
10 Best Healthcare Solution Companies in 2022.pdf10 Best Healthcare Solution Companies in 2022.pdf
10 Best Healthcare Solution Companies in 2022.pdf
 
Career representatives overview-pc-jun 2012
Career  representatives overview-pc-jun 2012Career  representatives overview-pc-jun 2012
Career representatives overview-pc-jun 2012
 
WellPoint 2006 summary annual report
WellPoint 2006 summary annual report WellPoint 2006 summary annual report
WellPoint 2006 summary annual report
 
Corporate Wellness Pogramming To Maximize Return on Investment (ROI)
Corporate Wellness Pogramming To Maximize Return on Investment (ROI)Corporate Wellness Pogramming To Maximize Return on Investment (ROI)
Corporate Wellness Pogramming To Maximize Return on Investment (ROI)
 
Rising Healthcare Costs: Why We Have to Change
Rising Healthcare Costs: Why We Have to ChangeRising Healthcare Costs: Why We Have to Change
Rising Healthcare Costs: Why We Have to Change
 
Five Ways For Improving Hospital Revenue Cycle Management
Five Ways For Improving Hospital Revenue Cycle ManagementFive Ways For Improving Hospital Revenue Cycle Management
Five Ways For Improving Hospital Revenue Cycle Management
 
Mad ancillary short
Mad ancillary shortMad ancillary short
Mad ancillary short
 
Five effective methods for companies to reduce health care costs
Five effective methods for companies to reduce health care costsFive effective methods for companies to reduce health care costs
Five effective methods for companies to reduce health care costs
 
Chap02
Chap02Chap02
Chap02
 
Ethika e-book
Ethika e-bookEthika e-book
Ethika e-book
 
Trend Neutralizer - Health Plan Strategy
Trend Neutralizer - Health Plan Strategy  Trend Neutralizer - Health Plan Strategy
Trend Neutralizer - Health Plan Strategy
 

Recently uploaded

Hemostasis Physiology and Clinical correlations by Dr Faiza.pdf
Hemostasis Physiology and Clinical correlations by Dr Faiza.pdfHemostasis Physiology and Clinical correlations by Dr Faiza.pdf
Hemostasis Physiology and Clinical correlations by Dr Faiza.pdfMedicoseAcademics
 
Call Girls Kanakapura Road Just Call 7001305949 Top Class Call Girl Service A...
Call Girls Kanakapura Road Just Call 7001305949 Top Class Call Girl Service A...Call Girls Kanakapura Road Just Call 7001305949 Top Class Call Girl Service A...
Call Girls Kanakapura Road Just Call 7001305949 Top Class Call Girl Service A...narwatsonia7
 
Pharmaceutical Marketting: Unit-5, Pricing
Pharmaceutical Marketting: Unit-5, PricingPharmaceutical Marketting: Unit-5, Pricing
Pharmaceutical Marketting: Unit-5, PricingArunagarwal328757
 
Hematology and Immunology - Leukocytes Functions
Hematology and Immunology - Leukocytes FunctionsHematology and Immunology - Leukocytes Functions
Hematology and Immunology - Leukocytes FunctionsMedicoseAcademics
 
VIP Call Girls Mumbai Arpita 9910780858 Independent Escort Service Mumbai
VIP Call Girls Mumbai Arpita 9910780858 Independent Escort Service MumbaiVIP Call Girls Mumbai Arpita 9910780858 Independent Escort Service Mumbai
VIP Call Girls Mumbai Arpita 9910780858 Independent Escort Service Mumbaisonalikaur4
 
Call Girls Service Nandiambakkam | 7001305949 At Low Cost Cash Payment Booking
Call Girls Service Nandiambakkam | 7001305949 At Low Cost Cash Payment BookingCall Girls Service Nandiambakkam | 7001305949 At Low Cost Cash Payment Booking
Call Girls Service Nandiambakkam | 7001305949 At Low Cost Cash Payment BookingNehru place Escorts
 
Call Girls Service in Virugambakkam - 7001305949 | 24x7 Service Available Nea...
Call Girls Service in Virugambakkam - 7001305949 | 24x7 Service Available Nea...Call Girls Service in Virugambakkam - 7001305949 | 24x7 Service Available Nea...
Call Girls Service in Virugambakkam - 7001305949 | 24x7 Service Available Nea...Nehru place Escorts
 
Book Call Girls in Kasavanahalli - 7001305949 with real photos and phone numbers
Book Call Girls in Kasavanahalli - 7001305949 with real photos and phone numbersBook Call Girls in Kasavanahalli - 7001305949 with real photos and phone numbers
Book Call Girls in Kasavanahalli - 7001305949 with real photos and phone numbersnarwatsonia7
 
Noida Sector 135 Call Girls ( 9873940964 ) Book Hot And Sexy Girls In A Few C...
Noida Sector 135 Call Girls ( 9873940964 ) Book Hot And Sexy Girls In A Few C...Noida Sector 135 Call Girls ( 9873940964 ) Book Hot And Sexy Girls In A Few C...
Noida Sector 135 Call Girls ( 9873940964 ) Book Hot And Sexy Girls In A Few C...rajnisinghkjn
 
Call Girl Service Bidadi - For 7001305949 Cheap & Best with original Photos
Call Girl Service Bidadi - For 7001305949 Cheap & Best with original PhotosCall Girl Service Bidadi - For 7001305949 Cheap & Best with original Photos
Call Girl Service Bidadi - For 7001305949 Cheap & Best with original Photosnarwatsonia7
 
Call Girls Jp Nagar Just Call 7001305949 Top Class Call Girl Service Available
Call Girls Jp Nagar Just Call 7001305949 Top Class Call Girl Service AvailableCall Girls Jp Nagar Just Call 7001305949 Top Class Call Girl Service Available
Call Girls Jp Nagar Just Call 7001305949 Top Class Call Girl Service Availablenarwatsonia7
 
Call Girls Electronic City Just Call 7001305949 Top Class Call Girl Service A...
Call Girls Electronic City Just Call 7001305949 Top Class Call Girl Service A...Call Girls Electronic City Just Call 7001305949 Top Class Call Girl Service A...
Call Girls Electronic City Just Call 7001305949 Top Class Call Girl Service A...narwatsonia7
 
Book Call Girls in Yelahanka - For 7001305949 Cheap & Best with original Photos
Book Call Girls in Yelahanka - For 7001305949 Cheap & Best with original PhotosBook Call Girls in Yelahanka - For 7001305949 Cheap & Best with original Photos
Book Call Girls in Yelahanka - For 7001305949 Cheap & Best with original Photosnarwatsonia7
 
Housewife Call Girls Bangalore - Call 7001305949 Rs-3500 with A/C Room Cash o...
Housewife Call Girls Bangalore - Call 7001305949 Rs-3500 with A/C Room Cash o...Housewife Call Girls Bangalore - Call 7001305949 Rs-3500 with A/C Room Cash o...
Housewife Call Girls Bangalore - Call 7001305949 Rs-3500 with A/C Room Cash o...narwatsonia7
 
See the 2,456 pharmacies on the National E-Pharmacy Platform
See the 2,456 pharmacies on the National E-Pharmacy PlatformSee the 2,456 pharmacies on the National E-Pharmacy Platform
See the 2,456 pharmacies on the National E-Pharmacy PlatformKweku Zurek
 
Statistical modeling in pharmaceutical research and development.
Statistical modeling in pharmaceutical research and development.Statistical modeling in pharmaceutical research and development.
Statistical modeling in pharmaceutical research and development.ANJALI
 
Call Girls Service Noida Maya 9711199012 Independent Escort Service Noida
Call Girls Service Noida Maya 9711199012 Independent Escort Service NoidaCall Girls Service Noida Maya 9711199012 Independent Escort Service Noida
Call Girls Service Noida Maya 9711199012 Independent Escort Service NoidaPooja Gupta
 
Call Girls Thane Just Call 9910780858 Get High Class Call Girls Service
Call Girls Thane Just Call 9910780858 Get High Class Call Girls ServiceCall Girls Thane Just Call 9910780858 Get High Class Call Girls Service
Call Girls Thane Just Call 9910780858 Get High Class Call Girls Servicesonalikaur4
 
Call Girls Jayanagar Just Call 7001305949 Top Class Call Girl Service Available
Call Girls Jayanagar Just Call 7001305949 Top Class Call Girl Service AvailableCall Girls Jayanagar Just Call 7001305949 Top Class Call Girl Service Available
Call Girls Jayanagar Just Call 7001305949 Top Class Call Girl Service Availablenarwatsonia7
 
VIP Call Girls Lucknow Nandini 7001305949 Independent Escort Service Lucknow
VIP Call Girls Lucknow Nandini 7001305949 Independent Escort Service LucknowVIP Call Girls Lucknow Nandini 7001305949 Independent Escort Service Lucknow
VIP Call Girls Lucknow Nandini 7001305949 Independent Escort Service Lucknownarwatsonia7
 

Recently uploaded (20)

Hemostasis Physiology and Clinical correlations by Dr Faiza.pdf
Hemostasis Physiology and Clinical correlations by Dr Faiza.pdfHemostasis Physiology and Clinical correlations by Dr Faiza.pdf
Hemostasis Physiology and Clinical correlations by Dr Faiza.pdf
 
Call Girls Kanakapura Road Just Call 7001305949 Top Class Call Girl Service A...
Call Girls Kanakapura Road Just Call 7001305949 Top Class Call Girl Service A...Call Girls Kanakapura Road Just Call 7001305949 Top Class Call Girl Service A...
Call Girls Kanakapura Road Just Call 7001305949 Top Class Call Girl Service A...
 
Pharmaceutical Marketting: Unit-5, Pricing
Pharmaceutical Marketting: Unit-5, PricingPharmaceutical Marketting: Unit-5, Pricing
Pharmaceutical Marketting: Unit-5, Pricing
 
Hematology and Immunology - Leukocytes Functions
Hematology and Immunology - Leukocytes FunctionsHematology and Immunology - Leukocytes Functions
Hematology and Immunology - Leukocytes Functions
 
VIP Call Girls Mumbai Arpita 9910780858 Independent Escort Service Mumbai
VIP Call Girls Mumbai Arpita 9910780858 Independent Escort Service MumbaiVIP Call Girls Mumbai Arpita 9910780858 Independent Escort Service Mumbai
VIP Call Girls Mumbai Arpita 9910780858 Independent Escort Service Mumbai
 
Call Girls Service Nandiambakkam | 7001305949 At Low Cost Cash Payment Booking
Call Girls Service Nandiambakkam | 7001305949 At Low Cost Cash Payment BookingCall Girls Service Nandiambakkam | 7001305949 At Low Cost Cash Payment Booking
Call Girls Service Nandiambakkam | 7001305949 At Low Cost Cash Payment Booking
 
Call Girls Service in Virugambakkam - 7001305949 | 24x7 Service Available Nea...
Call Girls Service in Virugambakkam - 7001305949 | 24x7 Service Available Nea...Call Girls Service in Virugambakkam - 7001305949 | 24x7 Service Available Nea...
Call Girls Service in Virugambakkam - 7001305949 | 24x7 Service Available Nea...
 
Book Call Girls in Kasavanahalli - 7001305949 with real photos and phone numbers
Book Call Girls in Kasavanahalli - 7001305949 with real photos and phone numbersBook Call Girls in Kasavanahalli - 7001305949 with real photos and phone numbers
Book Call Girls in Kasavanahalli - 7001305949 with real photos and phone numbers
 
Noida Sector 135 Call Girls ( 9873940964 ) Book Hot And Sexy Girls In A Few C...
Noida Sector 135 Call Girls ( 9873940964 ) Book Hot And Sexy Girls In A Few C...Noida Sector 135 Call Girls ( 9873940964 ) Book Hot And Sexy Girls In A Few C...
Noida Sector 135 Call Girls ( 9873940964 ) Book Hot And Sexy Girls In A Few C...
 
Call Girl Service Bidadi - For 7001305949 Cheap & Best with original Photos
Call Girl Service Bidadi - For 7001305949 Cheap & Best with original PhotosCall Girl Service Bidadi - For 7001305949 Cheap & Best with original Photos
Call Girl Service Bidadi - For 7001305949 Cheap & Best with original Photos
 
Call Girls Jp Nagar Just Call 7001305949 Top Class Call Girl Service Available
Call Girls Jp Nagar Just Call 7001305949 Top Class Call Girl Service AvailableCall Girls Jp Nagar Just Call 7001305949 Top Class Call Girl Service Available
Call Girls Jp Nagar Just Call 7001305949 Top Class Call Girl Service Available
 
Call Girls Electronic City Just Call 7001305949 Top Class Call Girl Service A...
Call Girls Electronic City Just Call 7001305949 Top Class Call Girl Service A...Call Girls Electronic City Just Call 7001305949 Top Class Call Girl Service A...
Call Girls Electronic City Just Call 7001305949 Top Class Call Girl Service A...
 
Book Call Girls in Yelahanka - For 7001305949 Cheap & Best with original Photos
Book Call Girls in Yelahanka - For 7001305949 Cheap & Best with original PhotosBook Call Girls in Yelahanka - For 7001305949 Cheap & Best with original Photos
Book Call Girls in Yelahanka - For 7001305949 Cheap & Best with original Photos
 
Housewife Call Girls Bangalore - Call 7001305949 Rs-3500 with A/C Room Cash o...
Housewife Call Girls Bangalore - Call 7001305949 Rs-3500 with A/C Room Cash o...Housewife Call Girls Bangalore - Call 7001305949 Rs-3500 with A/C Room Cash o...
Housewife Call Girls Bangalore - Call 7001305949 Rs-3500 with A/C Room Cash o...
 
See the 2,456 pharmacies on the National E-Pharmacy Platform
See the 2,456 pharmacies on the National E-Pharmacy PlatformSee the 2,456 pharmacies on the National E-Pharmacy Platform
See the 2,456 pharmacies on the National E-Pharmacy Platform
 
Statistical modeling in pharmaceutical research and development.
Statistical modeling in pharmaceutical research and development.Statistical modeling in pharmaceutical research and development.
Statistical modeling in pharmaceutical research and development.
 
Call Girls Service Noida Maya 9711199012 Independent Escort Service Noida
Call Girls Service Noida Maya 9711199012 Independent Escort Service NoidaCall Girls Service Noida Maya 9711199012 Independent Escort Service Noida
Call Girls Service Noida Maya 9711199012 Independent Escort Service Noida
 
Call Girls Thane Just Call 9910780858 Get High Class Call Girls Service
Call Girls Thane Just Call 9910780858 Get High Class Call Girls ServiceCall Girls Thane Just Call 9910780858 Get High Class Call Girls Service
Call Girls Thane Just Call 9910780858 Get High Class Call Girls Service
 
Call Girls Jayanagar Just Call 7001305949 Top Class Call Girl Service Available
Call Girls Jayanagar Just Call 7001305949 Top Class Call Girl Service AvailableCall Girls Jayanagar Just Call 7001305949 Top Class Call Girl Service Available
Call Girls Jayanagar Just Call 7001305949 Top Class Call Girl Service Available
 
VIP Call Girls Lucknow Nandini 7001305949 Independent Escort Service Lucknow
VIP Call Girls Lucknow Nandini 7001305949 Independent Escort Service LucknowVIP Call Girls Lucknow Nandini 7001305949 Independent Escort Service Lucknow
VIP Call Girls Lucknow Nandini 7001305949 Independent Escort Service Lucknow
 

Reducing Company Health Cost

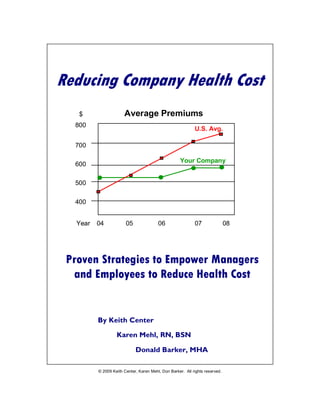
  • 1. Reducing Company Health Cost – Draft 3 Reducing Company Health Cost $ Average Premiums 800 U.S. Avg. 700 Your Company 600 500 400 Year 04 05 06 07 08 Proven Strategies to Empower Managers and Employees to Reduce Health Cost By Keith Center Karen Mehl, RN, BSN Donald Barker, MHA © 2009 Keith Center, Karen Mehl, Don Barker. All rights reserved. May not be duplicated, reproduced or retransmitted without permission www.masonbiz.com www.healthservicereview.com 1
  • 2. Reducing Company Health Cost – Draft 3 © 2009 Keith Center, Karen Mehl, Don Barker. All rights reserved. May not be duplicated, reproduced or retransmitted without permission www.masonbiz.com www.healthservicereview.com 2
  • 3. Reducing Company Health Cost – Draft 3 Don Barker, MHA Founder, President & CEO of HSR Prior to founding Health Service Review in 1983, Mr. Barker had many years of experience in hospital management and patient care. His experience includes several executive positions with responsibility for patient care, PPO development, customer service, marketing, human resources and hospital planning. Karen Mehl, RN, BSN Founder, Vice-President , Operations & CFO of HSR Before founding HSR, Ms. Mehl was Vice President of nursing at a regional hospital. Prior to this, her experience included executive positions in patient care, staff development and a School of Nursing. Keith Center President, Mason International Business Group Speaker, author and consultant, Keith has worked with large and small companies for over 30 years including IBM, Toyota, GE Capital, International Harvester and Fujitsu Consulting. He is an Accredited Associate of the Institute for Independent Business, a Certified Guerrilla Marketing Coach and author of Money, Time & People…will kill your business. If you would like to connect with Don and his team today, simply fire off an email to dbarker@healthservicereview.com © Copyright 2009 by Keith Center, Karen Mehl and Donald Barker All rights reserved under International and Pan-American Copyright Conventions. Published in the United States by Mason International Business Group, Ltd. Mason, OH, U.S.A. No part of this publication may be reproduced, stored in a retrieval system, or transmitted in any form or by any means – electronic, mechanical, or photocopying, recording or scanning – without the prior written permission of the authors, or publisher. Requests for permission should be addressed to Mason International Business Group, Ltd. Mason, OH, U.S.A. keithcenter@masonbiz.com; 513-459-7309 ISBN Number Manufactured in the United States of America 081011 © 2009 Keith Center, Karen Mehl, Don Barker. All rights reserved. May not be duplicated, reproduced or retransmitted without permission www.masonbiz.com www.healthservicereview.com 3
  • 4. Reducing Company Health Cost – Draft 3 Welcome The purpose of this book is to demystify health care for the business owner, and also show how to implement concrete strategies for monitoring and managing health care costs. As a result, the reader will be better equipped to reduce health care costs for his or her business. Many in this industry say that “claims are claims.” In other words, claims are going to happen and there is not a thing that you can do about it. The purpose of this book is to show that there is something that the business owner can do to reduce the high cost of claims. There are two modules in this book. Module I gives the landscape of the root causes of major areas of cost in the U.S. today. Module II provides the dashboard for getting control of your costs as well as an outline of the players and the questions to ask. This book will also act as a guide for the employee to ensure that they get the best quality health care from their plan. It is our sincere hope that you use this material to discover new ways in which you can not only get control of your health care spend, but also to reduce current costs. Don, Karen & Keith www.healthservicereview.com © 2009 Keith Center, Karen Mehl, Don Barker. All rights reserved. May not be duplicated, reproduced or retransmitted without permission www.masonbiz.com www.healthservicereview.com 4
  • 5. Reducing Company Health Cost – Draft 3 Reducing Company Health Cost Table of Contents Module I Root Causes of Health Cost Chapter One: Cost of Medical Service What Do We Get for All of Our Money Spent on Health Care? Insurance Premiums Are Sky Rocketing! Key Cause of Health Cost How Do People Get That Sick? Chapter Two: Availability of Medical Service Deterioration of the Quality of Life Reasons Why Disease Progresses So Fast Chapter Three: The Quality of Medicine Event Rates in U.S. Hospitals The Cost of Hospital Avoidable Events Causes of Medication Errors Module II Three Actions to Reduce Your Health Cost Chapter Four: Which Key Performance Indicators to Use? Setting up Your Medical Management Dashboard Step One: Predictive Modeling Step Two: The True Key Performance Indicators Chapter Five: What To Do To Get Key Players Accountable? Health Insurance Provider Hospital & Preferred Provider Organization (PPO) What to Do to Get Your Broker Working for You Third Party Administrator Chapter Six: Empower Your Employees to Reduce Cost Five Steps to Safer Health Care Twenty Tips to Prevent Medical Error Getting Prepared for Medical Appointments © 2009 Keith Center, Karen Mehl, Don Barker. All rights reserved. May not be duplicated, reproduced or retransmitted without permission www.masonbiz.com www.healthservicereview.com 5
  • 6. Reducing Company Health Cost – Draft 3 © 2009 Keith Center, Karen Mehl, Don Barker. All rights reserved. May not be duplicated, reproduced or retransmitted without permission www.masonbiz.com www.healthservicereview.com 6
  • 7. Reducing Company Health Cost – Draft 3 Part I Root Causes of Health Cost © 2009 Keith Center, Karen Mehl, Don Barker. All rights reserved. May not be duplicated, reproduced or retransmitted without permission www.masonbiz.com www.healthservicereview.com 7
  • 8. Reducing Company Health Cost – Draft 3 © 2009 Keith Center, Karen Mehl, Don Barker. All rights reserved. May not be duplicated, reproduced or retransmitted without permission www.masonbiz.com www.healthservicereview.com 8
  • 9. Reducing Company Health Cost – Draft 3 Chapter One Cost of Medical Service When it comes to any industry, the three top things that are most important are quality, cost and timing. Health care is no different, only we might say “quality, cost and availability of service”. America’s health care system has long been considered superior to that of other countries because there is very little to no waiting time for major interventions. But how do we really compare? And what about the other two areas of cost and quality? Figure 1: International Comparison of Spending on Health, 1980–2006 Average spending on health Total expenditures on health per capita ($US PPP) as percent of GDP 7000 16 Australia Canada 14 6000 Denmark France Germany Netherlands 12 5000 New Zealand Sweden Switzerland 10 United Kingdom 4000 United States 8 3000 6 Australia Canada Denmark 2000 France 4 Germany Netherlands New Zealand 1000 2 Sweden Switzerland United Kingdom United States 0 0 1980 1984 1988 1992 1996 2000 2004 2006 1980 1984 1988 1992 1996 2000 2004 2006 Data: OECD Health Data 2008 (June 2008) From this graph it is clear that the U.S. expenditure on health care is double that of major industrialized, western countries, but why? Before we get into the answer, let’s look at what we get for all the money spent on health care. © 2009 Keith Center, Karen Mehl, Don Barker. All rights reserved. May not be duplicated, reproduced or retransmitted without permission www.masonbiz.com www.healthservicereview.com 9
  • 10. Reducing Company Health Cost – Draft 3 What Do We Get For All of Our Money Spent on Health Care? Avoidable Events Leading Cause of Death In 1997, the Institute of Medicine published a paper stating that preventable medical events account for nearly 100,000 deaths every year. By contrast, motor vehicle accidents cause about 46,000 deaths yearly. Figure 2: Number of Deaths 100,000 80,000 60,000 40,000 20,000 98,000 45,485 42,297 Errors in Motor Vehicle Breast Cancer Hospitals Accidents Source: Institute of Medicine This study by the Institute of Medicine is referred to over and over again by people researching medical events. That being said, a more recent study of 37 Million patient records in 2001, 2002 and 2003, by HealthGrades determined that the Institute for Medicine’s number of deaths is low! From HealthGrade’s data the number is more like 195,000 deaths per year in hospitals due to potentially preventable, in-hospital medical events. To put that in perspective, that’s about 2,000,000 people that have died since the original Institute of Medicine study and yet little has been accomplished. Why aren’t we hearing more about this? The same number of people died in the Killing Fields in Cambodia and the world was shocked and outraged. Journalists described the Killing Fields as genocide. So how would they describe what goes on in hospitals? Dr. Samantha Collier, HealthGrades' vice president of medical affairs said, "The equivalent of 390 jumbo jets full of people are dying each year due to likely preventable, in-hospital medical events, making this one of the leading killers in the U.S." Consider this: if the FAA allowed jets to crash at a rate of over one per day for a year, don’t you think that there would be a public outcry? Do you think that the public would put up with the FAA plodding along at their own pace? © 2009 Keith Center, Karen Mehl, Don Barker. All rights reserved. May not be duplicated, reproduced or retransmitted without permission www.masonbiz.com www.healthservicereview.com 10
  • 11. Reducing Company Health Cost – Draft 3 But that is exactly is what the medical industry is doing: plodding along at their own pace. And the death toll continues to increase. At the same time, the politicians, not to mention the health care industry, are doing little to improve the situation. According to Lucian Leape , a major factor is fatigue. “Health care is the only industry that does not believe that fatigue diminishes performance.” Lucian Leape, MD, Department of Health and Policy, Harvard University. Aircrews are monitored for fatigue, and as people get more tired the opportunity for diminished communication effectiveness and increased conflict. With aircrew, 90% of disagreements are resolved in the cockpit, but with medical teams only 10% are resolved in the operating room. “Being awake for 24 hours results in impairment of judgment and physical dexterity equivalent to a blood alcohol level of 0.1” Steven Meisel, Pharm D., Director of Medication Safety, Fairview Health Services, Minneapolis, Minnesota. Insurance Premiums Are Sky Rocketing! Insurance companies like to spin the numbers and say that your premium only went up by “x percent” this year. In fact, insurance premiums have risen dramatically in recent times. In the following chart, the percentage of increase per year for insurance premiums is shown. Figure 3: Cumulative Changes in Health Insurance Premiums, Inflation, and Workers’ Earnings, 1999-2008 140% 119% 120% 100% 80% 60% 40% 34% 20% 29% 0% 1999 2000 2001 2002 2003 2004 2005 2006 2007 2008 Source: Kaiser/HRET Survey of Employer-Sponsored Health Benefits, 2000-2008. Bureau of Labor Statistics, Consumer Price Index, U.S. City Health Insurance Premiums Average of Annual Inflation (April to April), 2000-2008; Bureau of Labor Workers' Earnings Statistics, Seasonally Adjusted Data from the Current Employment Statistics Survey, 2000-2008 (April to April). Overall Inflation As can be seen, the accumulated cost increase is a whopping 119%. More than three times the rate of inflation! © 2009 Keith Center, Karen Mehl, Don Barker. All rights reserved. May not be duplicated, reproduced or retransmitted without permission www.masonbiz.com www.healthservicereview.com 11
  • 12. Reducing Company Health Cost – Draft 3 It is no wonder that after payroll and plant equipment, health care is the third largest cost to businesses. Not only is it a large expense, it is the least likely to be understood. Health care is complex, and the internal operations of the health care industry are a mystery to many business executives. Key Cause of Health Cost Many in the health care insurance industry say “Claims are claims,” meaning that medical claims are going to happen anyway that there is little that a business owner can do to impact them. But is this true? Do we just sit back and accept that rising health care insurance cost will drive us out of business? Or do we expect the government to pay for it all, and then close our doors due to increased taxation to pay for it all? What can we do? First we need to understand where the claims, or costs, are coming from. In the following chart, we see the distribution of cost across the population in the United States. Figure 4: U.S. Health Care Spending Disproportionate for Patients with Chronic Conditions From this chart we can see that 47% of the health care cost is driven by only 14% of the population. And in fact, 85% of the cost comes from less than half of the population. How Do People Get That Sick? In today’s health care landscape it is just a matter of time before “an actuarial moment”, or catastrophic event occurs. And with most catastrophes there are signs leading up to the event. And when one understands the signs, evasive measures can be taken. People can be divided into three categories, high, medium and low risk. This may be due to a variety of factors, health, medical care and compliance, and just plain bad luck. © 2009 Keith Center, Karen Mehl, Don Barker. All rights reserved. May not be duplicated, reproduced or retransmitted without permission www.masonbiz.com www.healthservicereview.com 12
  • 13. Reducing Company Health Cost – Draft 3 Those who are high risk, may exhibit symptoms of a major health impact for years before it finally happens. The key to cost control is the early detection of these symptoms and to mitigate the risk before the catastrophic event happens. The major cost impacts are triggered by catastrophic events such as premature births, major cardiac events, complications due to diabetes, as well as others that can be detected early, and the risks mitigated. Let’s look at the progression of disease in a general population. In the following chart, there are three different graph lines representing people at high, medium and low risk. The Y-Axis is the cost impact to a medical plan. The X-Axis shows time over twenty-four quarters, or six years. Twelve quarters (three years) before the catastrophic event, point Q0, and twelve quarters after. Figure 5: Today’s Health Care Landscape Medical Management 9000 8000 Serious Cost 7000 Medium Cost 6000 Low Cost 5000 4000 Condition Management Health Promotion Opportunity 3000 Opportunity 2000 1000 0 Q-12 Q-9 Q-6 Q-3 Q0 Q+3 Q+6 Q+9 Q+12 Musich, Schultz, Burton, Edington. Michigan Health Management Institute The green line shows the medical cost of a healthy person over the same timeframe of six years. The yellow line shows the increased cost for a moderately healthy individual. This person is most likely under medical supervision, takes their medication and is what we call compliant with the medical directions given, called medical protocols. Let’s look at the progression of the financial impact of event that happened to a patient. Q0 is the point at which the cost peaked due to a major illness. Moving left from this point, Q-3 through Q-12 show that the costs were increasing as a result of the condition getting worse. The cost started to climb from Q-9 through Q-3. The increasing cost is clearly visible. It is during this period of escalating medical care should have been a signal for intervention. Medical intervention during this timeframe would have preempted the need for extremely expensive Medical Care Management. It’s what we call a “Health Promotion Opportunity.” © 2009 Keith Center, Karen Mehl, Don Barker. All rights reserved. May not be duplicated, reproduced or retransmitted without permission www.masonbiz.com www.healthservicereview.com 13
  • 14. Reducing Company Health Cost – Draft 3 Unchecked, this disease escalated, and so did the cost. After the disease peaked, ongoing medical attention was necessary and the ongoing cost was higher than it had been before the event. There is the potential for another major health episode if the patient’s condition, and adherence to medical protocols, is not monitored. That is why the timeframe after the event is called a “Condition Management Opportunity.” As D. Edington says, “The solution is for sick people to not get any sicker.” © 2009 Keith Center, Karen Mehl, Don Barker. All rights reserved. May not be duplicated, reproduced or retransmitted without permission www.masonbiz.com www.healthservicereview.com 14
  • 15. Reducing Company Health Cost – Draft 3 Chapter Two Availability of Medical Service The availability of medical service is not a great issue in this country, but having the right medical care at the right time is. In other words, going to the wrong specialist means that the care administered may be neither timely, nor correct. The specialist may have been incorrectly recommended, or the patient made the decision on who to see by themselves. This often results in what is called “Rule Out Medicine.” In other words, the clinician does all that they can, and in the end says “I can’t help you.” More often than not, a patient who decides for themselves to see a particular specialist makes the wrong choice. The patient calls their insurance carrier. A person at the carrier’s help desk tells them whether or not the clinician is on their approved list, not whether they are going to get the right treatment. This results in running up the cost to the health plan and the patient, but without a solution. The insurance company should be making sure that the patient is getting the right treatment. Not from a provider who is merely on their list, not someone who is the lowest cost, but a provider who has the right expertise to deliver quality health care and provide the right treatment. This should also include out of network providers. For some conditions, the best clinician may not be within the network. Large insurance companies tend to be inflexible and do not typically negotiate out of network deals. As a result, out of network health care runs up the cost to the health plan even more. It’s a function of getting the right care, at the right time, for the right price. Also, as stated earlier, the U.S. health care system has historically delivered service with very little waiting compared to other nations. But has this resulted in healthier people? In order to get an answer to that question, we need to first ask “Are interventions happening at the correct time?” © 2009 Keith Center, Karen Mehl, Don Barker. All rights reserved. May not be duplicated, reproduced or retransmitted without permission www.masonbiz.com www.healthservicereview.com 15
  • 16. Reducing Company Health Cost – Draft 3 Deterioration of the Quality of Life In Figure 1, we saw how much higher the cost for health care in the U.S. was. Why? Well, we’ve already discussed D. Edington’s chart of how catastrophic events happen. Now let’s look at how the U.S. approach to medical intervention creates greater expense. We are paying for healthcare in more than dollars. The following chart shows the focus in the U.S. on expensive medical management known as Disease Management and Case Management. Figure 6: Deterioration of the Quality of Life $ Utilization Review & Case Management This is Disease Management where the R.I.P major . D Controls Future Costs costs are x ead Well As can be seen in the above chart, the difficulty with the American approach to medicine is that major intervention occurs toward the end of life. And that is when the cost of health care is the greatest. If those who are at risk are detected earlier, then medical intervention action can also be earlier. Protocols can be set in place, and patient compliance to those protocols can be monitored and coached so that patients will not get any sicker. The results are clear. Improved health, or at least stabilized health, will result in moving the patient more to the left of this chart. Earlier intervention will avoid the escalation of medical management costs, and improve the patient’s quality of life. Predictive Modeling Predictive modeling is a technique for the early detection of people that are at risk. It is best described as artificial intelligence software. Most insurance providers may claim to use predictive modeling software. But in addition to the variation in quality of the software products used, any tool is only as good as the craftsman using it. The effectiveness of this artificial intelligence software needs to be sharpened by medical professionals who understand at a deep level how to set up the right filters to detect those patients who are at maximum risk. Once at risk people are detected, they can be placed under supervision of a RN health coach. The coach ensures that their health does not deteriorate due to lack of knowledge, or lack of compliance with medical protocols that are designed to help them stabilize and improve their health. © 2009 Keith Center, Karen Mehl, Don Barker. All rights reserved. May not be duplicated, reproduced or retransmitted without permission www.masonbiz.com www.healthservicereview.com 16
  • 17. Reducing Company Health Cost – Draft 3 Reasons Why Diseases Progress So Fast Let’s look at some specific examples of disease progression, the opportunities for intervention, and the cost impact. Example 1: The Progression of Heart Disease In the following example of the progression of heart disease, there are multiple opportunities for medical intervention. Figure 7: The Progression of Heart Disease Transplant $160,000 By-Pass Surgery $60,000 Angiogram Angioplasty Stents Historical UR/CM $30,000 Intervention Cost Current Disease Mgt. Industry Intervention $6,000 Office Visit - Medication Intervention Early $600 Intervention Diet and Exercise Opportunity Lifestyle Changes Irreversible Disease Undetected Chest Pain s ion Heart Failure Symptoms Mild Heart Damage t en & Trends rv Hypertension Myocardial Infarct te Hyperlipidemia Moderate Heart In Damage Manifestations If ignored, or undetected, the cost of intervention increases dramatically. Delay in intervention impacts the quality of life for the patient, and their family, as well as dramatically increasing the cost of health care. The medical insurance plan takes a major hit when the probability of this event may have been readily detected earlier. Predictive modeling software, regular visits to a Primary Care Physician, and ensuring that the patient is complying with the medical protocols set in place by the physician, could have impacted the progression of the disease. Once again, getting the right care from the right clinician, at the right time, would have a positive impact on the wellness of the patient, and reduce the overall cost to the health plan. © 2009 Keith Center, Karen Mehl, Don Barker. All rights reserved. May not be duplicated, reproduced or retransmitted without permission www.masonbiz.com www.healthservicereview.com 17
  • 18. Reducing Company Health Cost – Draft 3 Example 2: Diabetic 57 Year Old Male This next example is of a 57 year old male diabetic. Over the space of only 26 months went from clearly detected and treatable Type II diabetes, to having a leg amputated. In addition to the amputation, he ended up in a nursing home. This tragic situation could have been avoided. Figure 8: The Progression of Diabetes $300,000 09/07/07 05/08/09 $200,000 09/04/06 01/25/06 $100,000 $0.00 or d e II s z s 3) aj ) e - M yr D iti er ar lle en pe (X l lc C ya n 1 sc ro gr Ty tio ( U nt se e m Va an ta X 3 om in co s eo U G te Sk h Un H pu re st lin r ip be O Am Ca ic ng su Pe ia s on te si D In nt t ic hr be ur tie C N be ia pa D ia In D As can be seen in this chart, there were several plateaus where the disease could have been contained through treatment, education, coaching and compliance. The impact to the health plan was greater than the $300,000 shown here. The ongoing cost of the nursing home became a continual cost drain on the health plan. In both of the preceding examples there were prior events that indicated the impending severity of risk to the patient. If detected and treated at an earlier stage, the result would have been better quality of life for the patient, and lower impact to the health care plan. It is events like these that can be detected, but are not addressed until late in the progression of the disease, that creates the major impact on spiraling health care costs. That being said, there is more to health care cost than early intervention and compliance. © 2009 Keith Center, Karen Mehl, Don Barker. All rights reserved. May not be duplicated, reproduced or retransmitted without permission www.masonbiz.com www.healthservicereview.com 18
  • 19. Reducing Company Health Cost – Draft 3 Chapter Three The Quality of Medicine Physicians today still take the Hippocratic Oath stated by Hippocrates, the father of medicine. What ever happened to the statement that is attributed to Hippocrates? “First do no harm?” (By the way, this statement is not actually in the Hippocratic Oath, but is often quoted. Nonetheless, it is an excellent principle for all businesses to adhere to, not just medicine). Health care today has become a very complex industry with many moving parts and players. “Medicine used to be simple, ineffective, and relatively safe… …Now it is complex, effective, and potentially dangerous.” Sir Cyril Chantler Event Rates in U.S. Hospitals The Institute of medicine stated in 1999 that there are over 98,000 deaths per year due to mistakes in hospitals alone, not counting the rest of the industry. And HealthGrades reported from their data, that the number is more like 195,000. Figure 9: Event Rates in US Hospitals -7 -6 ??? Log(10) Error Rate -5 Scheduled Airlines, Nuclear Power, -4 European Railroads, Hospitals Aircraft Carriers -3 Auto driving Chemical Industry Charter Flights -2 Bungee Jumping -1 Extreme Mountain Climbing Motor Cycle Racing 0 Dangerous Regulated Ultra Safe Ideal System Systems Systems Systems Amalberti, R. Safety Science, 2001 The chart speaks for itself. Hospitals are not as safe as most people assume. Note that both axes are logarithmic. © 2009 Keith Center, Karen Mehl, Don Barker. All rights reserved. May not be duplicated, reproduced or retransmitted without permission www.masonbiz.com www.healthservicereview.com 19
  • 20. Reducing Company Health Cost – Draft 3 What is the root cause of these mistakes? “Medical accidents are usually the result of complex systems failure. Although incompetent and malfeasant staff exist, adverse outcomes are more commonly the result of systems problems. As safety in the aviation industry improved only after its leaders adopted this tenet, safety in medicine will not improve unless its complex systems are redesigned.” Steven Meisel, Pharm.D., Director of Medication Safety, Fairview Health Services, Minneapolis, Minnesota The key areas are medical errors, hospital acquired infections, drug toxicity, and recommended care not being administered. Consider these statistics from the New England Journal of Medicine. • 3% or more of hospital patients are hurt by medical error. • 1 in 300 patients die from such mistakes. In U.S. aviation only 1 in 5 million flights ends in a deadly accident. • 24% of people say they or a family member have been harmed by a medical error. • 90,000 people die of hospital-acquired infections annually. More than half of these deaths may be preventable. • 180,000 elderly outpatients die or are seriously injured by drug toxicity. Half of these incidents may be preventable. • 7,000 patients die from drug errors each year. • 554 errors in four months were found at one six-bed intensive care unit; 147 were potentially serious or life-threatening. • 55% of recommended care actually gets administered. • $2,000 Annual cost to employers per insured worker, due to poor-quality care. Sources: Lucian Leape; New England Journal of Medicine; CDC; Forbes; Journal of the American Medical Association; Institute of Medicine; Quality and Safety in Health Care; RAND; Midwest Business Group on Health. “Research estimates that more than one million serious medication errors occur each year in U.S. hospitals, with 7,000 deaths annually from adverse drug events (ADEs). In addition to the human price paid, each ADE adds $2,000 on average to the cost of a hospitalization. This translates to more than $7.5 billion per year nationwide in hospital costs alone.” The Leapfrog Group, 2008 Hospital Annual Report Everyone knows someone with a story about the negative impact of sub standard medicine, but what can you do about it? After all, business executives do care about their employees, for without them they would not have a business. But how to determine which hospitals are safest? The Leapfrog group is striving to get the data, but most of the participating hospitals are already among the best in the country. © 2009 Keith Center, Karen Mehl, Don Barker. All rights reserved. May not be duplicated, reproduced or retransmitted without permission www.masonbiz.com www.healthservicereview.com 20
  • 21. Reducing Company Health Cost – Draft 3 Medical management company Case Managers should also be able to do this for you and make recommendations to hospitals based on qualitative aspects, especially within your region. The Cost of Hospital Avoidable Events We need to be aware of the quality of service as well as the cost. That is where a competent, educated Medical Management Provider comes in. Most of the large companies run their facilities like call centers. People answering calls do have a lot of medical training in many cases. Furthermore they are measured on time per call, calls per hour and cost savings, not on the quality of the care given. Surgical errors cost nearly $1.5 billion annually Potentially preventable medical errors that occur during or after surgery may cost employers nearly $1.5 billion a year, according to new estimates by researchers William E. Encinosa, Ph.D., and Fred J. Hellinger, Ph.D., of the Agency for Healthcare Research and Quality (AHRQ). The study found that insurers paid an additional $28,218 (52 percent more) and an additional $19,480 (48 percent more) for surgery patients who experienced acute respiratory failure or post-operative infections, respectively, compared with patients who did not experience either error. The authors also found these additional costs for surgery patients who experienced the following medical errors compared with those who did not: • Nursing care associated with avoidable errors, including pressure ulcers and hip fractures—$12,196 (33 percent more). • Metabolic problems associated with medical errors, including kidney failure or uncontrolled blood sugar—$11,797 (32 percent more). • Blood clots or other vascular or pulmonary problems associated with avoidable errors—$7,838 (25 percent more). • Wound opening associated with avoidable errors—$1,426 (6 percent more). The study also found that 1 of every 10 patients who died within 90 days of surgery did so because of a preventable error, and that one-third of the deaths occurred after the initial hospital discharge. The study was based on a nationwide sample of more than 161,000 patients, age 18 to 64, in employer-based health plans who underwent surgery between 2001 and 2002. Causes of Medication Errors: Drug interaction kills 180,000 people per year and injures up to 1,000,000 according to Eileen G. Holland, Pharm D. This leads to employers paying an estimated cost of more than $136 billion a year. And these numbers are increasing every year. Something as simple as the pharmacist not being able to read the physician’s handwriting correctly can lead to disaster. The patient needs to read the prescription and confirm what it is, and what it is supposed to do, before leaving the doctor’s office. People with kidney conditions, liver conditions, or known drug allergies were at the greatest risk. © 2009 Keith Center, Karen Mehl, Don Barker. All rights reserved. May not be duplicated, reproduced or retransmitted without permission www.masonbiz.com www.healthservicereview.com 21
  • 22. Reducing Company Health Cost – Draft 3 An Institute of Medicine report cites the following factors as causal in medication errors: Failure to alter a medication or dosage due to patient's reduced kidney or liver function (13.9%) A known allergy to same medication class (12.1%) Using the wrong drug name, dosage form, or abbreviation (11.4%) Incorrect dosage calculations (11.1%) Atypical or unusual and critical dosage frequency considerations (10.8%) Data indicates the greatest risk in prescription errors is from the doctor rather than the pharmacist, with estimates as follows: Prescribing errors (68%) Administration errors (25%) Supply errors (7%) The bottom line: Health care is complex and scary, you need a knowledgeable, caring, friend who can guide you through the maze. That’s what we at HSR do every day. © 2009 Keith Center, Karen Mehl, Don Barker. All rights reserved. May not be duplicated, reproduced or retransmitted without permission www.masonbiz.com www.healthservicereview.com 22
  • 23. Reducing Company Health Cost – Draft 3 Module II Three Actions to Reduce Company Health Cost © 2009 Keith Center, Karen Mehl, Don Barker. All rights reserved. May not be duplicated, reproduced or retransmitted without permission www.masonbiz.com www.healthservicereview.com 23
  • 24. Reducing Company Health Cost – Draft 3 © 2009 Keith Center, Karen Mehl, Don Barker. All rights reserved. May not be duplicated, reproduced or retransmitted without permission www.masonbiz.com www.healthservicereview.com 24
  • 25. Reducing Company Health Cost – Draft 3 Chapter Four Which Key Performance Indicators to Use? As documented earlier, the primary issues are quality, cost and availability of service. According to Midwest Business Group, poor quality health care results in $2,000 annual cost to employers per insured worker. So if you have 1,000 employees, the result is $2,000,000 additional annual cost due to poor quality. There is a balance between employee quality of life and the cost involved. The best quality health care, at the earliest point of intervention, will ultimately result in the lowest cost. Figure 10: Health Care Balance Healthcare Cost Employee Wellbeing . U. M R. C. TPA Disease Management C.M. is Case Management, U.R. is Utilization Review, TPA is the Third Party Administrator What makes medicine complex is the number of players in it. These can be divided into two categories. First there are providers of health care - hospitals, physicians, allied medical professionals. Second there are insurance professionals. - Brokers, Insurance Providers, Third Party Administrators and Preferred Provider Organizations. Just as you would develop measurements and a scorecard to run various elements of your business, you can also develop one for your health care plan. We will take you through the process of identifying the health care Key Performance Indicators (KPI’s) and how to get them. © 2009 Keith Center, Karen Mehl, Don Barker. All rights reserved. May not be duplicated, reproduced or retransmitted without permission www.masonbiz.com www.healthservicereview.com 25
  • 26. Reducing Company Health Cost – Draft 3 Setting Up Your Medical Management Dashboard In order to control costs for any area of business it is necessary to convert those vital few critical success factors into Key Performance Indicators (KPI’s). Managing your company’s health care cost is no different. Step One: Predictive Modeling Start with a baseline for your employees and their families. By this we mean, do an advanced health assessment of your employees by using advanced predictive modeling software. The insurance company, or medical management company, should have access to this type of software. The benefit to the employer is that this software will forecast potential cost impacts to the health plan. The way that this works is artificial intelligence software is utilized to assess the past two years of medical records and predict candidates for… 1. Health Promotion, or “Keeping low risk people healthy”* 2. Condition Management – “Just don’t get worse”* 3. Medical care management for advanced cases using Case Management, Disease Management and Utilization Review. *Dee Edington, University of Michigan Although most insurance carriers claim to use software of this nature, few have the trained staff to accurately set up the scripts to clearly identify the majority of people who are at risk. Also, there is a great variation in the predictive modeling software available today. Step Two: The True Key Performance Indicators KPI 1: Utilization Review This compares the request for medical services, or utilization, to treatment guidelines. The Key Performance Indicator for Utilization Review is Patient Days per 1,000. Utilization Review combines the Admissions Rate per 1,000 with Length of Stay per 1,000 to give a true indicator of hospital usage by patients. i.e. by employees and their dependents. This KPI is designed to control the use of acute care services. Inpatient stays are pre-certified, hospital stays are reviewed, and alerts for Case Management are generated in order to ensure the right care for quality of life. As a result, cost is also reduced by providing the right care at the right time. It’s more than watching the numbers. Done right, it is the monitoring of the treatment plan, and the patient’s compliance to their plan, that produces results. In our experience, by treating patients like family members, the quality of life for the patient is improved and the byproduct is reduced cost impact to the health plan. © 2009 Keith Center, Karen Mehl, Don Barker. All rights reserved. May not be duplicated, reproduced or retransmitted without permission www.masonbiz.com www.healthservicereview.com 26
  • 27. Reducing Company Health Cost – Draft 3 KPI 2: Case Management The Key Performance Indicator for Case Management (CM) is savings derived by managing the patient. The savings derived by Case Management is divided by the cost of that patient’s specific case. A typical return is a ratio of 10:1, or $10 in savings for every $1 spent on CM. Total Savings Case Management (CM) = ______________ Total Cost of Case Case Management is used when patient’s condition is severe, and as a result has the potential for a significant expenditure of health care plan dollars. The objective of medical case management is to evaluate the patient’s medical condition and develop and implement health care planning for the patient that coordinates medical resources communicates with the patient and monitors the patient’s progress. When done correctly, the result is improved patient health and healing. When combined with predictive modeling, “actuarial events” can be avoided and therefore costs to the plan are reduced while increasing patient’s quality of life. KPI 3: Disease Management The Key Performance Indicator for Disease Management (DM) is once again, Return on Investment. Total Savings Disease Management (DM) = ______________ Total Cost of Case A good program can produce a return of anywhere from 3:1 to 6:1. This variation in ROI is due to whether on not, a Wellness Program is integrated into DM. The objective of disease management is to improve the quality of life and cost of management of the most prevalent and major cost diseases. The main idea behind a disease management program is to focus on a set of chronic illnesses that are most amenable to management control. Some chronic diseases that lend themselves to cost management are as follows. Asthma COPD Diabetes Hypertension Hyperlipidemia (high cholesterol) Coronary Artery Disease Congestive Heart Failure Coronary Vascular Disease Obesity © 2009 Keith Center, Karen Mehl, Don Barker. All rights reserved. May not be duplicated, reproduced or retransmitted without permission www.masonbiz.com www.healthservicereview.com 27
  • 28. Reducing Company Health Cost – Draft 3 Medical management companies may monitor different diseases, but these are the most common in our opinion. A strong emphasis is must be placed on preventative care. As an employer, make sure that your employees are getting regular screenings, tests, such as PSA’s mammograms, colon cancer, diabetes, blood pressure, etc. to ensure that they are in the low risk category. KPI 4: Cost Per Member Per Month The last Key Performance Indicator is the one that almost all employers are tuned into, the Cost Per Member Per Month (PMPM). This KPI is actually the result of monitoring and managing the other KPI’s. The Cost per member per month is usually provided by the insurance provider. In our dashboard both health care plan PMPM and pharmaceutical PMPM are one consolidated number representing the total cost per member per month. The Medical Management Dashboard The following table shows how the above mentioned KPI’s work together, and compares HSR’s key metrics for all clients to the U.S. average. Table 1: Medical Management Dashboard Performance Metrics U.S. HSR HSR improvement over US average Admissions / 1000 62 48 22.6% Utilization Days / 1000 252 187.2 25.7% Review Length per stay 4.1 3.9 4.9% Case Management 10:1 30:1 300% Disease management 3:1 5:1 Health Care spend pmpm* $289 $225 22.1% *pmpm = Cost per member per month These metrics form the dashboard for measuring medical management performance. And as stated earlier, medical management is a major opportunity for mitigation of cost to any health plan. © 2009 Keith Center, Karen Mehl, Don Barker. All rights reserved. May not be duplicated, reproduced or retransmitted without permission www.masonbiz.com www.healthservicereview.com 28
  • 29. Reducing Company Health Cost – Draft 3 When large Case Management with Predictive Modeling, Utilization Review and Disease Management are combined, the result is a substantial cost control benefit to the employer. Use this dashboard to compare to how your plan is performing today. Your broker should be able to provide you with the data for each of these metrics. © 2009 Keith Center, Karen Mehl, Don Barker. All rights reserved. May not be duplicated, reproduced or retransmitted without permission www.masonbiz.com www.healthservicereview.com 29
  • 30. Reducing Company Health Cost – Draft 3 © 2009 Keith Center, Karen Mehl, Don Barker. All rights reserved. May not be duplicated, reproduced or retransmitted without permission www.masonbiz.com www.healthservicereview.com 30
  • 31. Reducing Company Health Cost – Draft 3 Chapter Five What to Do to Get Key Players Accountable? The information in your medical management dashboard will enable you to manage your health care spend and hold the different players accountable. Hospitals are the place where major costs occur, but the employer cannot manage hospital costs directly. However, by getting the KPI’s from the Insurance provider, the Preferred Provider Organization and the Insurance Broker, you can start to get control of costs. In this chapter, we will cover the key players and how to hold them accountable. Health Insurance Provider Employers Should Ask Insurance Providers: What are the hospital admissions per thousand? What are the hospital stay days per thousand? What is the average length of time per stay in days? What is my company’s health care spend per employee, per month? What is the ROI for Case Management? Case Management is particularly important because that is where the majority of the cost of health care comes from. By tracking over time the actual health care spend per employee per month, you can see the trend toward increasing cost, or lowering cost. Also, armed with these metrics, you can use them to negotiate annual renewals or new contracts with insurance providers. If and you and your employees have used the dashboard to measure the spend on health care, and your health care insurance provider increases the cost the following year, you should demand an explanation. Predictable Spend Model In addition to the above metrics, consider negotiating a three year plan with your health care insurance provider using existing health care strategists, underwriters and predictive modeling software. This will result in a plan that provides the health care needs of your business over a predictable, three year timeframe. Renegotiation points could also be established so the cost could be smoothed out over a longer timeframe. This chart shows an example of the impact of implementing all the previous steps. © 2009 Keith Center, Karen Mehl, Don Barker. All rights reserved. May not be duplicated, reproduced or retransmitted without permission www.masonbiz.com www.healthservicereview.com 31
  • 32. Reducing Company Health Cost – Draft 3 Figure 11: Flattening Health Care Costs Initially this plan had a higher cost than the U.S. average. But through use of predictive modeling, the dashboard, and a predictable spend payment schedule, rising health plan costs were quickly brought under control. Note that the slight increase after the third year is dramatically below the U.S. average. Hospitals We have already identified two basic KPI’s for hospitals, a quality rating determined by infection rates, mortality rates, etc., and also cost. There are a number of sources for quality measurements. Most states have agencies that track hospital quality. Many of these are listed on the Useful Internet Links section. The other Key Performance Indicator is a little harder to get, and that is cost. Hospitals are not very transparent with respect to cost and most do not reveal the cost until they present the patient with a bill. The ideal situation, is to know what they cost before your employee goes there. If you know the relative cost of hospitals where your employees are located, you can let them know in advance which hospitals are going to cost them the least, balanced with quality measurements. Once again, the Insurance Provider, the Preferred Provider Organization or the Insurance Broker should be able to provide you with this information. Of course, if the hospital costs the employee less, then the impact on the health care plan is also less. © 2009 Keith Center, Karen Mehl, Don Barker. All rights reserved. May not be duplicated, reproduced or retransmitted without permission www.masonbiz.com www.healthservicereview.com 32
  • 33. Reducing Company Health Cost – Draft 3 Medical Billing According to Kenneth W. Harvey, 80% to 90% of all hospital bills are incorrect. This impacts the patient’s out of pocket costs, and ultimately what you as the employer, pay for health care insurance. White Paper By Kenneth W. Harvey, Corporate Benefit Services, Inc., May 2006 If your company is self funded, your Third Party Administrator (TPA) should be getting audits done in order to reduce cost to themselves, as well as to you as their client. Employers Should Ask Their Insurance Provider: Which providers (hospitals, physicians, ambulatory care facilities, etc.) do your employees use the most? - Rank provider by the frequency of use - Total cost by provider - Cost/frequency ratio What are the results of your audits for the hospitals my people primarily use? The three areas of audit are quality, cost and billing accuracy? So Where Do I Get These Two Measurements? You should be able to get this information from your health insurance provider, or broker. And ask how you can know if the numbers give a fair and accurate comparison. The broker has access to this information via the PPO. If the broker doesn’t know how to ask for the comparative information and get it, then perhaps you need a broker. The PPO, Preferred Provider Organization: It’s their job to track costs, but they may refuse to give the data to you. In any case, it is reasonable to expect to get the data from your insurance provider. Other Ways to Get Hospital Cost and Quality Comparisons A good website that we’ve found gives both quality and cost metrics is www.leapfrog.org. This is a non-profit organization that tracks quality and cost. It is mostly funded by insurance providers. However, there is no incentive for hospitals to participate by providing cost metrics. Although the list of hospitals reporting cost is growing, there are relatively few hospitals providing this data in some areas. © 2009 Keith Center, Karen Mehl, Don Barker. All rights reserved. May not be duplicated, reproduced or retransmitted without permission www.masonbiz.com www.healthservicereview.com 33
  • 34. Reducing Company Health Cost – Draft 3 Preferred Provider Organization (PPO) Employers Should Ask PPO’s: List the hospitals in the PPO network? What are the relative costs for each hospital and how are they measured? What are the consumers saying? What is their technical quality like? What are their specialties? The role of the PPO, Preferred Provider Organization, is to negotiate discounts with providers - physicians, hospitals, and other allied medical professionals. These reduced rates are given to the insurer's or administrator's clients. Table 2: Typical Rates: Health Care Category Company Avg. PPO Discount Physician 20% to 50% Hospital Inpatient 17% to 50% Hospital Outpatient 15% to 45% Hospital ER 15% to 35% Note that the discount rate becomes meaningless if there is a great disparity in the actual pricing of the hospital network. The discount rates may look good, but are they really? To illustrate this point, let’s look at an example of four hospitals within the same county. A “market basket” sample of 10 outpatient procedures (including surgeries), was put together and the hospitals asked to provide total costs. The results are shown in the table below. Table 3: Hospital Cost Comparison Hospital Average Outpatient Procedure Cost A $1,800 B $1,900 C $3,800 D $5,800 As can be seen, the variance in the average cost is rather dramatic. The highest cost hospital is three times the cost of the lowest. These hospitals were all approved by the same PPO, so if © 2009 Keith Center, Karen Mehl, Don Barker. All rights reserved. May not be duplicated, reproduced or retransmitted without permission www.masonbiz.com www.healthservicereview.com 34
  • 35. Reducing Company Health Cost – Draft 3 your employee was to call the PPO they would be told that the hospital is in the network and their health plan would apply. Assume for the moment that all have the same quality. If your employees decided to go to Hospital D because it is closer, or their physician wanted to do the surgery at Hospital D because they practice at that hospital. Even if your employees stay within the network, you pay more for the health care plan and your employees are paying more out of pocket. You both take a big hit, in this case an additional $4,000 for the average cost. Repeat this often enough and it’s no wonder that your health plan increases dramatically every year. It is quality, cost and availability that are important. And an educated employee will make the best decision for their family’s health care based on quality of the care, then out of pocket cost. Even if the PPO includes all hospitals, the patient, needs to be made aware of what their out of pocket would be for each hospital so they can make an informed decision. An educated employee who knows they are not sacrificing quality by getting a lower cost service will purchase from Hospital A, or B, not the high cost Hospital D. Quality There are two primary quality rating systems that one should be aware of. 1. Consumer ratings, or customer satisfaction reports 2. Technical quality, or clinical performance measures Consumer Ratings: One of the better sources of consumer ratings is Consumer Assessment of Health Plans (CAHPS). There are many other surveys based on this. Technical Quality: In this area the Health Plan Employer Data and Information Set (HEDIS) looks at how well a health care organization prevents and treats illness. It also includes questions from the CAHPS survey mentioned above. What to Do to Get Your Broker Working For You Most businesses insure their health plan through a broker that acts as a consultant on health care insurance or a sales rep working for a health care insurance company. These people have the objective to be perceived as the trusted advisor in all insurance matters. They make commission from the sale of policies and benefit from increases in insurance premiums, the overall cost that they add in the grand scheme of health care is not that great, but to the individual small business owner it could represent a sizeable chunk of cost. For this reason, there is a current trend in business for companies to put their broker on a flat fee basis. In this way there is a predictable cost. Also, the broker enhances their position as a trusted advisor on health care insurance products. © 2009 Keith Center, Karen Mehl, Don Barker. All rights reserved. May not be duplicated, reproduced or retransmitted without permission www.masonbiz.com www.healthservicereview.com 35
  • 36. Reducing Company Health Cost – Draft 3 Employers Should Ask Brokers: Who are the PPO’s and HMO’s? In other words, the options. What are the best health plans in this area and why? Which hospitals are in / not in the network? Provide relative cost data for each hospital Provide relative quality data for each hospital Rank them according to how they do at keeping people well and getting them better. What is the case management ratio of dollars spent to dollars saved by each PPO or HMO? Third Party Administrator (TPA) TPA’s are one of the best kept secrets in the country. Many people do not know TPA firms exist…yet about 2/3 of all employee benefit plans in the U.S. use some kind of TPA out-sourcing services. Personalized service is the key to TPAs’ success. A third party administrator (TPA) is an organization that processes insurance claims or certain aspects of employee benefit plans for a company or union. This can be viewed as “outsourcing” the administration of the claims processing, since the TPA is performing a task traditionally handled by the company providing the insurance or the company itself. Often, in the case of insurance claims, a TPA handles the claims processing for an employer that self-insures its employees. Thus, the employer is acting as an insurance company and underwrites the risk. The risk of loss remains with the employer, and not with the TPA. The employer may also contract with a reinsurer to pay amounts in excess of a certain threshold, in order to share the risk for potential catastrophic claims. Third party administrators are prominent players in the managed care industry and have the expertise and capability to administer all or a portion of the claims process. They are normally contracted by a health insurer or self-insuring companies to administer services, including claims administration, premium collection, enrollment and other administrative activities. TPA’s have a relationship with their clients much like that of their sister professions CPA and law firms. Too many people wrongly think of TPA’s being like the insurance industry. Instead, the relationship resembles that between an employer or plan and their independent CPA firm or outside law firm with retainer. In both cases….like the relationship between TPA’s and their clients….the service is on an ongoing, personalized closely-involved, long term basis. The difference between TPA’s and consulting firms is that the TPA provides a variety of services to the whole plan + implements it + operates it on an on-going basis. Obviously, the TPA does lots of consulting in this process. TPA’s are especially known for their responsiveness and close personalized service to client plans and participants. This means that claims are usually processed and finalized © 2009 Keith Center, Karen Mehl, Don Barker. All rights reserved. May not be duplicated, reproduced or retransmitted without permission www.masonbiz.com www.healthservicereview.com 36
  • 37. Reducing Company Health Cost – Draft 3 in shorter periods of time, questions are handled promptly, and plans can be adapted as the wants and needs of the client plan change. A related advantage of the flexibility and personalized service of TPA’s comes in the area of efficiency and cost-containment. The personalized (and often geographically close) service from TPA’s tends to spot obvious errors or abuses (such as everyone who goes to Dr. X ends up getting some untraceable diagnosis, like an appendectomy, no matter what the original ailment might have been). It also means that a senior person of that TPA firm is readily available to cut red tape to help an employer or patient get things straightened out, or brain-storm about other options. Finally, I would attribute much of the success of the TPA business to the spirit of the people. It is still a fresh and dynamic industry. TPA’s and self-funding are not widely known and understood. For all these reasons, SPBA TPA’s attract a special niche of employers. They have roughly 75 to 4,000 workers. At this size, it means that the boss tends to see the workers often in the parking lot, or in town, or at church or at the PTA. The boss tends to have a caring & protective feeling towards the employees and plan design. The future for TPA’s is bright. Their flexibility, adaptability, compact management, low overhead and entrepreneur-like spirit mean that they can roll with the punches (and usually prosper from them). TPA’s are also perfectly positioned to maximize the rise in new innovations of health plans, which are usually very eager to have cost-effective administrative expertise. © 2009 Keith Center, Karen Mehl, Don Barker. All rights reserved. May not be duplicated, reproduced or retransmitted without permission www.masonbiz.com www.healthservicereview.com 37
  • 38. Reducing Company Health Cost – Draft 3 © 2009 Keith Center, Karen Mehl, Don Barker. All rights reserved. May not be duplicated, reproduced or retransmitted without permission www.masonbiz.com www.healthservicereview.com 38
  • 39. Reducing Company Health Cost – Draft 3 Chapter Six Empower Your Employees to Reduce Cost When patients become educated consumers their cost to the health plan becomes lower. Also, out of pocket costs to the employee are reduced. For these reasons, we recommend that your employees seek guidance from the health plan administrator in making decisions. They will also get better educated on their condition, what protocols they should be receive. The plan administrator will also provide a double check on the medication to ensure that the right prescription has been filled. What follows are ideas for both the patient and the employer for increasing quality of health care. As a result, this will reduce the cost and ensure that they are getting the right health care at the right time. Medication Errors Something as simple as the pharmacist not being able to read the physician’s handwriting correctly can lead to disaster. The patient needs to read the prescription, confirm what it is, and what it is supposed to do, before leaving the doctor’s office. Causes of medication errors: People with kidney conditions, liver conditions, or known drug allergies were at the greatest risk. An Institute of Medicine report cites the following factors as causal in medication errors: Failure to alter a medication, or dosage, due to a patient's reduced kidney or liver function (13.9%) Known allergy to same medication class (12.1%) Using the wrong drug name, dosage form, or abbreviation (11.4%) Incorrect dosage calculations (11.1%) Atypical or unusual and critical dosage frequency considerations (10.8%) Data indicates the greatest risk in prescription errors is from the doctor rather than the pharmacist, with estimates as follows: Prescribing errors (68%) Administration errors (25%) Supply errors (7%) © 2009 Keith Center, Karen Mehl, Don Barker. All rights reserved. May not be duplicated, reproduced or retransmitted without permission www.masonbiz.com www.healthservicereview.com 39
  • 40. Reducing Company Health Cost – Draft 3 Choosing a hospital Patients Should Ask: Which hospital has the best care for my condition? Is this hospital covered by my health insurance? Does the hospital meet national quality standards? How does the hospital compare with others in my area? Has the hospital had success with my condition? Does my clinician have privileges (is allowed to work) at this hospital? How well does the hospital check and improve on its own quality of care? Physician How to find a good quality physician/clinician? When it comes to specialists your employees really need to seek guidance. As mentioned before, “Rule Out Medicine” wastes the patient’s time and money and also burns through health plan funding, driving up annual costs. Patients Should Ask: Is this clinician part of my health plan? Does this clinician have the background and training I need? Is this clinician able to work at the hospital I like? Can I talk to this clinician and ask questions easily? Does this clinician listen to me? Does this clinician wash his or her hands between examining each patient? This last question may seem a little odd. However, according to a University of Geneva study cited in the Annals of Internal Medicine, 61% of doctors wash their hands before examining a patient if they know someone is watching, and only 44% wash their hands if they think no one is watching. If the clinicians are not good examples with hand washing then this sets the tone for others who care for patients, further contributing to infection rates. Considering that infection is the number one cause of death in hospitals, this becomes a very important question. Note: Chapter Six has a series of questions that patients and their families need to be aware of when discussing treatment with a physician. The list of questions was developed by the U.S. Department of Health and Human Services, Agency for Healthcare Research and Quality (AHRQ). It covers the following areas. Did your clinician give you a prescription? Are you scheduled to have medical tests? Did you recently receive a diagnosis? Are you considering treatment for an illness or condition? Did your clinician recently recommend surgery? Are you choosing a health plan? Are you choosing a clinician? Are you choosing a hospital? Are you choosing long-term care? Please see Chapter Six for more detailed information on preparing your employees for a medical appointment. © 2009 Keith Center, Karen Mehl, Don Barker. All rights reserved. May not be duplicated, reproduced or retransmitted without permission www.masonbiz.com www.healthservicereview.com 40
  • 41. Reducing Company Health Cost – Draft 3 Five Steps to Safer Health Care Patient Fact Sheet Patient safety is one of the Nation's most pressing health care challenges. A 1999 report by the Institute of Medicine estimates that as many as 44,000 to 98,000 people die in U.S. hospitals each year as the result of lapses in patient safety. In 2001 through 2003 a study of 37 Million patient records by HealthGrades showed that the number is more like 195,000 deaths per year due to potentially preventable, in-hospital medical events. This fact sheet tells what you can do to get safer health care. It was developed by the U.S. Department of Health and Human Services in partnership with the American Hospital Association and the American Medical Association. 1. Ask questions if you have doubts or concerns. Ask questions and make sure you understand the answers. Choose a doctor you feel comfortable talking to. Take a relative or friend with you to help you ask questions and understand the answers. 2. Keep and bring a list of ALL the medicines you take. Give your doctor and pharmacist a list of all the medicines that you take, including non-prescription medicines. Tell them about any drug allergies you have. Ask about side effects and what to avoid while taking the medicine. Read the label when you get your medicine, including all warnings. Make sure your medicine is what the doctor ordered and know how to use it. Ask the pharmacist about your medicine if it looks different than you expected. 3. Get the results of any test or procedure. Ask when and how you will get the results of tests or procedures. Don't assume the results are fine if you do not get them when expected, be it in person, by phone, or by mail. Call your doctor and ask for your results. Ask what the results mean for your care. 4. Talk to your doctor about which hospital is best for your health needs. Ask your doctor about which hospital has the best care and results for your condition if you have more than one hospital to choose from. Be sure you understand the instructions you get about follow up care when you leave the hospital. 5. Make sure you understand what will happen if you need surgery. Make sure you, your doctor, and your surgeon all agree on exactly what will be done during the operation. Ask your doctor, "Who will manage my care when I am in the hospital?" Ask your surgeon: Exactly what will you be doing? About how long will it take? What will happen after the surgery? How can I expect to feel during recovery? Tell the surgeon, anesthesiologist, and nurses about any allergies, bad reaction to anesthesia, and any medications you are taking. © 2009 Keith Center, Karen Mehl, Don Barker. All rights reserved. May not be duplicated, reproduced or retransmitted without permission www.masonbiz.com www.healthservicereview.com 41
  • 42. Reducing Company Health Cost – Draft 3 More Information For more information, go to: http://www.ahrq.gov/questionsaretheanswer Source: U.S. Department of Health and Human Services, AHRQ Agency for Healthcare Research and Quality www.ahrq.gov © 2009 Keith Center, Karen Mehl, Don Barker. All rights reserved. May not be duplicated, reproduced or retransmitted without permission www.masonbiz.com www.healthservicereview.com 42
  • 43. Reducing Company Health Cost – Draft 3 20 Tips to Help Prevent Medical Errors Patient Fact Sheet Medical errors are one of the Nation's leading causes of death and injury. A recent report by the Institute of Medicine estimates that as many as 44,000 to 98,000 people die in U.S. hospitals each year as the result of medical errors. This means that more people die from medical errors than from motor vehicle accidents, breast cancer, or AIDS. Government agencies, purchasers of group health care, and health care providers are working together to make the U.S. health care system safer for patients and the public. This fact sheet tells what you can do. What are Medical Errors? Medical errors happen when something that was planned as a part of medical care doesn't work out, or when the wrong plan was used in the first place. Medical errors can occur anywhere in the health care system: • Hospitals. • Clinics. • Outpatient Surgery Centers. • Doctors' Offices. • Nursing Homes. • Pharmacies. • Patients' Homes. Errors can involve: Medicines. Surgery. Diagnosis. Equipment. Lab reports. They can happen during even the most routine tasks, such as when a hospital patient on a salt- free diet is given a high-salt meal. Most errors result from problems created by today's complex health care system. But errors also happen when doctors and their patients have problems communicating. For example, a recent study supported by the Agency for Healthcare Research and Quality (AHRQ) found that doctors often do not do enough to help their patients make informed decisions. Uninvolved and uninformed patients are less likely to accept the doctor's choice of treatment and less likely to do what they need to do to make the treatment work. © 2009 Keith Center, Karen Mehl, Don Barker. All rights reserved. May not be duplicated, reproduced or retransmitted without permission www.masonbiz.com www.healthservicereview.com 43
  • 44. Reducing Company Health Cost – Draft 3 What Can You Do? Be Involved in Your Health Care 1. The single most important way you can help to prevent errors is to be an active member of your health care team. That means taking part in every decision about your health care. Research shows that patients who are more involved with their care tend to get better results. Some specific tips, based on the latest scientific evidence about what works best, follow. Medicines 2. Make sure that all of your doctors know about everything you are taking. This includes prescription and over-the-counter medicines, and dietary supplements such as vitamins and herbs. At least once a year, bring all of your medicines and supplements with you to your doctor. "Brown bagging" your medicines can help you and your doctor talk about them and find out if there are any problems. It can also help your doctor keep your records up to date, which can help you get better quality care. 3. Make sure your doctor knows about any allergies and adverse reactions you have had to medicines. This can help you avoid getting a medicine that can harm you. 4. When your doctor writes you a prescription, make sure you can read it. If you can't read your doctor's handwriting, your pharmacist might not be able to either. 5. Ask for information about your medicines in terms you can understand—both when your medicines are prescribed and when you receive them. • What is the medicine for? • How am I supposed to take it, and for how long? • What side effects are likely? What do I do if they occur? • Is this medicine safe to take with other medicines or dietary supplements I am taking? • What food, drink, or activities should I avoid while taking this medicine? 6. When you pick up your medicine from the pharmacy, ask: “Is this the medicine that my doctor prescribed?” A study by the Massachusetts College of Pharmacy and Allied Health Sciences found that 88 percent of medicine errors involved the wrong drug or the wrong dose. 7. If you have any questions about the directions on your medicine labels, ask. Medicine labels can be hard to understand. For example, ask if "four doses daily" means taking a dose every 6 hours around the clock or just during regular waking hours. © 2009 Keith Center, Karen Mehl, Don Barker. All rights reserved. May not be duplicated, reproduced or retransmitted without permission www.masonbiz.com www.healthservicereview.com 44
  • 45. Reducing Company Health Cost – Draft 3 8. Ask your pharmacist for the best device to measure your liquid medicine. Also, ask questions if you're not sure how to use it. Research shows that many people do not understand the right way to measure liquid medicines. For example, many use household teaspoons, which often do not hold a true teaspoon of liquid. Special devices, like marked syringes, help people to measure the right dose. Being told how to use the devices helps even more. 9. Ask for written information about the side effects your medicine could cause. If you know what might happen, you will be better prepared if it does—or, if something unexpected happens instead. That way, you can report the problem right away and get help before it gets worse. A study found that written information about medicines can help patients recognize problem side effects and then give that information to their doctor or pharmacist. Hospital Stays 10. If you have a choice, choose a hospital at which many patients have the procedure or surgery you need. Research shows that patients tend to have better results when they are treated in hospitals that have a great deal of experience with their condition. 11. If you are in a hospital, consider asking all health care workers who have direct contact with you whether they have washed their hands. Hand washing is an important way to prevent the spread of infections in hospitals. Yet, it is not done regularly or thoroughly enough. A recent study found that when patients checked whether health care workers washed their hands, the workers washed their hands more often and used more soap. 12. When you are being discharged from the hospital, ask your doctor to explain the treatment plan you will use at home. This includes learning about your medicines and finding out when you can get back to your regular activities. Research shows that at discharge time, doctors think their patients understand more than they really do about what they should or should not do when they return home. Surgery 13. If you are having surgery, make sure that you, your doctor, and your surgeon all agree and are clear on exactly what will be done. Doing surgery at the wrong site (for example, operating on the left knee instead of the right) is rare. But even once is too often. The good news is that wrong-site surgery is 100 percent preventable. The American Academy of Orthopaedic Surgeons urges its members to sign their initials directly on the site to be operated on before the surgery. © 2009 Keith Center, Karen Mehl, Don Barker. All rights reserved. May not be duplicated, reproduced or retransmitted without permission www.masonbiz.com www.healthservicereview.com 45