More Related Content
Similar to Finance projection 1.1
Similar to Finance projection 1.1 (20)
Finance projection 1.1
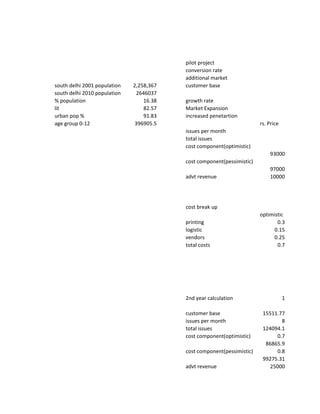
- 1. pilot project
conversion rate
additional market
south delhi 2001 population 2,258,367 customer base
south delhi 2010 population 2646037
% population 16.38 growth rate
lit 82.57 Market Expansion
urban pop % 91.83 increased penetartion
age group 0-12 396905.5 rs. Price
issues per month
total issues
cost component(optimistic)
93000
cost component(pessimistic)
97000
advt revenue 10000
cost break up
optimistic
printing 0.3
logistic 0.15
vendors 0.25
total costs 0.7
2nd year calculation 1
customer base 15511.77
issues per month 8
total issues 124094.1
cost component(optimistic) 0.7
86865.9
cost component(pessimistic) 0.8
99275.31
advt revenue 25000
- 3. 1 2 3 4 5 6 7 8
10000 11000 12100 13310 14641 16105.1 17715.61 19487.17
30% 0.315 0.3276 0.340704 0.354332 0.368505 0.383246 0.402408
1000 1100 1210 1331 1464.1 1610.51 1771.561
3000 3465 3963.96 4534.77 5187.777 5934.817 6789.431 7841.792
0.1 0.1 0.1 0.1 0.1 0.1 0.1 0.1
0.05 0.04 0.04 0.04 0.04 0.04 0.05 0.05
1 1 1 1 1 1 1 1
4 8 8 8 8 8 8 8
12000 27720 31711.68 36278.16 41502.22 47478.54 54315.45 62734.34
0.7 0.7 0.7 0.7 0.7 0.7 0.7 0.7
8400 19404 22198.176 25394.71 29051.55 33234.98 38020.81 43914.04
0.8 0.8 0.8 0.8 0.8 0.8 0.8 0.8
9600 22176 25369.344 29022.53 33201.77 37982.83 43452.36 50187.47
10000 10000 10000 10000 10000 10000 20000 20000
intial expenditure
pessimistic optimistic pessimistic
0.3 cost 0.7 0.8
0.25 Free issues 40000 40000
0.25 total cost 28000 32000
0.8 questionnaire 10000 10000
other advt material 15000 15000
93000 97000
2 3 4 5 6 7 8 9
17574.83 19912.28 22560.61853 25561.18 28960.82 32812.61 37176.68 42121.18
8 8 8 8 8 8 8 8
140598.7 159298.3 180484.9483 204489.4 231686.5 262500.9 297413.5 336969.5
0.7 0.7 0.7 0.7 0.7 0.7 0.7 0.7
98419.06 111508.8 126339.4638 143142.6 162180.6 183750.6 208189.4 235878.6
0.8 0.8 0.8 0.8 0.8 0.8 0.8 0.8
112478.9 127438.6 144387.9586 163591.6 185349.2 210000.7 237930.8 269575.6
25000 25000 25000 25000 25000 30000 30000 30000
- 5. 9 10 11 12
21435.89 23579.48 25937.42 28531.17
0.422528 0.443655 0.461401 0.479857
1948.717 2143.589 2357.948 2593.742
9057.27 10461.15 11967.55 13690.88
0.1 0.1 0.1 0.1
0.05 0.04 0.04 0.03
1 1 1 1
8 8 8 8
72458.16 83689.18 95740.42 109527 675155.2
0.7 0.7 0.7 0.7
50720.71 58582.42 67018.29 76668.93 565608.6
0.8 0.8 0.8 0.8
57966.53 66951.34 76592.34 87621.63 637124.1
20000 20000 20000 20000 190000
yearly profit
optimistic 299546.6
pessimistic 228031
growth rate for second year
13.30%
10 11 12
47723.3 54070.5 61261.87
8 8 8
381786.4 432564 490095 3241981
0.7 0.7 0.7
267250.5 302794.8 343066.5 2269387
0.8 0.8 0.8
305429.1 346051.2 392076 2593585
30000 30000 30000 330000