SlideShare a Scribd company logo
1 of 49
Download to read offline
Gender * Interactive
Crosstab
Interactive Total
1.00 2.00
Gender
1.00
Count 1 4 5
% within
Gender
20.0% 80.0% 100.0%
% within
Interactive
100.0% 36.4% 41.7%
% of Total 8.3% 33.3% 41.7%
2.00
Count 0 7 7
% within
Gender
0.0% 100.0% 100.0%
% within
Interactive
0.0% 63.6% 58.3%
% of Total 0.0% 58.3% 58.3%
Total
Count 1 11 12
% within
Gender
8.3% 91.7% 100.0%
% within
Interactive
100.0% 100.0% 100.0%
% of Total 8.3% 91.7% 100.0%
Gender * Informative
Crosstab
Informative Total
1.00 2.00 3.00
Gender 1.00 Count 2 1 2 5
% within
Gender
40.0% 20.0% 40.0% 100.0%
% within
Informative
33.3% 33.3% 66.7% 41.7%
% of Total 16.7% 8.3% 16.7% 41.7%
2.00
Count 4 2 1 7
% within
Gender
57.1% 28.6% 14.3% 100.0%
% within
Informative
66.7% 66.7% 33.3% 58.3%
% of Total 33.3% 16.7% 8.3% 58.3%
Total
Count 6 3 3 12
% within
Gender
50.0% 25.0% 25.0% 100.0%
% within
Informative
100.0% 100.0% 100.0% 100.0%
% of Total 50.0% 25.0% 25.0% 100.0%
Gender * Organized
Crosstab
Organized Total
1.00 2.00
Gender
1.00
Count 0 5 5
% within
Gender
0.0% 100.0% 100.0%
% within
Organized
0.0% 45.5% 41.7%
% of Total 0.0% 41.7% 41.7%
2.00 Count 1 6 7
% within
Gender
14.3% 85.7% 100.0%
% within
Organized
100.0% 54.5% 58.3%
% of Total 8.3% 50.0% 58.3%
Total
Count 1 11 12
% within
Gender
8.3% 91.7% 100.0%
% within
Organized
100.0% 100.0% 100.0%
% of Total 8.3% 91.7% 100.0%
Gender * WebsiteUses
Crosstab
WebsiteUs
es
Total
1.00 2.00 3.00
Gender
1.00
Count 3 2 0 5
% within
Gender
60.0% 40.0% 0.0% 100.0%
% within
WebsiteUs
es
37.5% 66.7% 0.0% 41.7%
% of Total 25.0% 16.7% 0.0% 41.7%
2.00
Count 5 1 1 7
% within
Gender
71.4% 14.3% 14.3% 100.0%
% within
WebsiteUs
es
62.5% 33.3% 100.0% 58.3%
% of Total 41.7% 8.3% 8.3% 58.3%
Total Count 8 3 1 12
% within
Gender
66.7% 25.0% 8.3% 100.0%
% within
WebsiteUs
es
100.0% 100.0% 100.0% 100.0%
% of Total 66.7% 25.0% 8.3% 100.0%
Chi-Square Tests
Value df Asymp. Sig. (2-sided)
Pearson
Chi-
Square
1.543 2 .462
Likelihood
Ratio
1.897 2 .387
Linear-by-
Linear
Associatio
n
.005 1 .942
N of Valid
Cases
12
Gender * PerceptionMihaylo
Crosstab
Perception
Mihaylo
Total
1.00 2.00
Gender 1.00 Count 5 0 5
% within
Gender
100.0% 0.0% 100.0%
% within
Perception
Mihaylo
45.5% 0.0% 41.7%
% of Total 41.7% 0.0% 41.7%
2.00
Count 6 1 7
% within
Gender
85.7% 14.3% 100.0%
% within
Perception
Mihaylo
54.5% 100.0% 58.3%
% of Total 50.0% 8.3% 58.3%
Total
Count 11 1 12
% within
Gender
91.7% 8.3% 100.0%
% within
Perception
Mihaylo
100.0% 100.0% 100.0%
% of Total 91.7% 8.3% 100.0%
Gender * Facebook
Crosstab
Facebook Total
1.00 2.00
Gender
1.00
Count 2 3 5
% within
Gender
40.0% 60.0% 100.0%
% within
Facebook
28.6% 60.0% 41.7%
% of Total 16.7% 25.0% 41.7%
2.00 Count 5 2 7
% within
Gender
71.4% 28.6% 100.0%
% within
Facebook
71.4% 40.0% 58.3%
% of Total 41.7% 16.7% 58.3%
Total
Count 7 5 12
% within
Gender
58.3% 41.7% 100.0%
% within
Facebook
100.0% 100.0% 100.0%
% of Total 58.3% 41.7% 100.0%
Gender * Twitter
Crosstab
Twitter Total
1.00 2.00
Gender
1.00
Count 1 4 5
% within
Gender
20.0% 80.0% 100.0%
% within
Twitter
20.0% 57.1% 41.7%
% of Total 8.3% 33.3% 41.7%
2.00
Count 4 3 7
% within
Gender
57.1% 42.9% 100.0%
% within
Twitter
80.0% 42.9% 58.3%
% of Total 33.3% 25.0% 58.3%
Total
Count 5 7 12
% within
Gender
41.7% 58.3% 100.0%
% within
Twitter
100.0% 100.0% 100.0%
% of Total 41.7% 58.3% 100.0%
Gender * LinkedIn
Crosstab
LinkedIn Total
1.00 2.00
Gender
1.00
Count 3 2 5
% within
Gender
60.0% 40.0% 100.0%
% within
LinkedIn
42.9% 40.0% 41.7%
% of Total 25.0% 16.7% 41.7%
2.00
Count 4 3 7
% within
Gender
57.1% 42.9% 100.0%
% within
LinkedIn
57.1% 60.0% 58.3%
% of Total 33.3% 25.0% 58.3%
Total
Count 7 5 12
% within
Gender
58.3% 41.7% 100.0%
% within
LinkedIn
100.0% 100.0% 100.0%
% of Total 58.3% 41.7% 100.0%
Gender * Instagram
Crosstab
Instagram Total
1.00 2.00
Gender 1.00 Count 1 4 5
% within
Gender
20.0% 80.0% 100.0%
% within
Instagram
50.0% 40.0% 41.7%
% of Total 8.3% 33.3% 41.7%
2.00
Count 1 6 7
% within
Gender
14.3% 85.7% 100.0%
% within
Instagram
50.0% 60.0% 58.3%
% of Total 8.3% 50.0% 58.3%
Total
Count 2 10 12
% within
Gender
16.7% 83.3% 100.0%
% within
Instagram
100.0% 100.0% 100.0%
% of Total 16.7% 83.3% 100.0%
Gender * WhyCSUF
Crosstab
WhyCSUF
1.00 2.00 3.00 4.00 5.00
Gender
1.00
Count 4 0 1 0 0
% within
Gender
80.0% 0.0% 20.0% 0.0% 0.0%
% within
WhyCSUF
57.1% 0.0% 50.0% 0.0% 0.0%
% of Total 33.3% 0.0% 8.3% 0.0% 0.0%
2.00 Count 3 1 1 1 1
% within
Gender
42.9% 14.3% 14.3% 14.3% 14.3%
% within
WhyCSUF
42.9% 100.0% 50.0% 100.0% 100.0%
% of Total 25.0% 8.3% 8.3% 8.3% 8.3%
Total
Count 7 1 2 1 1
% within
Gender
58.3% 8.3% 16.7% 8.3% 8.3%
% within
WhyCSUF
100.0% 100.0% 100.0% 100.0% 100.0%
% of Total 58.3% 8.3% 16.7% 8.3% 8.3%
Crosstab
Total
Gender
1.00
Count 5
% within Gender 100.0%
% within WhyCSUF 41.7%
% of Total 41.7%
2.00
Count 7
% within Gender 100.0%
% within WhyCSUF 58.3%
% of Total 58.3%
Total
Count 12
% within Gender 100.0%
% within WhyCSUF 100.0%
% of Total 100.0%
Gender * UseServices
Crosstab
UseServic
es
Total
1.00 2.00 3.00 4.00
Gender
1.00
Count 0 1 2 2 5
% within
Gender
0.0% 20.0% 40.0% 40.0% 100.0%
% within
UseServic
es
0.0% 50.0% 66.7% 40.0% 41.7%
% of Total 0.0% 8.3% 16.7% 16.7% 41.7%
2.00
Count 2 1 1 3 7
% within
Gender
28.6% 14.3% 14.3% 42.9% 100.0%
% within
UseServic
es
100.0% 50.0% 33.3% 60.0% 58.3%
% of Total 16.7% 8.3% 8.3% 25.0% 58.3%
Total
Count 2 2 3 5 12
% within
Gender
16.7% 16.7% 25.0% 41.7% 100.0%
% within
UseServic
es
100.0% 100.0% 100.0% 100.0% 100.0%
% of Total 16.7% 16.7% 25.0% 41.7% 100.0%
Gender * TimesAdvising
Crosstab
TimesAdvi
sing
Total
2.00 3.00 4.00
Gender 1.00 Count 3 0 2 5
% within
Gender
60.0% 0.0% 40.0% 100.0%
% within
TimesAdvi
sing
42.9% 0.0% 50.0% 41.7%
% of Total 25.0% 0.0% 16.7% 41.7%
2.00
Count 4 1 2 7
% within
Gender
57.1% 14.3% 28.6% 100.0%
% within
TimesAdvi
sing
57.1% 100.0% 50.0% 58.3%
% of Total 33.3% 8.3% 16.7% 58.3%
Total
Count 7 1 4 12
% within
Gender
58.3% 8.3% 33.3% 100.0%
% within
TimesAdvi
sing
100.0% 100.0% 100.0% 100.0%
% of Total 58.3% 8.3% 33.3% 100.0%
Gender * ConcentrationCenter
Crosstab
Concentrat
ionCenter
Total
1.00 2.00
Gender 1.00 Count 1 4 5
% within
Gender
20.0% 80.0% 100.0%
% within
Concentrat
ionCenter
50.0% 40.0% 41.7%
% of Total 8.3% 33.3% 41.7%
2.00
Count 1 6 7
% within
Gender
14.3% 85.7% 100.0%
% within
Concentrat
ionCenter
50.0% 60.0% 58.3%
% of Total 8.3% 50.0% 58.3%
Total
Count 2 10 12
% within
Gender
16.7% 83.3% 100.0%
% within
Concentrat
ionCenter
100.0% 100.0% 100.0%
% of Total 16.7% 83.3% 100.0%
Gender * UseTutorCenter
Crosstab
UseTutorC
enter
Total
1.00 2.00
Gender
1.00
Count 2 3 5
% within
Gender
40.0% 60.0% 100.0%
% within
UseTutorC
enter
25.0% 75.0% 41.7%
% of Total 16.7% 25.0% 41.7%
2.00 Count 6 1 7
% within
Gender
85.7% 14.3% 100.0%
% within
UseTutorC
enter
75.0% 25.0% 58.3%
% of Total 50.0% 8.3% 58.3%
Total
Count 8 4 12
% within
Gender
66.7% 33.3% 100.0%
% within
UseTutorC
enter
100.0% 100.0% 100.0%
% of Total 66.7% 33.3% 100.0%
Gender * LikeEmails
Crosstab
LikeEmails Total
1.00 2.00
Gender
1.00
Count 4 1 5
% within
Gender
80.0% 20.0% 100.0%
% within
LikeEmails
44.4% 33.3% 41.7%
% of Total 33.3% 8.3% 41.7%
2.00
Count 5 2 7
% within
Gender
71.4% 28.6% 100.0%
% within
LikeEmails
55.6% 66.7% 58.3%
% of Total 41.7% 16.7% 58.3%
Total Count 9 3 12
% within
Gender
75.0% 25.0% 100.0%
% within
LikeEmails
100.0% 100.0% 100.0%
% of Total 75.0% 25.0% 100.0%
Gender * InfoFromTeacher
Crosstab
InfoFromT
eacher
Total
1.00 2.00
Gender
1.00
Count 2 3 5
% within
Gender
40.0% 60.0% 100.0%
% within
InfoFromT
eacher
28.6% 60.0% 41.7%
% of Total 16.7% 25.0% 41.7%
2.00
Count 5 2 7
% within
Gender
71.4% 28.6% 100.0%
% within
InfoFromT
eacher
71.4% 40.0% 58.3%
% of Total 41.7% 16.7% 58.3%
Total Count 7 5 12
% within
Gender
58.3% 41.7% 100.0%
% within
InfoFromT
eacher
100.0% 100.0% 100.0%
% of Total 58.3% 41.7% 100.0%
Gender * UseOfficeHours
Crosstab
UseOffice
Hours
Total
1.00
Gender
1.00
Count 5 5
% within Gender 100.0% 100.0%
% within
UseOfficeHours
41.7% 41.7%
% of Total 41.7% 41.7%
2.00
Count 7 7
% within Gender 100.0% 100.0%
% within
UseOfficeHours
58.3% 58.3%
% of Total 58.3% 58.3%
Total
Count 12 12
% within Gender 100.0% 100.0%
% within
UseOfficeHours
100.0% 100.0%
% of Total 100.0% 100.0%
Gender * CareerCenter
Crosstab
CareerCen
ter
Total
1.00 2.00
Gender 1.00 Count 2 3 5
% within
Gender
40.0% 60.0% 100.0%
% within
CareerCen
ter
40.0% 42.9% 41.7%
% of Total 16.7% 25.0% 41.7%
2.00
Count 3 4 7
% within
Gender
42.9% 57.1% 100.0%
% within
CareerCen
ter
60.0% 57.1% 58.3%
% of Total 25.0% 33.3% 58.3%
Total
Count 5 7 12
% within
Gender
41.7% 58.3% 100.0%
% within
CareerCen
ter
100.0% 100.0% 100.0%
% of Total 41.7% 58.3% 100.0%
Gender * LeadershipCenter
Crosstab
Leadership
Center
Total
2.00
Gender 1.00 Count 5 5
% within Gender 100.0% 100.0%
% within
LeadershipCent
er
41.7% 41.7%
% of Total 41.7% 41.7%
2.00
Count 7 7
% within Gender 100.0% 100.0%
% within
LeadershipCent
er
58.3% 58.3%
% of Total 58.3% 58.3%
Total
Count 12 12
% within Gender 100.0% 100.0%
% within
LeadershipCent
er
100.0% 100.0%
% of Total 100.0% 100.0%
Gender * UseAllServices
Crosstab
UseAllServ
ices
Total
1.00 2.00
Gender
1.00
Count 0 5 5
% within
Gender
0.0% 100.0% 100.0%
% within
UseAllServ
ices
0.0% 45.5% 41.7%
% of Total 0.0% 41.7% 41.7%
2.00 Count 1 6 7
% within
Gender
14.3% 85.7% 100.0%
% within
UseAllServ
ices
100.0% 54.5% 58.3%
% of Total 8.3% 50.0% 58.3%
Total
Count 1 11 12
% within
Gender
8.3% 91.7% 100.0%
% within
UseAllServ
ices
100.0% 100.0% 100.0%
% of Total 8.3% 91.7% 100.0%
GradeLevel * Interactive
Crosstab
Interactive Total
1.00 2.00
GradeL
evel
3.00
Count 0 3 3
% within
GradeLeve
l
0.0% 100.0% 100.0%
% within
Interactive
0.0% 27.3% 25.0%
% of Total 0.0% 25.0% 25.0%
4.00
Count 1 8 9
% within
GradeLeve
l
11.1% 88.9% 100.0%
% within
Interactive
100.0% 72.7% 75.0%
% of Total 8.3% 66.7% 75.0%
Total Count 1 11 12
% within
GradeLeve
l
8.3% 91.7% 100.0%
% within
Interactive
100.0% 100.0% 100.0%
% of Total 8.3% 91.7% 100.0%
GradeLevel * Informative
Crosstab
Informative Total
1.00 2.00 3.00
GradeL
evel
3.00
Count 1 1 1 3
% within
GradeLeve
l
33.3% 33.3% 33.3% 100.0%
% within
Informative
16.7% 33.3% 33.3% 25.0%
% of Total 8.3% 8.3% 8.3% 25.0%
4.00
Count 5 2 2 9
% within
GradeLeve
l
55.6% 22.2% 22.2% 100.0%
% within
Informative
83.3% 66.7% 66.7% 75.0%
% of Total 41.7% 16.7% 16.7% 75.0%
Total
Count 6 3 3 12
% within
GradeLeve
l
50.0% 25.0% 25.0% 100.0%
% within
Informative
100.0% 100.0% 100.0% 100.0%
% of Total 50.0% 25.0% 25.0% 100.0%
GradeLevel * Organized
Crosstab
Organized Total
1.00 2.00
GradeL
evel
3.00
Count 0 3 3
% within
GradeLeve
l
0.0% 100.0% 100.0%
% within
Organized
0.0% 27.3% 25.0%
% of Total 0.0% 25.0% 25.0%
4.00
Count 1 8 9
% within
GradeLeve
l
11.1% 88.9% 100.0%
% within
Organized
100.0% 72.7% 75.0%
% of Total 8.3% 66.7% 75.0%
Total
Count 1 11 12
% within
GradeLeve
l
8.3% 91.7% 100.0%
% within
Organized
100.0% 100.0% 100.0%
% of Total 8.3% 91.7% 100.0%
GradeLevel * WebsiteUses
Crosstab
WebsiteUs
es
Total
1.00 2.00 3.00
GradeL 3.00 Count 3 0 0 3
evel
% within
GradeLeve
l
100.0% 0.0% 0.0% 100.0%
% within
WebsiteUs
es
37.5% 0.0% 0.0% 25.0%
% of Total 25.0% 0.0% 0.0% 25.0%
4.00
Count 5 3 1 9
% within
GradeLeve
l
55.6% 33.3% 11.1% 100.0%
% within
WebsiteUs
es
62.5% 100.0% 100.0% 75.0%
% of Total 41.7% 25.0% 8.3% 75.0%
Total
Count 8 3 1 12
% within
GradeLeve
l
66.7% 25.0% 8.3% 100.0%
% within
WebsiteUs
es
100.0% 100.0% 100.0% 100.0%
% of Total 66.7% 25.0% 8.3% 100.0%
GradeLevel * BackgroundImage
Crosstab
Backgroun
dImage
Total
1.00 2.00
GradeL 3.00 Count 3 0 3
evel
% within
GradeLeve
l
100.0% 0.0% 100.0%
% within
Backgroun
dImage
37.5% 0.0% 25.0%
% of Total 25.0% 0.0% 25.0%
4.00
Count 5 4 9
% within
GradeLeve
l
55.6% 44.4% 100.0%
% within
Backgroun
dImage
62.5% 100.0% 75.0%
% of Total 41.7% 33.3% 75.0%
Total
Count 8 4 12
% within
GradeLeve
l
66.7% 33.3% 100.0%
% within
Backgroun
dImage
100.0% 100.0% 100.0%
% of Total 66.7% 33.3% 100.0%
GradeLevel * UsefulBackground
Crosstab
UsefulBac
kground
Total
1.00 2.00
GradeL 3.00 Count 1 2 3
evel
% within
GradeLeve
l
33.3% 66.7% 100.0%
% within
UsefulBac
kground
25.0% 25.0% 25.0%
% of Total 8.3% 16.7% 25.0%
4.00
Count 3 6 9
% within
GradeLeve
l
33.3% 66.7% 100.0%
% within
UsefulBac
kground
75.0% 75.0% 75.0%
% of Total 25.0% 50.0% 75.0%
Total
Count 4 8 12
% within
GradeLeve
l
33.3% 66.7% 100.0%
% within
UsefulBac
kground
100.0% 100.0% 100.0%
% of Total 33.3% 66.7% 100.0%
GradeLevel * PerceptionMihaylo
Crosstab
Perception
Mihaylo
Total
1.00 2.00
GradeL
evel
3.00 Count 3 0 3
% within
GradeLeve
l
100.0% 0.0% 100.0%
% within
Perception
Mihaylo
27.3% 0.0% 25.0%
% of Total 25.0% 0.0% 25.0%
4.00
Count 8 1 9
% within
GradeLeve
l
88.9% 11.1% 100.0%
% within
Perception
Mihaylo
72.7% 100.0% 75.0%
% of Total 66.7% 8.3% 75.0%
Total
Count 11 1 12
% within
GradeLeve
l
91.7% 8.3% 100.0%
% within
Perception
Mihaylo
100.0% 100.0% 100.0%
% of Total 91.7% 8.3% 100.0%
GradeLevel * Facebook
Crosstab
Facebook Total
1.00 2.00
GradeL
evel
3.00 Count 1 2 3
% within
GradeLeve
l
33.3% 66.7% 100.0%
% within
Facebook
14.3% 40.0% 25.0%
% of Total 8.3% 16.7% 25.0%
4.00
Count 6 3 9
% within
GradeLeve
l
66.7% 33.3% 100.0%
% within
Facebook
85.7% 60.0% 75.0%
% of Total 50.0% 25.0% 75.0%
Total
Count 7 5 12
% within
GradeLeve
l
58.3% 41.7% 100.0%
% within
Facebook
100.0% 100.0% 100.0%
% of Total 58.3% 41.7% 100.0%
GradeLevel * Twitter
Crosstab
Twitter Total
1.00 2.00
GradeL
evel
3.00
Count 0 3 3
% within
GradeLeve
l
0.0% 100.0% 100.0%
% within
Twitter
0.0% 42.9% 25.0%
% of Total 0.0% 25.0% 25.0%
4.00 Count 5 4 9
% within
GradeLeve
l
55.6% 44.4% 100.0%
% within
Twitter
100.0% 57.1% 75.0%
% of Total 41.7% 33.3% 75.0%
Total
Count 5 7 12
% within
GradeLeve
l
41.7% 58.3% 100.0%
% within
Twitter
100.0% 100.0% 100.0%
% of Total 41.7% 58.3% 100.0%
GradeLevel * LinkedIn
Crosstab
LinkedIn Total
1.00 2.00
GradeL
evel
3.00
Count 2 1 3
% within
GradeLeve
l
66.7% 33.3% 100.0%
% within
LinkedIn
28.6% 20.0% 25.0%
% of Total 16.7% 8.3% 25.0%
4.00
Count 5 4 9
% within
GradeLeve
l
55.6% 44.4% 100.0%
% within
LinkedIn
71.4% 80.0% 75.0%
% of Total 41.7% 33.3% 75.0%
Total Count 7 5 12
% within
GradeLeve
l
58.3% 41.7% 100.0%
% within
LinkedIn
100.0% 100.0% 100.0%
% of Total 58.3% 41.7% 100.0%
GradeLevel * Instagram
Crosstab
Instagram Total
1.00 2.00
GradeL
evel
3.00
Count 0 3 3
% within
GradeLeve
l
0.0% 100.0% 100.0%
% within
Instagram
0.0% 30.0% 25.0%
% of Total 0.0% 25.0% 25.0%
4.00
Count 2 7 9
% within
GradeLeve
l
22.2% 77.8% 100.0%
% within
Instagram
100.0% 70.0% 75.0%
% of Total 16.7% 58.3% 75.0%
Total Count 2 10 12
% within
GradeLeve
l
16.7% 83.3% 100.0%
% within
Instagram
100.0% 100.0% 100.0%
% of Total 16.7% 83.3% 100.0%
GradeLevel * WhyCSUF
Crosstab
WhyCSUF
1.00 2.00 3.00 4.00 5.00
GradeL
evel
3.00
Count 3 0 0 0 0
% within
GradeLeve
l
100.0% 0.0% 0.0% 0.0% 0.0%
% within
WhyCSUF
42.9% 0.0% 0.0% 0.0% 0.0%
% of Total 25.0% 0.0% 0.0% 0.0% 0.0%
4.00
Count 4 1 2 1 1
% within
GradeLeve
l
44.4% 11.1% 22.2% 11.1% 11.1%
% within
WhyCSUF
57.1% 100.0% 100.0% 100.0% 100.0%
% of Total 33.3% 8.3% 16.7% 8.3% 8.3%
Total
Count 7 1 2 1 1
% within
GradeLeve
l
58.3% 8.3% 16.7% 8.3% 8.3%
% within
WhyCSUF
100.0% 100.0% 100.0% 100.0% 100.0%
% of Total 58.3% 8.3% 16.7% 8.3% 8.3%
Crosstab
Total
GradeLevel 3.00 Count 3
% within GradeLevel 100.0%
% within WhyCSUF 25.0%
% of Total 25.0%
4.00
Count 9
% within GradeLevel 100.0%
% within WhyCSUF 75.0%
% of Total 75.0%
Total
Count 12
% within GradeLevel 100.0%
% within WhyCSUF 100.0%
% of Total 100.0%
GradeLevel * ScaleCommunication
Crosstab
ScaleCommunication
1.00 2.00 3.00 4.00 5.00
GradeL
evel
3.00
Count 0 1 1 1 0
% within
GradeLev
el
0.0% 33.3% 33.3% 33.3% 0.0%
% within
ScaleCom
munication
0.0% 100.0% 50.0% 20.0% 0.0%
% of Total 0.0% 8.3% 8.3% 8.3% 0.0%
4.00 Count 2 0 1 4 2
% within
GradeLev
el
22.2% 0.0% 11.1% 44.4% 22.2%
% within
ScaleCom
munication
100.0% 0.0% 50.0% 80.0% 100.0%
% of Total 16.7% 0.0% 8.3% 33.3% 16.7%
Total
Count 2 1 2 5 2
% within
GradeLev
el
16.7% 8.3% 16.7% 41.7% 16.7%
% within
ScaleCom
munication
100.0% 100.0% 100.0% 100.0% 100.0%
% of Total 16.7% 8.3% 16.7% 41.7% 16.7%
GradeLevel * UseServices
Crosstab
UseServic
es
Total
1.00 2.00 3.00 4.00
GradeL
evel
3.00
Count 0 0 2 1 3
% within
GradeLeve
l
0.0% 0.0% 66.7% 33.3% 100.0%
% within
UseServic
es
0.0% 0.0% 66.7% 20.0% 25.0%
% of Total 0.0% 0.0% 16.7% 8.3% 25.0%
4.00 Count 2 2 1 4 9
% within
GradeLeve
l
22.2% 22.2% 11.1% 44.4% 100.0%
% within
UseServic
es
100.0% 100.0% 33.3% 80.0% 75.0%
% of Total 16.7% 16.7% 8.3% 33.3% 75.0%
Total
Count 2 2 3 5 12
% within
GradeLeve
l
16.7% 16.7% 25.0% 41.7% 100.0%
% within
UseServic
es
100.0% 100.0% 100.0% 100.0% 100.0%
% of Total 16.7% 16.7% 25.0% 41.7% 100.0%
GradeLevel * TimesAdvising
Crosstab
TimesAdvi
sing
Total
2.00 3.00 4.00
GradeL
evel
3.00
Count 2 0 1 3
% within
GradeLeve
l
66.7% 0.0% 33.3% 100.0%
% within
TimesAdvi
sing
28.6% 0.0% 25.0% 25.0%
% of Total 16.7% 0.0% 8.3% 25.0%
4.00 Count 5 1 3 9
% within
GradeLeve
l
55.6% 11.1% 33.3% 100.0%
% within
TimesAdvi
sing
71.4% 100.0% 75.0% 75.0%
% of Total 41.7% 8.3% 25.0% 75.0%
Total
Count 7 1 4 12
% within
GradeLeve
l
58.3% 8.3% 33.3% 100.0%
% within
TimesAdvi
sing
100.0% 100.0% 100.0% 100.0%
% of Total 58.3% 8.3% 33.3% 100.0%
GradeLevel * ConcentrationCenter
Crosstab
Concentrat
ionCenter
Total
1.00 2.00
GradeL
evel
3.00
Count 1 2 3
% within
GradeLeve
l
33.3% 66.7% 100.0%
% within
Concentrat
ionCenter
50.0% 20.0% 25.0%
% of Total 8.3% 16.7% 25.0%
4.00
Count 1 8 9
% within
GradeLeve
l
11.1% 88.9% 100.0%
% within
Concentrat
ionCenter
50.0% 80.0% 75.0%
% of Total 8.3% 66.7% 75.0%
Total Count 2 10 12
% within
GradeLeve
l
16.7% 83.3% 100.0%
% within
Concentrat
ionCenter
100.0% 100.0% 100.0%
% of Total 16.7% 83.3% 100.0%
GradeLevel * UseTutorCenter
Crosstab
UseTutorC
enter
Total
1.00 2.00
GradeL
evel
3.00
Count 1 2 3
% within
GradeLeve
l
33.3% 66.7% 100.0%
% within
UseTutorC
enter
12.5% 50.0% 25.0%
% of Total 8.3% 16.7% 25.0%
4.00
Count 7 2 9
% within
GradeLeve
l
77.8% 22.2% 100.0%
% within
UseTutorC
enter
87.5% 50.0% 75.0%
% of Total 58.3% 16.7% 75.0%
Total Count 8 4 12
% within
GradeLeve
l
66.7% 33.3% 100.0%
% within
UseTutorC
enter
100.0% 100.0% 100.0%
% of Total 66.7% 33.3% 100.0%
GradeLevel * LikeEmails
Crosstab
LikeEmails Total
1.00 2.00
GradeL
evel
3.00
Count 2 1 3
% within
GradeLeve
l
66.7% 33.3% 100.0%
% within
LikeEmails
22.2% 33.3% 25.0%
% of Total 16.7% 8.3% 25.0%
4.00
Count 7 2 9
% within
GradeLeve
l
77.8% 22.2% 100.0%
% within
LikeEmails
77.8% 66.7% 75.0%
% of Total 58.3% 16.7% 75.0%
Total Count 9 3 12
% within
GradeLeve
l
75.0% 25.0% 100.0%
% within
LikeEmails
100.0% 100.0% 100.0%
% of Total 75.0% 25.0% 100.0%
GradeLevel * InfoFromTeacher
Crosstab
InfoFromT
eacher
Total
1.00 2.00
GradeL
evel
3.00
Count 1 2 3
% within
GradeLeve
l
33.3% 66.7% 100.0%
% within
InfoFromT
eacher
14.3% 40.0% 25.0%
% of Total 8.3% 16.7% 25.0%
4.00
Count 6 3 9
% within
GradeLeve
l
66.7% 33.3% 100.0%
% within
InfoFromT
eacher
85.7% 60.0% 75.0%
% of Total 50.0% 25.0% 75.0%
Total
Count 7 5 12
% within
GradeLeve
l
58.3% 41.7% 100.0%
% within
InfoFromT
eacher
100.0% 100.0% 100.0%
% of Total 58.3% 41.7% 100.0%
GradeLevel * UseOfficeHours
Crosstab
UseOffice
Hours
Total
1.00
GradeL
evel
3.00
Count 3 3
% within
GradeLevel
100.0% 100.0%
% within
UseOfficeHours
25.0% 25.0%
% of Total 25.0% 25.0%
4.00
Count 9 9
% within
GradeLevel
100.0% 100.0%
% within
UseOfficeHours
75.0% 75.0%
% of Total 75.0% 75.0%
Total
Count 12 12
% within
GradeLevel
100.0% 100.0%
% within
UseOfficeHours
100.0% 100.0%
% of Total 100.0% 100.0%
GradeLevel * CareerCenter
Crosstab
CareerCen
ter
Total
1.00 2.00
GradeL 3.00 Count 1 2 3
evel
% within
GradeLeve
l
33.3% 66.7% 100.0%
% within
CareerCen
ter
20.0% 28.6% 25.0%
% of Total 8.3% 16.7% 25.0%
4.00
Count 4 5 9
% within
GradeLeve
l
44.4% 55.6% 100.0%
% within
CareerCen
ter
80.0% 71.4% 75.0%
% of Total 33.3% 41.7% 75.0%
Total
Count 5 7 12
% within
GradeLeve
l
41.7% 58.3% 100.0%
% within
CareerCen
ter
100.0% 100.0% 100.0%
% of Total 41.7% 58.3% 100.0%
GradeLevel * LeadershipCenter
Crosstab
Leadership
Center
Total
2.00
GradeL
evel
3.00 Count 3 3
% within
GradeLevel
100.0% 100.0%
% within
LeadershipCent
er
25.0% 25.0%
% of Total 25.0% 25.0%
4.00
Count 9 9
% within
GradeLevel
100.0% 100.0%
% within
LeadershipCent
er
75.0% 75.0%
% of Total 75.0% 75.0%
Total
Count 12 12
% within
GradeLevel
100.0% 100.0%
% within
LeadershipCent
er
100.0% 100.0%
% of Total 100.0% 100.0%
GradeLevel * UseAllServices
Crosstab
UseAllServ
ices
Total
1.00 2.00
GradeL
evel
3.00
Count 0 3 3
% within
GradeLeve
l
0.0% 100.0% 100.0%
% within
UseAllServ
ices
0.0% 27.3% 25.0%
% of Total 0.0% 25.0% 25.0%
4.00 Count 1 8 9
% within
GradeLeve
l
11.1% 88.9% 100.0%
% within
UseAllServ
ices
100.0% 72.7% 75.0%
% of Total 8.3% 66.7% 75.0%
Total
Count 1 11 12
% within
GradeLeve
l
8.3% 91.7% 100.0%
% within
UseAllServ
ices
100.0% 100.0% 100.0%
% of Total 8.3% 91.7% 100.0%
Concentration * Interactive
Crosstab
Interactive Total
1.00 2.00
Concen
tration
1.00
Count 0 2 2
% within
Concentrat
ion
0.0% 100.0% 100.0%
% within
Interactive
0.0% 18.2% 16.7%
% of Total 0.0% 16.7% 16.7%
2.00 Count 0 1 1
% within
Concentrat
ion
0.0% 100.0% 100.0%
% within
Interactive
0.0% 9.1% 8.3%
% of Total 0.0% 8.3% 8.3%
3.00
Count 0 1 1
% within
Concentrat
ion
0.0% 100.0% 100.0%
% within
Interactive
0.0% 9.1% 8.3%
% of Total 0.0% 8.3% 8.3%
4.00
Count 1 3 4
% within
Concentrat
ion
25.0% 75.0% 100.0%
% within
Interactive
100.0% 27.3% 33.3%
% of Total 8.3% 25.0% 33.3%
5.00
Count 0 1 1
% within
Concentrat
ion
0.0% 100.0% 100.0%
% within
Interactive
0.0% 9.1% 8.3%
% of Total 0.0% 8.3% 8.3%
6.00
Count 0 2 2
% within
Concentrat
ion
0.0% 100.0% 100.0%
% within
Interactive
0.0% 18.2% 16.7%
% of Total 0.0% 16.7% 16.7%
7.00 Count 0 1 1
% within
Concentrat
ion
0.0% 100.0% 100.0%
% within
Interactive
0.0% 9.1% 8.3%
% of Total 0.0% 8.3% 8.3%
Total
Count 1 11 12
% within
Concentrat
ion
8.3% 91.7% 100.0%
% within
Interactive
100.0% 100.0% 100.0%
% of Total 8.3% 91.7% 100.0%
Concentration * Informative
Crosstab
Informative Total
1.00 2.00 3.00
Concen
tration
1.00
Count 1 0 1 2
% within
Concentrat
ion
50.0% 0.0% 50.0% 100.0%
% within
Informative
16.7% 0.0% 33.3% 16.7%
% of Total 8.3% 0.0% 8.3% 16.7%
2.00 Count 0 0 1 1
% within
Concentrat
ion
0.0% 0.0% 100.0% 100.0%
% within
Informative
0.0% 0.0% 33.3% 8.3%
% of Total 0.0% 0.0% 8.3% 8.3%
3.00
Count 0 1 0 1
% within
Concentrat
ion
0.0% 100.0% 0.0% 100.0%
% within
Informative
0.0% 33.3% 0.0% 8.3%
% of Total 0.0% 8.3% 0.0% 8.3%
4.00
Count 3 1 0 4
% within
Concentrat
ion
75.0% 25.0% 0.0% 100.0%
% within
Informative
50.0% 33.3% 0.0% 33.3%
% of Total 25.0% 8.3% 0.0% 33.3%
5.00
Count 1 0 0 1
% within
Concentrat
ion
100.0% 0.0% 0.0% 100.0%
% within
Informative
16.7% 0.0% 0.0% 8.3%
% of Total 8.3% 0.0% 0.0% 8.3%
6.00
Count 1 0 1 2
% within
Concentrat
ion
50.0% 0.0% 50.0% 100.0%
% within
Informative
16.7% 0.0% 33.3% 16.7%
% of Total 8.3% 0.0% 8.3% 16.7%
7.00
Count 0 1 0 1
% within
Concentrat
ion
0.0% 100.0% 0.0% 100.0%
% within
Informative
0.0% 33.3% 0.0% 8.3%
% of Total 0.0% 8.3% 0.0% 8.3%
Total
Count 6 3 3 12
% within
Concentrat
ion
50.0% 25.0% 25.0% 100.0%
% within
Informative
100.0% 100.0% 100.0% 100.0%
% of Total 50.0% 25.0% 25.0% 100.0%
Concentration * Organized
Crosstab
Organized Total
1.00 2.00
Concen
tration
1.00
Count 0 2 2
% within
Concentrat
ion
0.0% 100.0% 100.0%
% within
Organized
0.0% 18.2% 16.7%
% of Total 0.0% 16.7% 16.7%
2.00
Count 0 1 1
% within
Concentrat
ion
0.0% 100.0% 100.0%
% within
Organized
0.0% 9.1% 8.3%
% of Total 0.0% 8.3% 8.3%
3.00 Count 0 1 1
% within
Concentrat
ion
0.0% 100.0% 100.0%
% within
Organized
0.0% 9.1% 8.3%
% of Total 0.0% 8.3% 8.3%
4.00
Count 0 4 4
% within
Concentrat
ion
0.0% 100.0% 100.0%
% within
Organized
0.0% 36.4% 33.3%
% of Total 0.0% 33.3% 33.3%
5.00
Count 1 0 1
% within
Concentrat
ion
100.0% 0.0% 100.0%
% within
Organized
100.0% 0.0% 8.3%
% of Total 8.3% 0.0% 8.3%
6.00
Count 0 2 2
% within
Concentrat
ion
0.0% 100.0% 100.0%
% within
Organized
0.0% 18.2% 16.7%
% of Total 0.0% 16.7% 16.7%
7.00 Count 0 1 1
% within
Concentrat
ion
0.0% 100.0% 100.0%
% within
Organized
0.0% 9.1% 8.3%
% of Total 0.0% 8.3% 8.3%
Total
Count 1 11 12
% within
Concentrat
ion
8.3% 91.7% 100.0%
% within
Organized
100.0% 100.0% 100.0%
% of Total 8.3% 91.7% 100.0%
Concentration * WebsiteUses
Crosstab
WebsiteUs
es
Total
1.00 2.00 3.00
Concen
tration
1.00
Count 1 1 0 2
% within
Concentrat
ion
50.0% 50.0% 0.0% 100.0%
% within
WebsiteUs
es
12.5% 33.3% 0.0% 16.7%
% of Total 8.3% 8.3% 0.0% 16.7%
2.00 Count 0 1 0 1
% within
Concentrat
ion
0.0% 100.0% 0.0% 100.0%
% within
WebsiteUs
es
0.0% 33.3% 0.0% 8.3%
% of Total 0.0% 8.3% 0.0% 8.3%
3.00
Count 1 0 0 1
% within
Concentrat
ion
100.0% 0.0% 0.0% 100.0%
% within
WebsiteUs
es
12.5% 0.0% 0.0% 8.3%
% of Total 8.3% 0.0% 0.0% 8.3%
4.00
Count 3 1 0 4
% within
Concentrat
ion
75.0% 25.0% 0.0% 100.0%
% within
WebsiteUs
es
37.5% 33.3% 0.0% 33.3%
% of Total 25.0% 8.3% 0.0% 33.3%
5.00
Count 0 0 1 1
% within
Concentrat
ion
0.0% 0.0% 100.0% 100.0%
% within
WebsiteUs
es
0.0% 0.0% 100.0% 8.3%
% of Total 0.0% 0.0% 8.3% 8.3%
6.00 Count 2 0 0 2
% within
Concentrat
ion
100.0% 0.0% 0.0% 100.0%
% within
WebsiteUs
es
25.0% 0.0% 0.0% 16.7%
% of Total 16.7% 0.0% 0.0% 16.7%
7.00
Count 1 0 0 1
% within
Concentrat
ion
100.0% 0.0% 0.0% 100.0%
% within
WebsiteUs
es
12.5% 0.0% 0.0% 8.3%
% of Total 8.3% 0.0% 0.0% 8.3%
Total
Count 8 3 1 12
% within
Concentrat
ion
66.7% 25.0% 8.3% 100.0%
% within
WebsiteUs
es
100.0% 100.0% 100.0% 100.0%
% of Total 66.7% 25.0% 8.3% 100.0%
Concentration * PerceptionMihaylo
Crosstab
Perception
Mihaylo
Total
1.00 2.00
Concen
tration
1.00
Count 2 0 2
% within
Concentrat
ion
100.0% 0.0% 100.0%
% within
Perception
Mihaylo
18.2% 0.0% 16.7%
% of Total 16.7% 0.0% 16.7%
2.00 Count 1 0 1
% within
Concentrat
ion
100.0% 0.0% 100.0%
% within
Perception
Mihaylo
9.1% 0.0% 8.3%
% of Total 8.3% 0.0% 8.3%
3.00
Count 1 0 1
% within
Concentrat
ion
100.0% 0.0% 100.0%
% within
Perception
Mihaylo
9.1% 0.0% 8.3%
% of Total 8.3% 0.0% 8.3%
4.00
Count 4 0 4
% within
Concentrat
ion
100.0% 0.0% 100.0%
% within
Perception
Mihaylo
36.4% 0.0% 33.3%
% of Total 33.3% 0.0% 33.3%
5.00
Count 1 0 1
% within
Concentrat
ion
100.0% 0.0% 100.0%
% within
Perception
Mihaylo
9.1% 0.0% 8.3%
% of Total 8.3% 0.0% 8.3%
6.00 Count 2 0 2
% within
Concentrat
ion
100.0% 0.0% 100.0%
% within
Perception
Mihaylo
18.2% 0.0% 16.7%
% of Total 16.7% 0.0% 16.7%
7.00
Count 0 1 1
% within
Concentrat
ion
0.0% 100.0% 100.0%
% within
Perception
Mihaylo
0.0% 100.0% 8.3%
% of Total 0.0% 8.3% 8.3%
Total
Count 11 1 12
% within
Concentrat
ion
91.7% 8.3% 100.0%
% within
Perception
Mihaylo
100.0% 100.0% 100.0%
% of Total 91.7% 8.3% 100.0%

More Related Content

Viewers also liked

Viewers also liked (8)

Pmh
Pmh Pmh
Pmh
 
Carnival cruise report copy
Carnival cruise report copyCarnival cruise report copy
Carnival cruise report copy
 
Haverwood furniture
Haverwood furnitureHaverwood furniture
Haverwood furniture
 
X4 case study copy
X4 case study copyX4 case study copy
X4 case study copy
 
marketing plan (4)
marketing plan (4)marketing plan (4)
marketing plan (4)
 
Clip pers project
Clip pers projectClip pers project
Clip pers project
 
Mary kay case
Mary kay caseMary kay case
Mary kay case
 
Dermavescent Laboratories
Dermavescent LaboratoriesDermavescent Laboratories
Dermavescent Laboratories
 

Similar to depth interview tabs

NEMLDC SALT Data 2021
NEMLDC SALT Data 2021NEMLDC SALT Data 2021
NEMLDC SALT Data 2021SamuelDCalder
 
Jdp presentation statistics
Jdp presentation statisticsJdp presentation statistics
Jdp presentation statisticsDevcoms
 
Washington D.C. Internship portfolio, work samples
Washington D.C. Internship portfolio, work samplesWashington D.C. Internship portfolio, work samples
Washington D.C. Internship portfolio, work samplesSatu Hermunen
 
[대학내일20대연구소] 2017 20대 전시회/페스티벌 문화 향유 실태 및 트렌드 조사 (연구리포트 2017-12)
[대학내일20대연구소] 2017 20대 전시회/페스티벌 문화 향유 실태 및 트렌드 조사 (연구리포트 2017-12)[대학내일20대연구소] 2017 20대 전시회/페스티벌 문화 향유 실태 및 트렌드 조사 (연구리포트 2017-12)
[대학내일20대연구소] 2017 20대 전시회/페스티벌 문화 향유 실태 및 트렌드 조사 (연구리포트 2017-12)20slab(대학내일20대연구소)
 
Math final
Math finalMath final
Math finalJy Chong
 
Math final project (fnbe0814)
Math final project (fnbe0814)Math final project (fnbe0814)
Math final project (fnbe0814)Jy Chong
 
e-Portfolio for Lab-Based Statistics (PSYC 3100) part 2 (7.presentation)
e-Portfolio for Lab-Based Statistics (PSYC 3100) part 2 (7.presentation)e-Portfolio for Lab-Based Statistics (PSYC 3100) part 2 (7.presentation)
e-Portfolio for Lab-Based Statistics (PSYC 3100) part 2 (7.presentation)Ella Anwar
 
Back Up QA - Session 4
Back Up QA - Session 4Back Up QA - Session 4
Back Up QA - Session 4megha G
 
Cb special issue -board of education
Cb special issue -board of educationCb special issue -board of education
Cb special issue -board of educationHonolulu Civil Beat
 
Survey on The Internet of Things and Social Media
Survey on The Internet of Things and Social MediaSurvey on The Internet of Things and Social Media
Survey on The Internet of Things and Social Mediagrins1
 
Foundation admissions 2017_eng(2)
Foundation admissions 2017_eng(2)Foundation admissions 2017_eng(2)
Foundation admissions 2017_eng(2)Indira Tolendiyeva
 
Foundation admissions 2017_eng
Foundation admissions 2017_engFoundation admissions 2017_eng
Foundation admissions 2017_engIndira Tolendiyeva
 
CBS News60 MinutesVanity FairNational Poll, April #2, 2011.docx
CBS News60 MinutesVanity FairNational Poll, April #2, 2011.docxCBS News60 MinutesVanity FairNational Poll, April #2, 2011.docx
CBS News60 MinutesVanity FairNational Poll, April #2, 2011.docxtidwellveronique
 

Similar to depth interview tabs (20)

Business Research
Business ResearchBusiness Research
Business Research
 
NEMLDC SALT Data 2021
NEMLDC SALT Data 2021NEMLDC SALT Data 2021
NEMLDC SALT Data 2021
 
Jdp presentation statistics
Jdp presentation statisticsJdp presentation statistics
Jdp presentation statistics
 
Washington D.C. Internship portfolio, work samples
Washington D.C. Internship portfolio, work samplesWashington D.C. Internship portfolio, work samples
Washington D.C. Internship portfolio, work samples
 
[대학내일20대연구소] 2017 20대 전시회/페스티벌 문화 향유 실태 및 트렌드 조사 (연구리포트 2017-12)
[대학내일20대연구소] 2017 20대 전시회/페스티벌 문화 향유 실태 및 트렌드 조사 (연구리포트 2017-12)[대학내일20대연구소] 2017 20대 전시회/페스티벌 문화 향유 실태 및 트렌드 조사 (연구리포트 2017-12)
[대학내일20대연구소] 2017 20대 전시회/페스티벌 문화 향유 실태 및 트렌드 조사 (연구리포트 2017-12)
 
Math final
Math finalMath final
Math final
 
Math final project (fnbe0814)
Math final project (fnbe0814)Math final project (fnbe0814)
Math final project (fnbe0814)
 
Students Reporting Use of Selected Substances in the Last 30 Days
Students Reporting Use of Selected Substances in the Last 30 Days Students Reporting Use of Selected Substances in the Last 30 Days
Students Reporting Use of Selected Substances in the Last 30 Days
 
e-Portfolio for Lab-Based Statistics (PSYC 3100) part 2 (7.presentation)
e-Portfolio for Lab-Based Statistics (PSYC 3100) part 2 (7.presentation)e-Portfolio for Lab-Based Statistics (PSYC 3100) part 2 (7.presentation)
e-Portfolio for Lab-Based Statistics (PSYC 3100) part 2 (7.presentation)
 
Olah data bivariat
Olah data bivariatOlah data bivariat
Olah data bivariat
 
Back Up QA - Session 4
Back Up QA - Session 4Back Up QA - Session 4
Back Up QA - Session 4
 
Cb special issue -board of education
Cb special issue -board of educationCb special issue -board of education
Cb special issue -board of education
 
S. stone e health business models for chronic conditions-experiences of basqu...
S. stone e health business models for chronic conditions-experiences of basqu...S. stone e health business models for chronic conditions-experiences of basqu...
S. stone e health business models for chronic conditions-experiences of basqu...
 
Survey on The Internet of Things and Social Media
Survey on The Internet of Things and Social MediaSurvey on The Internet of Things and Social Media
Survey on The Internet of Things and Social Media
 
Lampiran
LampiranLampiran
Lampiran
 
2015 Benchmarking Performance
2015 Benchmarking Performance2015 Benchmarking Performance
2015 Benchmarking Performance
 
Foundation admissions 2017_eng(2)
Foundation admissions 2017_eng(2)Foundation admissions 2017_eng(2)
Foundation admissions 2017_eng(2)
 
Foundation admissions 2017_eng
Foundation admissions 2017_engFoundation admissions 2017_eng
Foundation admissions 2017_eng
 
CBS News60 MinutesVanity FairNational Poll, April #2, 2011.docx
CBS News60 MinutesVanity FairNational Poll, April #2, 2011.docxCBS News60 MinutesVanity FairNational Poll, April #2, 2011.docx
CBS News60 MinutesVanity FairNational Poll, April #2, 2011.docx
 
Matematicas Financieras: Tablas de tasas factores financieros (2020)
Matematicas Financieras: Tablas de tasas factores financieros (2020)Matematicas Financieras: Tablas de tasas factores financieros (2020)
Matematicas Financieras: Tablas de tasas factores financieros (2020)
 

More from kimberlybak88 (14)

Jimmi’s marketing efforts
Jimmi’s marketing effortsJimmi’s marketing efforts
Jimmi’s marketing efforts
 
city presentation
city presentationcity presentation
city presentation
 
Final
FinalFinal
Final
 
Clippers Presentation
Clippers PresentationClippers Presentation
Clippers Presentation
 
Dermavescent Laboratories
Dermavescent LaboratoriesDermavescent Laboratories
Dermavescent Laboratories
 
Final carnival
Final carnivalFinal carnival
Final carnival
 
I pad powerpoint
I pad powerpointI pad powerpoint
I pad powerpoint
 
Jimmi's bar
Jimmi's bar Jimmi's bar
Jimmi's bar
 
Cross Tabs
Cross TabsCross Tabs
Cross Tabs
 
Weymouth steel
Weymouth steelWeymouth steel
Weymouth steel
 
presentation (6)
presentation (6)presentation (6)
presentation (6)
 
diary project
diary projectdiary project
diary project
 
Final verision
Final verisionFinal verision
Final verision
 
Report
ReportReport
Report
 

Recently uploaded

Digital Identity is Under Attack: FIDO Paris Seminar.pptx
Digital Identity is Under Attack: FIDO Paris Seminar.pptxDigital Identity is Under Attack: FIDO Paris Seminar.pptx
Digital Identity is Under Attack: FIDO Paris Seminar.pptxLoriGlavin3
 
Developer Data Modeling Mistakes: From Postgres to NoSQL
Developer Data Modeling Mistakes: From Postgres to NoSQLDeveloper Data Modeling Mistakes: From Postgres to NoSQL
Developer Data Modeling Mistakes: From Postgres to NoSQLScyllaDB
 
Advanced Computer Architecture – An Introduction
Advanced Computer Architecture – An IntroductionAdvanced Computer Architecture – An Introduction
Advanced Computer Architecture – An IntroductionDilum Bandara
 
Unleash Your Potential - Namagunga Girls Coding Club
Unleash Your Potential - Namagunga Girls Coding ClubUnleash Your Potential - Namagunga Girls Coding Club
Unleash Your Potential - Namagunga Girls Coding ClubKalema Edgar
 
How to write a Business Continuity Plan
How to write a Business Continuity PlanHow to write a Business Continuity Plan
How to write a Business Continuity PlanDatabarracks
 
What is DBT - The Ultimate Data Build Tool.pdf
What is DBT - The Ultimate Data Build Tool.pdfWhat is DBT - The Ultimate Data Build Tool.pdf
What is DBT - The Ultimate Data Build Tool.pdfMounikaPolabathina
 
Tampa BSides - Chef's Tour of Microsoft Security Adoption Framework (SAF)
Tampa BSides - Chef's Tour of Microsoft Security Adoption Framework (SAF)Tampa BSides - Chef's Tour of Microsoft Security Adoption Framework (SAF)
Tampa BSides - Chef's Tour of Microsoft Security Adoption Framework (SAF)Mark Simos
 
New from BookNet Canada for 2024: Loan Stars - Tech Forum 2024
New from BookNet Canada for 2024: Loan Stars - Tech Forum 2024New from BookNet Canada for 2024: Loan Stars - Tech Forum 2024
New from BookNet Canada for 2024: Loan Stars - Tech Forum 2024BookNet Canada
 
"ML in Production",Oleksandr Bagan
"ML in Production",Oleksandr Bagan"ML in Production",Oleksandr Bagan
"ML in Production",Oleksandr BaganFwdays
 
The Fit for Passkeys for Employee and Consumer Sign-ins: FIDO Paris Seminar.pptx
The Fit for Passkeys for Employee and Consumer Sign-ins: FIDO Paris Seminar.pptxThe Fit for Passkeys for Employee and Consumer Sign-ins: FIDO Paris Seminar.pptx
The Fit for Passkeys for Employee and Consumer Sign-ins: FIDO Paris Seminar.pptxLoriGlavin3
 
unit 4 immunoblotting technique complete.pptx
unit 4 immunoblotting technique complete.pptxunit 4 immunoblotting technique complete.pptx
unit 4 immunoblotting technique complete.pptxBkGupta21
 
Commit 2024 - Secret Management made easy
Commit 2024 - Secret Management made easyCommit 2024 - Secret Management made easy
Commit 2024 - Secret Management made easyAlfredo García Lavilla
 
SALESFORCE EDUCATION CLOUD | FEXLE SERVICES
SALESFORCE EDUCATION CLOUD | FEXLE SERVICESSALESFORCE EDUCATION CLOUD | FEXLE SERVICES
SALESFORCE EDUCATION CLOUD | FEXLE SERVICESmohitsingh558521
 
Gen AI in Business - Global Trends Report 2024.pdf
Gen AI in Business - Global Trends Report 2024.pdfGen AI in Business - Global Trends Report 2024.pdf
Gen AI in Business - Global Trends Report 2024.pdfAddepto
 
TeamStation AI System Report LATAM IT Salaries 2024
TeamStation AI System Report LATAM IT Salaries 2024TeamStation AI System Report LATAM IT Salaries 2024
TeamStation AI System Report LATAM IT Salaries 2024Lonnie McRorey
 
Scanning the Internet for External Cloud Exposures via SSL Certs
Scanning the Internet for External Cloud Exposures via SSL CertsScanning the Internet for External Cloud Exposures via SSL Certs
Scanning the Internet for External Cloud Exposures via SSL CertsRizwan Syed
 
The Role of FIDO in a Cyber Secure Netherlands: FIDO Paris Seminar.pptx
The Role of FIDO in a Cyber Secure Netherlands: FIDO Paris Seminar.pptxThe Role of FIDO in a Cyber Secure Netherlands: FIDO Paris Seminar.pptx
The Role of FIDO in a Cyber Secure Netherlands: FIDO Paris Seminar.pptxLoriGlavin3
 
The Ultimate Guide to Choosing WordPress Pros and Cons
The Ultimate Guide to Choosing WordPress Pros and ConsThe Ultimate Guide to Choosing WordPress Pros and Cons
The Ultimate Guide to Choosing WordPress Pros and ConsPixlogix Infotech
 
Unraveling Multimodality with Large Language Models.pdf
Unraveling Multimodality with Large Language Models.pdfUnraveling Multimodality with Large Language Models.pdf
Unraveling Multimodality with Large Language Models.pdfAlex Barbosa Coqueiro
 

Recently uploaded (20)

Digital Identity is Under Attack: FIDO Paris Seminar.pptx
Digital Identity is Under Attack: FIDO Paris Seminar.pptxDigital Identity is Under Attack: FIDO Paris Seminar.pptx
Digital Identity is Under Attack: FIDO Paris Seminar.pptx
 
Developer Data Modeling Mistakes: From Postgres to NoSQL
Developer Data Modeling Mistakes: From Postgres to NoSQLDeveloper Data Modeling Mistakes: From Postgres to NoSQL
Developer Data Modeling Mistakes: From Postgres to NoSQL
 
Advanced Computer Architecture – An Introduction
Advanced Computer Architecture – An IntroductionAdvanced Computer Architecture – An Introduction
Advanced Computer Architecture – An Introduction
 
Unleash Your Potential - Namagunga Girls Coding Club
Unleash Your Potential - Namagunga Girls Coding ClubUnleash Your Potential - Namagunga Girls Coding Club
Unleash Your Potential - Namagunga Girls Coding Club
 
How to write a Business Continuity Plan
How to write a Business Continuity PlanHow to write a Business Continuity Plan
How to write a Business Continuity Plan
 
What is DBT - The Ultimate Data Build Tool.pdf
What is DBT - The Ultimate Data Build Tool.pdfWhat is DBT - The Ultimate Data Build Tool.pdf
What is DBT - The Ultimate Data Build Tool.pdf
 
Tampa BSides - Chef's Tour of Microsoft Security Adoption Framework (SAF)
Tampa BSides - Chef's Tour of Microsoft Security Adoption Framework (SAF)Tampa BSides - Chef's Tour of Microsoft Security Adoption Framework (SAF)
Tampa BSides - Chef's Tour of Microsoft Security Adoption Framework (SAF)
 
New from BookNet Canada for 2024: Loan Stars - Tech Forum 2024
New from BookNet Canada for 2024: Loan Stars - Tech Forum 2024New from BookNet Canada for 2024: Loan Stars - Tech Forum 2024
New from BookNet Canada for 2024: Loan Stars - Tech Forum 2024
 
"ML in Production",Oleksandr Bagan
"ML in Production",Oleksandr Bagan"ML in Production",Oleksandr Bagan
"ML in Production",Oleksandr Bagan
 
The Fit for Passkeys for Employee and Consumer Sign-ins: FIDO Paris Seminar.pptx
The Fit for Passkeys for Employee and Consumer Sign-ins: FIDO Paris Seminar.pptxThe Fit for Passkeys for Employee and Consumer Sign-ins: FIDO Paris Seminar.pptx
The Fit for Passkeys for Employee and Consumer Sign-ins: FIDO Paris Seminar.pptx
 
DMCC Future of Trade Web3 - Special Edition
DMCC Future of Trade Web3 - Special EditionDMCC Future of Trade Web3 - Special Edition
DMCC Future of Trade Web3 - Special Edition
 
unit 4 immunoblotting technique complete.pptx
unit 4 immunoblotting technique complete.pptxunit 4 immunoblotting technique complete.pptx
unit 4 immunoblotting technique complete.pptx
 
Commit 2024 - Secret Management made easy
Commit 2024 - Secret Management made easyCommit 2024 - Secret Management made easy
Commit 2024 - Secret Management made easy
 
SALESFORCE EDUCATION CLOUD | FEXLE SERVICES
SALESFORCE EDUCATION CLOUD | FEXLE SERVICESSALESFORCE EDUCATION CLOUD | FEXLE SERVICES
SALESFORCE EDUCATION CLOUD | FEXLE SERVICES
 
Gen AI in Business - Global Trends Report 2024.pdf
Gen AI in Business - Global Trends Report 2024.pdfGen AI in Business - Global Trends Report 2024.pdf
Gen AI in Business - Global Trends Report 2024.pdf
 
TeamStation AI System Report LATAM IT Salaries 2024
TeamStation AI System Report LATAM IT Salaries 2024TeamStation AI System Report LATAM IT Salaries 2024
TeamStation AI System Report LATAM IT Salaries 2024
 
Scanning the Internet for External Cloud Exposures via SSL Certs
Scanning the Internet for External Cloud Exposures via SSL CertsScanning the Internet for External Cloud Exposures via SSL Certs
Scanning the Internet for External Cloud Exposures via SSL Certs
 
The Role of FIDO in a Cyber Secure Netherlands: FIDO Paris Seminar.pptx
The Role of FIDO in a Cyber Secure Netherlands: FIDO Paris Seminar.pptxThe Role of FIDO in a Cyber Secure Netherlands: FIDO Paris Seminar.pptx
The Role of FIDO in a Cyber Secure Netherlands: FIDO Paris Seminar.pptx
 
The Ultimate Guide to Choosing WordPress Pros and Cons
The Ultimate Guide to Choosing WordPress Pros and ConsThe Ultimate Guide to Choosing WordPress Pros and Cons
The Ultimate Guide to Choosing WordPress Pros and Cons
 
Unraveling Multimodality with Large Language Models.pdf
Unraveling Multimodality with Large Language Models.pdfUnraveling Multimodality with Large Language Models.pdf
Unraveling Multimodality with Large Language Models.pdf
 

depth interview tabs

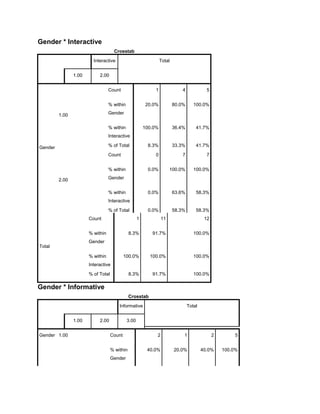
  • 1. Gender * Interactive Crosstab Interactive Total 1.00 2.00 Gender 1.00 Count 1 4 5 % within Gender 20.0% 80.0% 100.0% % within Interactive 100.0% 36.4% 41.7% % of Total 8.3% 33.3% 41.7% 2.00 Count 0 7 7 % within Gender 0.0% 100.0% 100.0% % within Interactive 0.0% 63.6% 58.3% % of Total 0.0% 58.3% 58.3% Total Count 1 11 12 % within Gender 8.3% 91.7% 100.0% % within Interactive 100.0% 100.0% 100.0% % of Total 8.3% 91.7% 100.0% Gender * Informative Crosstab Informative Total 1.00 2.00 3.00 Gender 1.00 Count 2 1 2 5 % within Gender 40.0% 20.0% 40.0% 100.0%
  • 2. % within Informative 33.3% 33.3% 66.7% 41.7% % of Total 16.7% 8.3% 16.7% 41.7% 2.00 Count 4 2 1 7 % within Gender 57.1% 28.6% 14.3% 100.0% % within Informative 66.7% 66.7% 33.3% 58.3% % of Total 33.3% 16.7% 8.3% 58.3% Total Count 6 3 3 12 % within Gender 50.0% 25.0% 25.0% 100.0% % within Informative 100.0% 100.0% 100.0% 100.0% % of Total 50.0% 25.0% 25.0% 100.0% Gender * Organized Crosstab Organized Total 1.00 2.00 Gender 1.00 Count 0 5 5 % within Gender 0.0% 100.0% 100.0% % within Organized 0.0% 45.5% 41.7% % of Total 0.0% 41.7% 41.7% 2.00 Count 1 6 7 % within Gender 14.3% 85.7% 100.0%
  • 3. % within Organized 100.0% 54.5% 58.3% % of Total 8.3% 50.0% 58.3% Total Count 1 11 12 % within Gender 8.3% 91.7% 100.0% % within Organized 100.0% 100.0% 100.0% % of Total 8.3% 91.7% 100.0% Gender * WebsiteUses Crosstab WebsiteUs es Total 1.00 2.00 3.00 Gender 1.00 Count 3 2 0 5 % within Gender 60.0% 40.0% 0.0% 100.0% % within WebsiteUs es 37.5% 66.7% 0.0% 41.7% % of Total 25.0% 16.7% 0.0% 41.7% 2.00 Count 5 1 1 7 % within Gender 71.4% 14.3% 14.3% 100.0% % within WebsiteUs es 62.5% 33.3% 100.0% 58.3% % of Total 41.7% 8.3% 8.3% 58.3% Total Count 8 3 1 12
  • 4. % within Gender 66.7% 25.0% 8.3% 100.0% % within WebsiteUs es 100.0% 100.0% 100.0% 100.0% % of Total 66.7% 25.0% 8.3% 100.0% Chi-Square Tests Value df Asymp. Sig. (2-sided) Pearson Chi- Square 1.543 2 .462 Likelihood Ratio 1.897 2 .387 Linear-by- Linear Associatio n .005 1 .942 N of Valid Cases 12 Gender * PerceptionMihaylo Crosstab Perception Mihaylo Total 1.00 2.00 Gender 1.00 Count 5 0 5 % within Gender 100.0% 0.0% 100.0% % within Perception Mihaylo 45.5% 0.0% 41.7%
  • 5. % of Total 41.7% 0.0% 41.7% 2.00 Count 6 1 7 % within Gender 85.7% 14.3% 100.0% % within Perception Mihaylo 54.5% 100.0% 58.3% % of Total 50.0% 8.3% 58.3% Total Count 11 1 12 % within Gender 91.7% 8.3% 100.0% % within Perception Mihaylo 100.0% 100.0% 100.0% % of Total 91.7% 8.3% 100.0% Gender * Facebook Crosstab Facebook Total 1.00 2.00 Gender 1.00 Count 2 3 5 % within Gender 40.0% 60.0% 100.0% % within Facebook 28.6% 60.0% 41.7% % of Total 16.7% 25.0% 41.7% 2.00 Count 5 2 7 % within Gender 71.4% 28.6% 100.0% % within Facebook 71.4% 40.0% 58.3%
  • 6. % of Total 41.7% 16.7% 58.3% Total Count 7 5 12 % within Gender 58.3% 41.7% 100.0% % within Facebook 100.0% 100.0% 100.0% % of Total 58.3% 41.7% 100.0% Gender * Twitter Crosstab Twitter Total 1.00 2.00 Gender 1.00 Count 1 4 5 % within Gender 20.0% 80.0% 100.0% % within Twitter 20.0% 57.1% 41.7% % of Total 8.3% 33.3% 41.7% 2.00 Count 4 3 7 % within Gender 57.1% 42.9% 100.0% % within Twitter 80.0% 42.9% 58.3% % of Total 33.3% 25.0% 58.3% Total Count 5 7 12 % within Gender 41.7% 58.3% 100.0% % within Twitter 100.0% 100.0% 100.0% % of Total 41.7% 58.3% 100.0%
  • 7. Gender * LinkedIn Crosstab LinkedIn Total 1.00 2.00 Gender 1.00 Count 3 2 5 % within Gender 60.0% 40.0% 100.0% % within LinkedIn 42.9% 40.0% 41.7% % of Total 25.0% 16.7% 41.7% 2.00 Count 4 3 7 % within Gender 57.1% 42.9% 100.0% % within LinkedIn 57.1% 60.0% 58.3% % of Total 33.3% 25.0% 58.3% Total Count 7 5 12 % within Gender 58.3% 41.7% 100.0% % within LinkedIn 100.0% 100.0% 100.0% % of Total 58.3% 41.7% 100.0% Gender * Instagram Crosstab Instagram Total 1.00 2.00 Gender 1.00 Count 1 4 5
  • 8. % within Gender 20.0% 80.0% 100.0% % within Instagram 50.0% 40.0% 41.7% % of Total 8.3% 33.3% 41.7% 2.00 Count 1 6 7 % within Gender 14.3% 85.7% 100.0% % within Instagram 50.0% 60.0% 58.3% % of Total 8.3% 50.0% 58.3% Total Count 2 10 12 % within Gender 16.7% 83.3% 100.0% % within Instagram 100.0% 100.0% 100.0% % of Total 16.7% 83.3% 100.0% Gender * WhyCSUF Crosstab WhyCSUF 1.00 2.00 3.00 4.00 5.00 Gender 1.00 Count 4 0 1 0 0 % within Gender 80.0% 0.0% 20.0% 0.0% 0.0% % within WhyCSUF 57.1% 0.0% 50.0% 0.0% 0.0% % of Total 33.3% 0.0% 8.3% 0.0% 0.0% 2.00 Count 3 1 1 1 1
  • 9. % within Gender 42.9% 14.3% 14.3% 14.3% 14.3% % within WhyCSUF 42.9% 100.0% 50.0% 100.0% 100.0% % of Total 25.0% 8.3% 8.3% 8.3% 8.3% Total Count 7 1 2 1 1 % within Gender 58.3% 8.3% 16.7% 8.3% 8.3% % within WhyCSUF 100.0% 100.0% 100.0% 100.0% 100.0% % of Total 58.3% 8.3% 16.7% 8.3% 8.3% Crosstab Total Gender 1.00 Count 5 % within Gender 100.0% % within WhyCSUF 41.7% % of Total 41.7% 2.00 Count 7 % within Gender 100.0% % within WhyCSUF 58.3% % of Total 58.3% Total Count 12 % within Gender 100.0% % within WhyCSUF 100.0% % of Total 100.0% Gender * UseServices Crosstab
  • 10. UseServic es Total 1.00 2.00 3.00 4.00 Gender 1.00 Count 0 1 2 2 5 % within Gender 0.0% 20.0% 40.0% 40.0% 100.0% % within UseServic es 0.0% 50.0% 66.7% 40.0% 41.7% % of Total 0.0% 8.3% 16.7% 16.7% 41.7% 2.00 Count 2 1 1 3 7 % within Gender 28.6% 14.3% 14.3% 42.9% 100.0% % within UseServic es 100.0% 50.0% 33.3% 60.0% 58.3% % of Total 16.7% 8.3% 8.3% 25.0% 58.3% Total Count 2 2 3 5 12 % within Gender 16.7% 16.7% 25.0% 41.7% 100.0% % within UseServic es 100.0% 100.0% 100.0% 100.0% 100.0% % of Total 16.7% 16.7% 25.0% 41.7% 100.0% Gender * TimesAdvising Crosstab TimesAdvi sing Total 2.00 3.00 4.00 Gender 1.00 Count 3 0 2 5
  • 11. % within Gender 60.0% 0.0% 40.0% 100.0% % within TimesAdvi sing 42.9% 0.0% 50.0% 41.7% % of Total 25.0% 0.0% 16.7% 41.7% 2.00 Count 4 1 2 7 % within Gender 57.1% 14.3% 28.6% 100.0% % within TimesAdvi sing 57.1% 100.0% 50.0% 58.3% % of Total 33.3% 8.3% 16.7% 58.3% Total Count 7 1 4 12 % within Gender 58.3% 8.3% 33.3% 100.0% % within TimesAdvi sing 100.0% 100.0% 100.0% 100.0% % of Total 58.3% 8.3% 33.3% 100.0% Gender * ConcentrationCenter Crosstab Concentrat ionCenter Total 1.00 2.00 Gender 1.00 Count 1 4 5 % within Gender 20.0% 80.0% 100.0% % within Concentrat ionCenter 50.0% 40.0% 41.7%
  • 12. % of Total 8.3% 33.3% 41.7% 2.00 Count 1 6 7 % within Gender 14.3% 85.7% 100.0% % within Concentrat ionCenter 50.0% 60.0% 58.3% % of Total 8.3% 50.0% 58.3% Total Count 2 10 12 % within Gender 16.7% 83.3% 100.0% % within Concentrat ionCenter 100.0% 100.0% 100.0% % of Total 16.7% 83.3% 100.0% Gender * UseTutorCenter Crosstab UseTutorC enter Total 1.00 2.00 Gender 1.00 Count 2 3 5 % within Gender 40.0% 60.0% 100.0% % within UseTutorC enter 25.0% 75.0% 41.7% % of Total 16.7% 25.0% 41.7% 2.00 Count 6 1 7
  • 13. % within Gender 85.7% 14.3% 100.0% % within UseTutorC enter 75.0% 25.0% 58.3% % of Total 50.0% 8.3% 58.3% Total Count 8 4 12 % within Gender 66.7% 33.3% 100.0% % within UseTutorC enter 100.0% 100.0% 100.0% % of Total 66.7% 33.3% 100.0% Gender * LikeEmails Crosstab LikeEmails Total 1.00 2.00 Gender 1.00 Count 4 1 5 % within Gender 80.0% 20.0% 100.0% % within LikeEmails 44.4% 33.3% 41.7% % of Total 33.3% 8.3% 41.7% 2.00 Count 5 2 7 % within Gender 71.4% 28.6% 100.0% % within LikeEmails 55.6% 66.7% 58.3% % of Total 41.7% 16.7% 58.3% Total Count 9 3 12
  • 14. % within Gender 75.0% 25.0% 100.0% % within LikeEmails 100.0% 100.0% 100.0% % of Total 75.0% 25.0% 100.0% Gender * InfoFromTeacher Crosstab InfoFromT eacher Total 1.00 2.00 Gender 1.00 Count 2 3 5 % within Gender 40.0% 60.0% 100.0% % within InfoFromT eacher 28.6% 60.0% 41.7% % of Total 16.7% 25.0% 41.7% 2.00 Count 5 2 7 % within Gender 71.4% 28.6% 100.0% % within InfoFromT eacher 71.4% 40.0% 58.3% % of Total 41.7% 16.7% 58.3% Total Count 7 5 12 % within Gender 58.3% 41.7% 100.0% % within InfoFromT eacher 100.0% 100.0% 100.0%
  • 15. % of Total 58.3% 41.7% 100.0% Gender * UseOfficeHours Crosstab UseOffice Hours Total 1.00 Gender 1.00 Count 5 5 % within Gender 100.0% 100.0% % within UseOfficeHours 41.7% 41.7% % of Total 41.7% 41.7% 2.00 Count 7 7 % within Gender 100.0% 100.0% % within UseOfficeHours 58.3% 58.3% % of Total 58.3% 58.3% Total Count 12 12 % within Gender 100.0% 100.0% % within UseOfficeHours 100.0% 100.0% % of Total 100.0% 100.0% Gender * CareerCenter Crosstab CareerCen ter Total 1.00 2.00 Gender 1.00 Count 2 3 5
  • 16. % within Gender 40.0% 60.0% 100.0% % within CareerCen ter 40.0% 42.9% 41.7% % of Total 16.7% 25.0% 41.7% 2.00 Count 3 4 7 % within Gender 42.9% 57.1% 100.0% % within CareerCen ter 60.0% 57.1% 58.3% % of Total 25.0% 33.3% 58.3% Total Count 5 7 12 % within Gender 41.7% 58.3% 100.0% % within CareerCen ter 100.0% 100.0% 100.0% % of Total 41.7% 58.3% 100.0% Gender * LeadershipCenter Crosstab Leadership Center Total 2.00 Gender 1.00 Count 5 5 % within Gender 100.0% 100.0% % within LeadershipCent er 41.7% 41.7% % of Total 41.7% 41.7%
  • 17. 2.00 Count 7 7 % within Gender 100.0% 100.0% % within LeadershipCent er 58.3% 58.3% % of Total 58.3% 58.3% Total Count 12 12 % within Gender 100.0% 100.0% % within LeadershipCent er 100.0% 100.0% % of Total 100.0% 100.0% Gender * UseAllServices Crosstab UseAllServ ices Total 1.00 2.00 Gender 1.00 Count 0 5 5 % within Gender 0.0% 100.0% 100.0% % within UseAllServ ices 0.0% 45.5% 41.7% % of Total 0.0% 41.7% 41.7% 2.00 Count 1 6 7 % within Gender 14.3% 85.7% 100.0% % within UseAllServ ices 100.0% 54.5% 58.3%
  • 18. % of Total 8.3% 50.0% 58.3% Total Count 1 11 12 % within Gender 8.3% 91.7% 100.0% % within UseAllServ ices 100.0% 100.0% 100.0% % of Total 8.3% 91.7% 100.0% GradeLevel * Interactive Crosstab Interactive Total 1.00 2.00 GradeL evel 3.00 Count 0 3 3 % within GradeLeve l 0.0% 100.0% 100.0% % within Interactive 0.0% 27.3% 25.0% % of Total 0.0% 25.0% 25.0% 4.00 Count 1 8 9 % within GradeLeve l 11.1% 88.9% 100.0% % within Interactive 100.0% 72.7% 75.0% % of Total 8.3% 66.7% 75.0% Total Count 1 11 12 % within GradeLeve l 8.3% 91.7% 100.0%
  • 19. % within Interactive 100.0% 100.0% 100.0% % of Total 8.3% 91.7% 100.0% GradeLevel * Informative Crosstab Informative Total 1.00 2.00 3.00 GradeL evel 3.00 Count 1 1 1 3 % within GradeLeve l 33.3% 33.3% 33.3% 100.0% % within Informative 16.7% 33.3% 33.3% 25.0% % of Total 8.3% 8.3% 8.3% 25.0% 4.00 Count 5 2 2 9 % within GradeLeve l 55.6% 22.2% 22.2% 100.0% % within Informative 83.3% 66.7% 66.7% 75.0% % of Total 41.7% 16.7% 16.7% 75.0% Total Count 6 3 3 12 % within GradeLeve l 50.0% 25.0% 25.0% 100.0% % within Informative 100.0% 100.0% 100.0% 100.0% % of Total 50.0% 25.0% 25.0% 100.0% GradeLevel * Organized Crosstab
  • 20. Organized Total 1.00 2.00 GradeL evel 3.00 Count 0 3 3 % within GradeLeve l 0.0% 100.0% 100.0% % within Organized 0.0% 27.3% 25.0% % of Total 0.0% 25.0% 25.0% 4.00 Count 1 8 9 % within GradeLeve l 11.1% 88.9% 100.0% % within Organized 100.0% 72.7% 75.0% % of Total 8.3% 66.7% 75.0% Total Count 1 11 12 % within GradeLeve l 8.3% 91.7% 100.0% % within Organized 100.0% 100.0% 100.0% % of Total 8.3% 91.7% 100.0% GradeLevel * WebsiteUses Crosstab WebsiteUs es Total 1.00 2.00 3.00 GradeL 3.00 Count 3 0 0 3
  • 21. evel % within GradeLeve l 100.0% 0.0% 0.0% 100.0% % within WebsiteUs es 37.5% 0.0% 0.0% 25.0% % of Total 25.0% 0.0% 0.0% 25.0% 4.00 Count 5 3 1 9 % within GradeLeve l 55.6% 33.3% 11.1% 100.0% % within WebsiteUs es 62.5% 100.0% 100.0% 75.0% % of Total 41.7% 25.0% 8.3% 75.0% Total Count 8 3 1 12 % within GradeLeve l 66.7% 25.0% 8.3% 100.0% % within WebsiteUs es 100.0% 100.0% 100.0% 100.0% % of Total 66.7% 25.0% 8.3% 100.0% GradeLevel * BackgroundImage Crosstab Backgroun dImage Total 1.00 2.00 GradeL 3.00 Count 3 0 3
  • 22. evel % within GradeLeve l 100.0% 0.0% 100.0% % within Backgroun dImage 37.5% 0.0% 25.0% % of Total 25.0% 0.0% 25.0% 4.00 Count 5 4 9 % within GradeLeve l 55.6% 44.4% 100.0% % within Backgroun dImage 62.5% 100.0% 75.0% % of Total 41.7% 33.3% 75.0% Total Count 8 4 12 % within GradeLeve l 66.7% 33.3% 100.0% % within Backgroun dImage 100.0% 100.0% 100.0% % of Total 66.7% 33.3% 100.0% GradeLevel * UsefulBackground Crosstab UsefulBac kground Total 1.00 2.00 GradeL 3.00 Count 1 2 3
  • 23. evel % within GradeLeve l 33.3% 66.7% 100.0% % within UsefulBac kground 25.0% 25.0% 25.0% % of Total 8.3% 16.7% 25.0% 4.00 Count 3 6 9 % within GradeLeve l 33.3% 66.7% 100.0% % within UsefulBac kground 75.0% 75.0% 75.0% % of Total 25.0% 50.0% 75.0% Total Count 4 8 12 % within GradeLeve l 33.3% 66.7% 100.0% % within UsefulBac kground 100.0% 100.0% 100.0% % of Total 33.3% 66.7% 100.0% GradeLevel * PerceptionMihaylo Crosstab Perception Mihaylo Total 1.00 2.00 GradeL evel 3.00 Count 3 0 3 % within GradeLeve l 100.0% 0.0% 100.0%
  • 24. % within Perception Mihaylo 27.3% 0.0% 25.0% % of Total 25.0% 0.0% 25.0% 4.00 Count 8 1 9 % within GradeLeve l 88.9% 11.1% 100.0% % within Perception Mihaylo 72.7% 100.0% 75.0% % of Total 66.7% 8.3% 75.0% Total Count 11 1 12 % within GradeLeve l 91.7% 8.3% 100.0% % within Perception Mihaylo 100.0% 100.0% 100.0% % of Total 91.7% 8.3% 100.0% GradeLevel * Facebook Crosstab Facebook Total 1.00 2.00 GradeL evel 3.00 Count 1 2 3 % within GradeLeve l 33.3% 66.7% 100.0% % within Facebook 14.3% 40.0% 25.0% % of Total 8.3% 16.7% 25.0%
  • 25. 4.00 Count 6 3 9 % within GradeLeve l 66.7% 33.3% 100.0% % within Facebook 85.7% 60.0% 75.0% % of Total 50.0% 25.0% 75.0% Total Count 7 5 12 % within GradeLeve l 58.3% 41.7% 100.0% % within Facebook 100.0% 100.0% 100.0% % of Total 58.3% 41.7% 100.0% GradeLevel * Twitter Crosstab Twitter Total 1.00 2.00 GradeL evel 3.00 Count 0 3 3 % within GradeLeve l 0.0% 100.0% 100.0% % within Twitter 0.0% 42.9% 25.0% % of Total 0.0% 25.0% 25.0% 4.00 Count 5 4 9 % within GradeLeve l 55.6% 44.4% 100.0%
  • 26. % within Twitter 100.0% 57.1% 75.0% % of Total 41.7% 33.3% 75.0% Total Count 5 7 12 % within GradeLeve l 41.7% 58.3% 100.0% % within Twitter 100.0% 100.0% 100.0% % of Total 41.7% 58.3% 100.0% GradeLevel * LinkedIn Crosstab LinkedIn Total 1.00 2.00 GradeL evel 3.00 Count 2 1 3 % within GradeLeve l 66.7% 33.3% 100.0% % within LinkedIn 28.6% 20.0% 25.0% % of Total 16.7% 8.3% 25.0% 4.00 Count 5 4 9 % within GradeLeve l 55.6% 44.4% 100.0% % within LinkedIn 71.4% 80.0% 75.0% % of Total 41.7% 33.3% 75.0% Total Count 7 5 12
  • 27. % within GradeLeve l 58.3% 41.7% 100.0% % within LinkedIn 100.0% 100.0% 100.0% % of Total 58.3% 41.7% 100.0% GradeLevel * Instagram Crosstab Instagram Total 1.00 2.00 GradeL evel 3.00 Count 0 3 3 % within GradeLeve l 0.0% 100.0% 100.0% % within Instagram 0.0% 30.0% 25.0% % of Total 0.0% 25.0% 25.0% 4.00 Count 2 7 9 % within GradeLeve l 22.2% 77.8% 100.0% % within Instagram 100.0% 70.0% 75.0% % of Total 16.7% 58.3% 75.0% Total Count 2 10 12 % within GradeLeve l 16.7% 83.3% 100.0% % within Instagram 100.0% 100.0% 100.0%
  • 28. % of Total 16.7% 83.3% 100.0% GradeLevel * WhyCSUF Crosstab WhyCSUF 1.00 2.00 3.00 4.00 5.00 GradeL evel 3.00 Count 3 0 0 0 0 % within GradeLeve l 100.0% 0.0% 0.0% 0.0% 0.0% % within WhyCSUF 42.9% 0.0% 0.0% 0.0% 0.0% % of Total 25.0% 0.0% 0.0% 0.0% 0.0% 4.00 Count 4 1 2 1 1 % within GradeLeve l 44.4% 11.1% 22.2% 11.1% 11.1% % within WhyCSUF 57.1% 100.0% 100.0% 100.0% 100.0% % of Total 33.3% 8.3% 16.7% 8.3% 8.3% Total Count 7 1 2 1 1 % within GradeLeve l 58.3% 8.3% 16.7% 8.3% 8.3% % within WhyCSUF 100.0% 100.0% 100.0% 100.0% 100.0% % of Total 58.3% 8.3% 16.7% 8.3% 8.3% Crosstab Total GradeLevel 3.00 Count 3
  • 29. % within GradeLevel 100.0% % within WhyCSUF 25.0% % of Total 25.0% 4.00 Count 9 % within GradeLevel 100.0% % within WhyCSUF 75.0% % of Total 75.0% Total Count 12 % within GradeLevel 100.0% % within WhyCSUF 100.0% % of Total 100.0% GradeLevel * ScaleCommunication Crosstab ScaleCommunication 1.00 2.00 3.00 4.00 5.00 GradeL evel 3.00 Count 0 1 1 1 0 % within GradeLev el 0.0% 33.3% 33.3% 33.3% 0.0% % within ScaleCom munication 0.0% 100.0% 50.0% 20.0% 0.0% % of Total 0.0% 8.3% 8.3% 8.3% 0.0% 4.00 Count 2 0 1 4 2 % within GradeLev el 22.2% 0.0% 11.1% 44.4% 22.2%
  • 30. % within ScaleCom munication 100.0% 0.0% 50.0% 80.0% 100.0% % of Total 16.7% 0.0% 8.3% 33.3% 16.7% Total Count 2 1 2 5 2 % within GradeLev el 16.7% 8.3% 16.7% 41.7% 16.7% % within ScaleCom munication 100.0% 100.0% 100.0% 100.0% 100.0% % of Total 16.7% 8.3% 16.7% 41.7% 16.7% GradeLevel * UseServices Crosstab UseServic es Total 1.00 2.00 3.00 4.00 GradeL evel 3.00 Count 0 0 2 1 3 % within GradeLeve l 0.0% 0.0% 66.7% 33.3% 100.0% % within UseServic es 0.0% 0.0% 66.7% 20.0% 25.0% % of Total 0.0% 0.0% 16.7% 8.3% 25.0% 4.00 Count 2 2 1 4 9 % within GradeLeve l 22.2% 22.2% 11.1% 44.4% 100.0%
  • 31. % within UseServic es 100.0% 100.0% 33.3% 80.0% 75.0% % of Total 16.7% 16.7% 8.3% 33.3% 75.0% Total Count 2 2 3 5 12 % within GradeLeve l 16.7% 16.7% 25.0% 41.7% 100.0% % within UseServic es 100.0% 100.0% 100.0% 100.0% 100.0% % of Total 16.7% 16.7% 25.0% 41.7% 100.0% GradeLevel * TimesAdvising Crosstab TimesAdvi sing Total 2.00 3.00 4.00 GradeL evel 3.00 Count 2 0 1 3 % within GradeLeve l 66.7% 0.0% 33.3% 100.0% % within TimesAdvi sing 28.6% 0.0% 25.0% 25.0% % of Total 16.7% 0.0% 8.3% 25.0% 4.00 Count 5 1 3 9 % within GradeLeve l 55.6% 11.1% 33.3% 100.0% % within TimesAdvi sing 71.4% 100.0% 75.0% 75.0%
  • 32. % of Total 41.7% 8.3% 25.0% 75.0% Total Count 7 1 4 12 % within GradeLeve l 58.3% 8.3% 33.3% 100.0% % within TimesAdvi sing 100.0% 100.0% 100.0% 100.0% % of Total 58.3% 8.3% 33.3% 100.0% GradeLevel * ConcentrationCenter Crosstab Concentrat ionCenter Total 1.00 2.00 GradeL evel 3.00 Count 1 2 3 % within GradeLeve l 33.3% 66.7% 100.0% % within Concentrat ionCenter 50.0% 20.0% 25.0% % of Total 8.3% 16.7% 25.0% 4.00 Count 1 8 9 % within GradeLeve l 11.1% 88.9% 100.0% % within Concentrat ionCenter 50.0% 80.0% 75.0% % of Total 8.3% 66.7% 75.0% Total Count 2 10 12
  • 33. % within GradeLeve l 16.7% 83.3% 100.0% % within Concentrat ionCenter 100.0% 100.0% 100.0% % of Total 16.7% 83.3% 100.0% GradeLevel * UseTutorCenter Crosstab UseTutorC enter Total 1.00 2.00 GradeL evel 3.00 Count 1 2 3 % within GradeLeve l 33.3% 66.7% 100.0% % within UseTutorC enter 12.5% 50.0% 25.0% % of Total 8.3% 16.7% 25.0% 4.00 Count 7 2 9 % within GradeLeve l 77.8% 22.2% 100.0% % within UseTutorC enter 87.5% 50.0% 75.0% % of Total 58.3% 16.7% 75.0% Total Count 8 4 12
  • 34. % within GradeLeve l 66.7% 33.3% 100.0% % within UseTutorC enter 100.0% 100.0% 100.0% % of Total 66.7% 33.3% 100.0% GradeLevel * LikeEmails Crosstab LikeEmails Total 1.00 2.00 GradeL evel 3.00 Count 2 1 3 % within GradeLeve l 66.7% 33.3% 100.0% % within LikeEmails 22.2% 33.3% 25.0% % of Total 16.7% 8.3% 25.0% 4.00 Count 7 2 9 % within GradeLeve l 77.8% 22.2% 100.0% % within LikeEmails 77.8% 66.7% 75.0% % of Total 58.3% 16.7% 75.0% Total Count 9 3 12 % within GradeLeve l 75.0% 25.0% 100.0% % within LikeEmails 100.0% 100.0% 100.0%
  • 35. % of Total 75.0% 25.0% 100.0% GradeLevel * InfoFromTeacher Crosstab InfoFromT eacher Total 1.00 2.00 GradeL evel 3.00 Count 1 2 3 % within GradeLeve l 33.3% 66.7% 100.0% % within InfoFromT eacher 14.3% 40.0% 25.0% % of Total 8.3% 16.7% 25.0% 4.00 Count 6 3 9 % within GradeLeve l 66.7% 33.3% 100.0% % within InfoFromT eacher 85.7% 60.0% 75.0% % of Total 50.0% 25.0% 75.0% Total Count 7 5 12 % within GradeLeve l 58.3% 41.7% 100.0% % within InfoFromT eacher 100.0% 100.0% 100.0% % of Total 58.3% 41.7% 100.0%
  • 36. GradeLevel * UseOfficeHours Crosstab UseOffice Hours Total 1.00 GradeL evel 3.00 Count 3 3 % within GradeLevel 100.0% 100.0% % within UseOfficeHours 25.0% 25.0% % of Total 25.0% 25.0% 4.00 Count 9 9 % within GradeLevel 100.0% 100.0% % within UseOfficeHours 75.0% 75.0% % of Total 75.0% 75.0% Total Count 12 12 % within GradeLevel 100.0% 100.0% % within UseOfficeHours 100.0% 100.0% % of Total 100.0% 100.0% GradeLevel * CareerCenter Crosstab CareerCen ter Total 1.00 2.00 GradeL 3.00 Count 1 2 3
  • 37. evel % within GradeLeve l 33.3% 66.7% 100.0% % within CareerCen ter 20.0% 28.6% 25.0% % of Total 8.3% 16.7% 25.0% 4.00 Count 4 5 9 % within GradeLeve l 44.4% 55.6% 100.0% % within CareerCen ter 80.0% 71.4% 75.0% % of Total 33.3% 41.7% 75.0% Total Count 5 7 12 % within GradeLeve l 41.7% 58.3% 100.0% % within CareerCen ter 100.0% 100.0% 100.0% % of Total 41.7% 58.3% 100.0% GradeLevel * LeadershipCenter Crosstab Leadership Center Total 2.00 GradeL evel 3.00 Count 3 3 % within GradeLevel 100.0% 100.0%
  • 38. % within LeadershipCent er 25.0% 25.0% % of Total 25.0% 25.0% 4.00 Count 9 9 % within GradeLevel 100.0% 100.0% % within LeadershipCent er 75.0% 75.0% % of Total 75.0% 75.0% Total Count 12 12 % within GradeLevel 100.0% 100.0% % within LeadershipCent er 100.0% 100.0% % of Total 100.0% 100.0% GradeLevel * UseAllServices Crosstab UseAllServ ices Total 1.00 2.00 GradeL evel 3.00 Count 0 3 3 % within GradeLeve l 0.0% 100.0% 100.0% % within UseAllServ ices 0.0% 27.3% 25.0% % of Total 0.0% 25.0% 25.0% 4.00 Count 1 8 9
  • 39. % within GradeLeve l 11.1% 88.9% 100.0% % within UseAllServ ices 100.0% 72.7% 75.0% % of Total 8.3% 66.7% 75.0% Total Count 1 11 12 % within GradeLeve l 8.3% 91.7% 100.0% % within UseAllServ ices 100.0% 100.0% 100.0% % of Total 8.3% 91.7% 100.0% Concentration * Interactive Crosstab Interactive Total 1.00 2.00 Concen tration 1.00 Count 0 2 2 % within Concentrat ion 0.0% 100.0% 100.0% % within Interactive 0.0% 18.2% 16.7% % of Total 0.0% 16.7% 16.7% 2.00 Count 0 1 1 % within Concentrat ion 0.0% 100.0% 100.0% % within Interactive 0.0% 9.1% 8.3%
  • 40. % of Total 0.0% 8.3% 8.3% 3.00 Count 0 1 1 % within Concentrat ion 0.0% 100.0% 100.0% % within Interactive 0.0% 9.1% 8.3% % of Total 0.0% 8.3% 8.3% 4.00 Count 1 3 4 % within Concentrat ion 25.0% 75.0% 100.0% % within Interactive 100.0% 27.3% 33.3% % of Total 8.3% 25.0% 33.3% 5.00 Count 0 1 1 % within Concentrat ion 0.0% 100.0% 100.0% % within Interactive 0.0% 9.1% 8.3% % of Total 0.0% 8.3% 8.3% 6.00 Count 0 2 2 % within Concentrat ion 0.0% 100.0% 100.0% % within Interactive 0.0% 18.2% 16.7% % of Total 0.0% 16.7% 16.7% 7.00 Count 0 1 1
  • 41. % within Concentrat ion 0.0% 100.0% 100.0% % within Interactive 0.0% 9.1% 8.3% % of Total 0.0% 8.3% 8.3% Total Count 1 11 12 % within Concentrat ion 8.3% 91.7% 100.0% % within Interactive 100.0% 100.0% 100.0% % of Total 8.3% 91.7% 100.0% Concentration * Informative Crosstab Informative Total 1.00 2.00 3.00 Concen tration 1.00 Count 1 0 1 2 % within Concentrat ion 50.0% 0.0% 50.0% 100.0% % within Informative 16.7% 0.0% 33.3% 16.7% % of Total 8.3% 0.0% 8.3% 16.7% 2.00 Count 0 0 1 1 % within Concentrat ion 0.0% 0.0% 100.0% 100.0% % within Informative 0.0% 0.0% 33.3% 8.3% % of Total 0.0% 0.0% 8.3% 8.3%
  • 42. 3.00 Count 0 1 0 1 % within Concentrat ion 0.0% 100.0% 0.0% 100.0% % within Informative 0.0% 33.3% 0.0% 8.3% % of Total 0.0% 8.3% 0.0% 8.3% 4.00 Count 3 1 0 4 % within Concentrat ion 75.0% 25.0% 0.0% 100.0% % within Informative 50.0% 33.3% 0.0% 33.3% % of Total 25.0% 8.3% 0.0% 33.3% 5.00 Count 1 0 0 1 % within Concentrat ion 100.0% 0.0% 0.0% 100.0% % within Informative 16.7% 0.0% 0.0% 8.3% % of Total 8.3% 0.0% 0.0% 8.3% 6.00 Count 1 0 1 2 % within Concentrat ion 50.0% 0.0% 50.0% 100.0% % within Informative 16.7% 0.0% 33.3% 16.7% % of Total 8.3% 0.0% 8.3% 16.7% 7.00 Count 0 1 0 1 % within Concentrat ion 0.0% 100.0% 0.0% 100.0%
  • 43. % within Informative 0.0% 33.3% 0.0% 8.3% % of Total 0.0% 8.3% 0.0% 8.3% Total Count 6 3 3 12 % within Concentrat ion 50.0% 25.0% 25.0% 100.0% % within Informative 100.0% 100.0% 100.0% 100.0% % of Total 50.0% 25.0% 25.0% 100.0% Concentration * Organized Crosstab Organized Total 1.00 2.00 Concen tration 1.00 Count 0 2 2 % within Concentrat ion 0.0% 100.0% 100.0% % within Organized 0.0% 18.2% 16.7% % of Total 0.0% 16.7% 16.7% 2.00 Count 0 1 1 % within Concentrat ion 0.0% 100.0% 100.0% % within Organized 0.0% 9.1% 8.3% % of Total 0.0% 8.3% 8.3% 3.00 Count 0 1 1
  • 44. % within Concentrat ion 0.0% 100.0% 100.0% % within Organized 0.0% 9.1% 8.3% % of Total 0.0% 8.3% 8.3% 4.00 Count 0 4 4 % within Concentrat ion 0.0% 100.0% 100.0% % within Organized 0.0% 36.4% 33.3% % of Total 0.0% 33.3% 33.3% 5.00 Count 1 0 1 % within Concentrat ion 100.0% 0.0% 100.0% % within Organized 100.0% 0.0% 8.3% % of Total 8.3% 0.0% 8.3% 6.00 Count 0 2 2 % within Concentrat ion 0.0% 100.0% 100.0% % within Organized 0.0% 18.2% 16.7% % of Total 0.0% 16.7% 16.7% 7.00 Count 0 1 1 % within Concentrat ion 0.0% 100.0% 100.0%
  • 45. % within Organized 0.0% 9.1% 8.3% % of Total 0.0% 8.3% 8.3% Total Count 1 11 12 % within Concentrat ion 8.3% 91.7% 100.0% % within Organized 100.0% 100.0% 100.0% % of Total 8.3% 91.7% 100.0% Concentration * WebsiteUses Crosstab WebsiteUs es Total 1.00 2.00 3.00 Concen tration 1.00 Count 1 1 0 2 % within Concentrat ion 50.0% 50.0% 0.0% 100.0% % within WebsiteUs es 12.5% 33.3% 0.0% 16.7% % of Total 8.3% 8.3% 0.0% 16.7% 2.00 Count 0 1 0 1 % within Concentrat ion 0.0% 100.0% 0.0% 100.0% % within WebsiteUs es 0.0% 33.3% 0.0% 8.3% % of Total 0.0% 8.3% 0.0% 8.3%
  • 46. 3.00 Count 1 0 0 1 % within Concentrat ion 100.0% 0.0% 0.0% 100.0% % within WebsiteUs es 12.5% 0.0% 0.0% 8.3% % of Total 8.3% 0.0% 0.0% 8.3% 4.00 Count 3 1 0 4 % within Concentrat ion 75.0% 25.0% 0.0% 100.0% % within WebsiteUs es 37.5% 33.3% 0.0% 33.3% % of Total 25.0% 8.3% 0.0% 33.3% 5.00 Count 0 0 1 1 % within Concentrat ion 0.0% 0.0% 100.0% 100.0% % within WebsiteUs es 0.0% 0.0% 100.0% 8.3% % of Total 0.0% 0.0% 8.3% 8.3% 6.00 Count 2 0 0 2 % within Concentrat ion 100.0% 0.0% 0.0% 100.0% % within WebsiteUs es 25.0% 0.0% 0.0% 16.7% % of Total 16.7% 0.0% 0.0% 16.7%
  • 47. 7.00 Count 1 0 0 1 % within Concentrat ion 100.0% 0.0% 0.0% 100.0% % within WebsiteUs es 12.5% 0.0% 0.0% 8.3% % of Total 8.3% 0.0% 0.0% 8.3% Total Count 8 3 1 12 % within Concentrat ion 66.7% 25.0% 8.3% 100.0% % within WebsiteUs es 100.0% 100.0% 100.0% 100.0% % of Total 66.7% 25.0% 8.3% 100.0% Concentration * PerceptionMihaylo Crosstab Perception Mihaylo Total 1.00 2.00 Concen tration 1.00 Count 2 0 2 % within Concentrat ion 100.0% 0.0% 100.0% % within Perception Mihaylo 18.2% 0.0% 16.7% % of Total 16.7% 0.0% 16.7% 2.00 Count 1 0 1
  • 48. % within Concentrat ion 100.0% 0.0% 100.0% % within Perception Mihaylo 9.1% 0.0% 8.3% % of Total 8.3% 0.0% 8.3% 3.00 Count 1 0 1 % within Concentrat ion 100.0% 0.0% 100.0% % within Perception Mihaylo 9.1% 0.0% 8.3% % of Total 8.3% 0.0% 8.3% 4.00 Count 4 0 4 % within Concentrat ion 100.0% 0.0% 100.0% % within Perception Mihaylo 36.4% 0.0% 33.3% % of Total 33.3% 0.0% 33.3% 5.00 Count 1 0 1 % within Concentrat ion 100.0% 0.0% 100.0% % within Perception Mihaylo 9.1% 0.0% 8.3% % of Total 8.3% 0.0% 8.3% 6.00 Count 2 0 2
  • 49. % within Concentrat ion 100.0% 0.0% 100.0% % within Perception Mihaylo 18.2% 0.0% 16.7% % of Total 16.7% 0.0% 16.7% 7.00 Count 0 1 1 % within Concentrat ion 0.0% 100.0% 100.0% % within Perception Mihaylo 0.0% 100.0% 8.3% % of Total 0.0% 8.3% 8.3% Total Count 11 1 12 % within Concentrat ion 91.7% 8.3% 100.0% % within Perception Mihaylo 100.0% 100.0% 100.0% % of Total 91.7% 8.3% 100.0%