1. Introduction
Presented report is a result of group project implementation. It is based on the analysis of two big
companies, namely Exxonmobil and BP, operating in oil and gas industry. The time framework
of the report is 2007-2011.
BP, British Petrolium or Beyond petroleum as of May, 2001, is one of the world‟s leading
international gas and oil companies. Its core business includes providing fuel for transportation
(petroleum, motor fuels and aviation fuels), energy for heat and light and petrochemical products
for everyday items. The core BP brands are Castrol (motor oil and lubricants), BP, ARCO (fuel /
US West Coast), ARAL (fuel stations / Germany), AMPM (convenience shops / Western USA)
and Wild Bean Café.
As to the business model of BP, the company covers the entire hydrocarbon chain, that is, BP
explores and goes all the way up to supplying energy and other products. The way includes gas
and oil exploration, field development and production, transportation, storage and processing,
refining, transportation, manufacturing and marketing.
BP is also involved in alternative energy business. The aim of this business is to focus on the
new forms of fuel and power, which consume less carbon and are called lower-carbon products.
It has invested 7 billion US dollars into this business (BP 2012).
With its proved reserves of 17.7 billion of barrel equivalent (Ibid.), BP is considered to be one of
the largest suppliers of oil products all over the world. Owning 16 oil refineries which refine
2.35 million barrels on a daily basis (figure of 2011), BP is striving to reach its maximum output
in production (Ibid.).
As at December 31, the number of employees working in BP reached the figure of 83, 400.
BP‟s revenue for 2011 was 375,517 million US dollars, total assets of the company made up
290,920 million US dollars and total equity was 111,460 million US dollars (Ibid.).
Exxonmobil is the largest oil and gas company in the world. Its core business is providing
petroleum products such as fuel oil, gasoline, diesel, jet fuel, lubes and others; energy and
petrochemical products. The Exxonmobil corporation consists of ten separate companies which
form three segments, the Upstream which deals with oil exploration, extraction, shipping and
2. wholesale operations; the Downstream which does marketing, refining and retail operations; and
The Chemical business which involves production of building blocks which are used to make
plastic bottles, packaging materials, car bumpers, polyester fiber and other consumer goods.
Being the leader practically in all aspects of oil and petrochemical industry Exxonmobil is
presented in most countries of the world and its explorations of oil and gas are continuously
made on six continents. Exxonmobil‟s core brands are Exxon, Esso and Mobil.
Exxonmobil has 37 oil refineries in 21 countries which refine 6.3 million barrels daily. With its
proved reserves of 22.4 billions of barrel equivalent (figure of 2011), Exxonmobil is one of the
world‟s leaders in terms of oil reservoirs (Exxonmobile 2012).
As at December 31, the number of employees working in Exxonmobil reached 99, 100.
Exxonmobil is the largest in the world by revenue, its revenue for 2011 made up 486, 429
million US dollars, total assets of the company amounted to 349,00 million US dollars and total
equity was calculated as 154,396 million US dollars (Ibid.).
The objectives of the report are: to assess the financial position of both companies in the
framework of global oil and gas industry, to compare the positions and to comment on the
results, to provide recommendations based on the analysis.
In order to reach the objectives the structure of report includes executive summary, introduction,
industrial analysis, companies analysis, balanced scorecard and conclusion.
3. CHAPTER I: INDUSTRY ANALYSIS
This short outlook of oil and gas industry was made for quick acquaintance with the industry
only as the main purpose of the current report is not oil and gas industry itself. So the chapter is
included as a brief introduction of oil and gas sector.
Oil and gas industry is one of the key players in terms of world economy. The industry includes
mainly exploration and production (the upstream sector), and refining (downstream sector) of
crude oil and natural gas. The industry provides 60% of customers energy needs (Petroleum
Online 2012).
Global energy consumption increased by 2.5 % in 2011. It is comparable with the historical
average, but considerably less than 5.1% in 2010 (BP Statistical Review of World Energy 2012).
The growth of energy consumption of the developing economies is the main reason all of the net
growth in energy consumption. According to BP Statistical Review of World Energy “All of the
net growth took place in emerging economies, with China alone accounting for 71% of global
energy consumption growth” (Ibid.). At the same time OECD demand has decreased again.
Fossil fuels continue to lead in energy consumption, posses 87% market share. Oil continues to
dominate the consumption, at 33.1% of global energy consumption, but also continues to lose its
market share, which reached the bottom since 1965 (Ibid.). In spite of beneficial prices for oil,
even producing regions of the Middle East and Africa showed weak consumption growth
because of disorders in the region. As for refined products, middle distillates remained the leader
again in terms of volume.
Natural gas consumption showed a slight growth by 2.2% (Ibid.). North America was the only
region that demonstrated the above-average growth due to the low prices. Natural gas
consumption considerably increased in China, Saudi Arabia and Japan, but dramatically dropped
in EU.
4. Top World Oil Consumers, 2011
(Thousand Barrels per Day)
2,293
2,400 United States
2,230
China
2,725 18,949
Japan
2,793
India
2,986
Saudi Arabia
3,426
Brasil
4,464 Russia
8,924
Germany
Canada
Korea, South
Figure 1.1 Top World Oil Consumers, 2011
Source: U.S. Energy Information Administration, Countries Overview
Top World Natural Gas Consumers, 2011
(Billion Cubic Meters)
683.3
700
600
500 414.1
400
300 137.5 129 100.3 99.5 94.28 83.94
200 82.48 77.8
100
0
Figure 1.2 Top World Natural Gas Consumers, 2011
Source: CIA World Factbook
5. Oil production increased despite of the loss of suppliers in Libya due to large increases among
Middle Eastern OPEC members, with large increases in Saudi Arabia, the UAE, Kuwait and
Iraq. The US showed a significant non-OPEC production rise, along with Canada, Russia and
Columbia. Such traditional suppliers as the UK and Norway showed continued decrease.
Natural gas production rose slightly with the US remaining the world‟s largest producer and
rapid growth in Qatar‟s, Russia‟s and Turkmenistan‟s output. Meanwhile the production in
Libya, the UK and the EU declined.
Top World Oil Producers, 2011
(Thousand Barrels per Day)
2,687
Saudi Arabia
2,959
2,682
11,153 Russia
3,088 United States
3,600 China
10,229 Iran
4,234
Canada
4,289
United Arab Emirates
10,128
Mexico
Brazil
Kuwait
Figure 1.3 Top World Oil Producers, 2011
Source: U.S. Energy Information Administration, Countries Overview
6. Top World Natural Gas Producers, 2011
(Billion Cubic Meters)
700 611 588.9
600
500
400
300 152.3 138.5 116.7 106.3 102.5
200 85.17 85.14 83.94
100
0
Figure 1.4 Top World Natural Gas Producers, 2011
Source: CIA World Factbook
Global oil and gas trade both experienced growth in 2011 (2% and 4% respectively). Again
China responded for about two-thirds of growth in oil trade. Middle East countries responded for
about four-fifth of growth in oil exports. Crude oil trade made up 70% of global trade in 2011,
while refined products accounted for about 60%of the growth in global trade. LNG shipments
grew significantly compared to natural gas pipeline shipments, accounting for about a third of
global gas trade. Pipeline shipments increased in China (from Turkmenistan), Ukraine (from
Russia), and Turkey (from Russia and Iran) (BP Statistical Review of World Energy 2012).
7. Top World Oil Net Exporters, 2011
(Thousand Barrels per Day)
Saudi Arabia
1,752 1,490 Russia
1,817 1,752
8,167 United Arab Emirates
2,206
Kuwait
2,343 7,504 Nigeria
2,601
Iran
2,242
Iraq
Norway
Angola
Venezuela
Figure 1.5 Top World Oil Net Exporters, 2011
Source: U.S. Energy Information Administration, Countries Overview
Top World Oil Net Importers, 2011
(Thousand Barrels per Day)
1,292
1,346 United States
1,697 948
China
8,822
Japan
2,170
India
2,235
Germany
2,489 4,635 Korea, South
France
4,329
Spain
Italy
Netherlands
Figure 1.6 Top World Oil Net Importers, 2011
Source: U.S. Energy Information Administration, Countries Overview
8. Top World Natural Gas Exporters, 2011
(Billion Cubic Meters)
199.9
200
150
99.75 94.81 92.4
100 57.75 55.28
42.33 32.2 30.79
50 24.7
0
Figure 1.7 Top World Natural Gas Exporters, 2011
Source: CIA World Factbook
Top World Natural Gas Importers, 2011
(Billion Cubic Meters)
120 105.8
99.63 98.01
100
70.2
80
53.63
60 46.2 42.38 38.2 38.04 36.71
40
20
0
Figure 1.8 Top World Natural Gas Importers, 2011
Source: CIA World Factbook
It is often speculated about lack of global oil and gas reserves. Due to OPEC‟s World Oil
Outlook “the world has more than enough oil resources to satisfy consumer demand for many
9. decades” (OPEC 2012). Now they are estimated to be four trillion barrels (Ibid.). Technological
development let companies benefit more from the recoveries from producing fields and let them
reach new both OPEC and non-OPEC areas that still have not been explored.
The main features that characterize the industry nowadays and the main challenges the industry
is facing are as follows. A so-called shale gas “revolution” is taking place in the industry. It is
obvious that the resource could play an important role in the global energy sector. But outside
the US it hasn‟t still moved from the very beginning of its development. The future of the
resource remains unshaped. There is a great concern about the shortage of well-skilled labor in
the industry. Due to the survey provided by the Economist Intelligence Unit, this is named as one
of the major barriers to future growth by the industry top-managers (Economist Intelligence Unit
2012). The industry is highly contingent on demand and supply, the price differs in terms of
resource quality (e.g. Canadian light or heavy blend). Power of earning and money flow stay
more or less higher compared with other industries, caused mainly by price increases and, to a
less extent, by production increases, though prices in the upstream sector are highly volatile due
to significant cost involved in the pre-production and production processes and often rough
estimates of recoverable resources. The above mentioned Big Spenders survey showed that the
largest part of industry professionals name the upstream sector as a potential for future growth
(Ibid.). In the downstream sector the positive changes have taken place, but mainly in the US,
where the profitability of refining has improved. The rise of car drivers in developing countries
gives the sector a chance for future growth, but such challenges as energy and environmental
policies changes, new “bio” fuels, and other technological gains continue playing a substantial
role in sector‟s demand and price-making.
In spite of global financial crises and troubles in world economy, the oil and gas industry
confidence is increasing, and many industry key-players show a rising will to invest in upstream
operations. It is a positive feature of a today‟s oil and gas industry. The opportunities of a profit
growth are now seen by leading industry players in such regions as North America, Far East,
South-East Asia and Latin America.
The last two years (2010-2011) were full of significant events for global energy. The disorders of
“Arab Spring” shook oil and gas markets, influencing heavily the prices due to supply
disruptions. Oil prices in 2011 peaked up to the historical maximum. The earthquake and
tsunami in Japan, being a great disaster showed a burning need to review the approach to nuclear
energy, which couldn‟t but affect other fuels. 2010 oil spill in the Gulf of Mexico resulted in
10. toughening in regulatory issues such as drilling permits. The above-mentioned survey showed
that increasing regulation becomes a main challenge for the companies as regarded by more than
30% responders (Ibid.).
Table 1.1 The World’s Biggest Public Companies in Oil and Gas Operation Industry
(values calculated April 2012)
Rank Company Country Sales Profits Assets Market
(billion (billion (billion Value
USD) USD) USD) (billion
USD)
1 Exxon Mobile United 433.5 41.1 331.1 407.4
States
4 Royal Dutch Shell Netherlands 470.2 30.9 340.5 227.6
7 PetroChina China 301.1 20.6 304.7 294.7
10 Petrobras - Brazil 145.9 20.1 319.4 180
Petroleo Brasil
11 BP United 375.5 25.7 292.5 147.4
Kingdom
12 Shevron United 236.3 26.9 209.5 218
States
15 Gazprom Russia 117.6 31.7 302.6 159.8
18 Total France 216.2 15.9 213 132.4
24 Sinopec – China 391.4 11.6 179.8 104.2
China Petroleum
27 ConocoPhillips United 230.9 12.4 153.2 98.8
States
Source: Forbes, The World‟s Biggest Public Companies
11. CHAPTER II: EXXON MOBILE AND BP PLC COMPANY ANALYSIS
2.1. Preface
The current part of the report presents the company analysis including ratio analysis, horizontal
and vertical analysis (Scheme ####).
Horizontal analysis is the tool which clearly demonstrate the relations between the composition
of main financial statements and the effectiveness of the company‟s activity.
Vertical analysis is one of the best methods to show the trend in company‟s financial position,
which is usually a result of appropriate management policy of the company.
In this report, we merge horizontal and vertical analysis to demonstrate the key facts of the
company‟s financial position and to reveal the weak and strong features of the companies.
The main part of the horizontal and vertical analysis will be attributed to assets and liabilities
structure and its changes during the 5 years period. Assets and liabilities structure is one of the
important indicators which affect the
efficiency of companies, there is no
reasonable asset structure, companies Company
Analysis
will be unable to obtain the greatest
benefit. Assets structure refers to liquid Vertical and
Horizontal
assets and fixed assets, intangible assets Analysis Ratio Analysis CAPM
and long-term investments and other
non-proportional relationship between current assets. In this paper, we analyze the proportion of
current and non-current assets to total assets and current and non-current liabilities to total
liabilities. Also the relationship between assets and liabilities will be shown.
We analyze only two components (current and non-current) of assets and liabilities because
XOM and BP Plc are companies with large-scale operations and there is no sense to pay
attention to the other components of assets and liabilities.
However, we will show some others components just to highlight some aspects of the operations
nuances of the companies.
12. Ratio analysis is used to obtain a quick indication of financial performance of the companies in
several key areas. The ratios are categorized as Liquidity Ratios, Profitability Ratios, Short-term
Operating Activity Ratios, Long-term Debt-and-Solvency Ratios, Long-term Investment Activity
and Market Value Ratios. The approach of decomposition of Return of Assets Ratio (ROA) by
using the DuPont system was also applied to indicate the factors influencing to the sensitivity of
ROA.
In addition, Ratios had been used to compare the financial performance of two abovementioned
companies as well as to compare theirs financial performance with industry averages.
Besides of these, it was used Capital Asset Pricing Model (CAPM) to determine a theoretically
appropriate required rate of return of an asset, if that asset was to be added to an already well-
diversified portfolio, given that asset's non-diversifiable risk.
All graphs, charts and tables represent the calculations based on the Annual reports and Official
reports of BP and XOM, except noted otherwise.
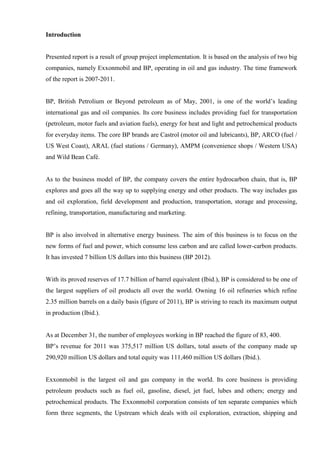
2.2. Horizontal and vertical analysis
Due to the involving BP Plc in Deepwater Horizon oil spill in 2010 and a huge amount of
expenses related to the accident, the financial position of BP Plc became worse and led to the
BP
500000
XOM
400000
300000
200000
100000
0
EBITDA
EBITDA
EBITDA
EBITDA
EBITDA
Sales and other operating revenues
Production and manufacturing expenses
Sales and other operating revenues
Production and manufacturing expenses
Sales and other operating revenues
Production and manufacturing expenses
Sales and other operating revenues
Production and manufacturing expenses
Sales and other operating revenues
Production and manufacturing expenses
EBIT
EBIT
EBIT
EBIT
EBIT
-100000
2007 2008 2009 2010 2011
13. deficit. The results of the accident found the reflection in the financial statements of the company
by the significant increase in production and manufacturing expenses. To balance the situation
BP announced a divestment program to sell about $38 billion worth of non-core assets by 2013
to compensate its liabilities related to the accident. In July 2010, it sold its natural gas activities,
stake and forecourts and supply businesses. In comparison with BP, XOM demonstrates strong
increase in sales, however, generally, the financial position of BP is more stable (See Chart ###).
The level of earnings of BP had not been significantly changed during 5 years period (excluding
2010 because of the force-majeure) while XOM‟s earnings have cyclic nature.
If to take into account the balance sheets of the companies and to use current assets amount
without any details, the assets structure 5 years average proportion of two companies has a slight
difference (6%).
XOM assets structure Current assets BP Plc assets structure Current assets
Non-current assets Non-current assets
26%
32%
68%
82%
However, as it was mentioned earlier, due to the Deepwater Horizon oil spill accident, BP Plc
began divestment policy, which affected to the current assets structure, particularly, beginning
from the 2010, current assets include assets classified as held for sale. It is obviously, that
without accident, the company will allocate this assets to the other components, however, we can
note that some of these assets will classified as long-term assets.
So, to indicate the differences in proportion and to follow the trend of their changes, we exclude
the assets for sale from the current assets (it is not applicable for the ratio‟s calculations).
In spite of the accident,
BP Plc demonstrates
40%
more stable and more
35%
cash efficient position 30%
25%
(See Chart####). This BP
20% XOM
stability is a result of 15%
10%
5%
0%
2007 2008 2009 2010 2011
14. effective managing of company‟s liquidity risk. BP is using the access to a wide range of funding
at competitive rates through capital markets and banks and to sufficient funding through its own
current cash holdings and future cash generation including disposal proceeds, the commercial
paper markets, and by using undrawn committed borrowing facilities, to meet foreseeable
liquidity requirements. To save the current assets in the appropriate level, XOM carefully
manages through counterparty quality and investment guidelines to ensure it is secure and
readily available to meet the Corporation‟s cash requirements and to optimize returns.
Generally BP Plc and as XOM have well-balanced structure of assets, which is provided by
effective management accounting.
It is important for XOM to pay more attention to the stability of the current assets, which is
required for adequate forecasting and planning.
2.3. Financial ratio analysis
Financial Ratios are ratios computed by the mangers to evaluate the performance, progress and
achievements of the company with other companies in the same industry. Financial ratios also
help the investors, creditors, lenders, analyst and managers in critically analysing an investment
opportunity and credit decisions. The ratios compare the risk and return of a firm with that of
other firms, thus ratio analysis support inter firm comparison. (Gerald I. White et al 2003).
2.3.1. Liquidity
Liquidity ratios are the ratios that measure the ability of a company to meet its short term debt
obligations. These ratios show the number of times the short term debt obligations are covered
by the cash and liquid assets.
Taking into account that the oil and gas industry has proven time and again that it is among the
most dangerous industries for people and environment, it would be correct to consider only the
cash and cash equivalents as relevant assets because they are most likely to be used to meet short
term liabilities in an emergency.
Table ### Liquidity ratios
15. Current ratio Quick ratio Super quick ratio
Years
BP XOM Industry BP XOM Industry BP XOM Industry
2011 1.16 0.94 1.19 0.69 0.67 0.77 0.17 0.17 0.27
2010 1.12 0.94 1.20 0.68 0.65 0.77 0.24 0.13 0.29
2009 1.14 1.06 1.17 0.64 0.74 0.72 0.14 0.21 0.24
2008 0.95 1.47 1.14 0.54 1.14 0.70 0.12 0.64 0.25
2007 1.04 1.47 1.21 0.54 1.21 0.78 0.05 0.58 0.23
Average 1.08 1.18 1.18 0.62 0.88 0.75 0.14 0.35 0.26
Ideal 2 1 0.75
According to the Table ###, Current ratio of BP has been very steady, it stayed at a rate of 1.1
for the past three years and will probably keep the record for this year. This ratio is higher than
0.94 of XOM.
However, current ratio is affected by the inventory method used, that‟s why it is not possible to
make adequate comparative analysis of the current ratios for XOM and BP, because XOM uses
LIFO (last in, first out) while BP accounts its inventories with FIFO (first in, first out)
methodology.
To take a deeper look at the short-term liquidity of the company and exclude the inventory
method‟s influence, we shall examine its acid-test ratio (quick ratio). As it is shown in the table,
all average ratios are less than 1.0 meaning that the companies haven‟t enough cash or cash
equivalent to pay off its current liabilities. However XOM showed excellent results at 2008 and
2007 with a quick ratio of more than 1.0 while BP is struggling at 0.5 and Industry average was
lower than 1.0.
Taking into account that the oil and gas industry has proven time and again that it is among the
most dangerous industries for people and environment, it was considered to calculate super-
quick ratio using only the cash and cash equivalents as relevant assets because they are most
likely to be used to meet short term liabilities in an emergency.
Super-quick ratio analysis demonstrates the significant deterioration of the ratios in 2010 and
2011 (more than 1.6 times) for XOM while there were not so noticeable decreases in the other
liquidity ratios. It had been resulted by the increase of the amount of trade notes and accounts
receivable.
16. In spite of the low liquidity ratios (less than ideal), which are usually indicate weakness, because
the company might not be able to borrow additional funds or sell assets to raise enough cash to
meet its current liabilities, XOM and BP, being one of the strongest companies in the oil and gas
industry, has always had the capacity to borrow on a short-term basis to pay off its current
obligations.
2.3.2. Profitability analysis
Company‟s profitability is one of the important segments of the financial analysis. Profitability
information is extremely significant for investors because these earnings are either retained or
paid out in dividends to shareholders, both of which affect the company‟s stock price. Many
different measures of profitability indicate how much the company is earning relative to the base
that is used, such as sales, assets, and shareholders‟ equity. The different profitability ratios are
relative measures of the success of the company.
Due to the visual aids, we demonstrated the results of each ratio calculations graphically.
Operating Profit Margin Ratio Net profit Margin Ratio
20.00%
12.00%
10.00%
15.00%
8.00%
10.00% BP BP
6.00%
XOM XOM
5.00% Oil and gaz industry 4.00%
Oil and gaz industry
2.00%
0.00%
2007 2008 2009 2010 2011
0.00%
2007 2008 2009 2010 2011
-5.00% -2.00%
ROE ROA
45% 25.00%
40%
35% 20.00%
30%
15.00%
25%
BP BP
20%
XOM 10.00% XOM
15%
Oil and gaz industry Oil and gaz industry
10%
5.00%
5%
0% 0.00%
-5% 2007 2008 2009 2010 2011 2007 2008 2009 2010 2011
-10% -5.00%
Limitations
17. the best method of evaluation performance of companies due to the inherent limitations of ratio
analysis.
Drawbacks in using ratio analysis
When one uses the accounting and financial ratios as a method of assessing company‟s
performance face the following problems:
In case of a loss generating company, the ratios seem meaningless.
The financial ratio are not uniform i.e. there is no standard of ratios, there is no single definition
of a correct ratio.
The ratio can be manipulated easily according to the requirements of the presenter.
Ratio are just figure, without any supported explanation, calculation and definition.
Ratio take into account only financial perspective, other factors affecting the performance of the
company are not taken into consideration.
The ratios losses their importance over a period of years due to factors such as inflation.
Let‟s discuss each of the above problems separately
1 Loss making Companies
Even if a small limited company is incurring losses, it does not mean necessarily that the
company is worthless, the owners of small business run the company for many other reasons
other than just profit earning, for example “life style choice” (Jennings and Beaver 1997; Jarvis
et al. 2000; Green bank 2001). Such small companies do not intend to grow into larger
companies as they are working just to maintain their particular life style.
In the case of a public listed company, a loss may leave an adverse impact on its long term
growth and investor, every company in order to survive in the long run need to be profitable
(Reid and Smith 2000). Financial ratio analysis is ineffective in the above case especially if one
is trying to evaluate profitability because the ratio will be in negative due to loss.
18. 2 No standard definition:
Financial ratios are calculated differently by using different formulas and definitions (Gibson
and Cassar 2005). For example if one wants to evaluate the profitability of any company he can
use any of the following ratios:
Gross Profit margin
Net profit margin
Return on equity
Return on assets
Net Profit before tax and interest
Net Profit after tax and interest
The entire above ratios will give a different result; similar problem is experience while defining
shareholders equity, debt, and long term loans etc. similarly some books lays down as the
standard current ratio to be 1 but such conclusion are sometimes dangerous and misleading,
some companies are able to perform well with a current ratio of less than 1, for example
supermarkets.
Thus it can be concluded that ratio does not give comparable results and are not reliable, for
example if while performing longitudinal ratio, the analyst changes from one definition to
another and does not disclose the change in definition, then the new ratios cannot be compared
with the earlier ones.
3 Manipulation
As seen above, when there is no standard definition of ratio, everybody can use different
definitions according to their convenience; consequently the manipulation of ratios is easy. The
19. management can choose any ratio, include or exclude any item and present such results which
look better and remove any kind of distortion.
4 No supporting calculations and explanations
The annual reports of many companies does not show the calculations and definitions used in
calculating ratios, this suppress the value of information they provide, as no supporting
calculations are provided with the help of which clarity and genuineness can be established. In
the case of small businesses also, where data are collected through self report mail surveys
(Brush and Vanderwerf 1992; Chandler and Hanks 1993; Murphy et al. 1996) such figures are
not consistent across business and hence incomparable.
5 Other unconsidered factors
Another disadvantage in using Ratio analysis as a performance assessment tool is that it does not
take into account the things which cannot be measured in terms of ratio but otherwise have an
impact on the value of the company by increasing sales indirectly, for example, the goodwill of
the company in the market, change in management etc.
6 Time value of money
Ratio analysis fails to take into account factors such as rise in prices and inflation which affect
the value of a dollar. For example, 10 years before a profit of $10 million might be a big
achievement but today the value of 1$ is not the same as it was ten years ago. This limitation
makes it difficult to compare historical figure with today‟s figure, thus giving a distorted picture
of the financial statements.
Conclusion
Inspite of these inherent flaws in ratio analysis it is still widely used by the marketing and
operations management to evaluate the performance of the companies. As ratio analysis is not
standardized, no supporting calculations and explanations are provided and no consideration is
paid to the time value of money, there is a need for such a performance evaluation too, which
takes into account not only the financial but also the non financial factors before judging the
performance irrespective of the year under consideration.
20. Inspite of these big problems, organizations use ROCE and ROI and other ratios to judge the
improvement in the performance of the organization (Meyer, 2005). Thus it is suggested that
such work should be viewed carefully and cautiously when analysing the success and
performance of a small medium enterprise.
21. CHAPTER III : STRATEGY ANALYSIS IN BOTH COMPANIES
3.1 Sustainability Balance Scorecard in Energy Sector
In present days, it‟s more believed that social-environmental aspects of companies indicate the
factors concerning its survival & ability to compete. Sustainability Balance Scorecard (SBSC)
[Epstein, Wisner, 2001] is considered to be one of the efficient models of management
accounting which helps to integrate development & social responsibility of the company‟s
managerial decisions which is based on Kaplan & Norton‟s Balance Scorecard. SBSC is used as
a management technique to hold a good control of relevant decisions life-cycle from strategic
plan to operation feedback [figure adapted from Bieker, 2003].[1]
Companies doing business in energy sector were not much concerned with life quality
improvement, as far as their main competitive factor is related to productivity in terms of
quantifiable benefits. Whereas practicing comprehending the importance of the social-
environmental aspect of its activity which serves as competitive factor in the modern market.
Possible sustainability Balanced Scorecard scheme (from Bieker, 2003)
22. ExxonMobil and BP have many things in common. Both of them are among the world‟s largest
oil companies, both rakes in billions of dollars in profit operating refineries, offshore platforms.
ExxonMobil started investment in alternative energy much later than BP, but has lowest
percentage of the violations for refineries. Below we can compare organizational strategies,
implementation plans in terms of Balanced Scorecard analysis for both companies. [2]
3.2 Balanced Scorecard strategy in Exxon
By industry standards, ExxonMobil is recognized as a behemoth among all oil companies with
market share valued in $386.96 billion states ValueWalk Magazine by 2012 [3]. The strategic
vision of the company was defined as the following:
“To be the best integrated refiner-marketer in the United States by efficiently delivering
unprecedented value to customers” [4]
In 1992 new head of Mobil Bob McCool facilitated to change performance style by adopting
Balanced Scorecard. And ExxonMobil made the crucial decision to implement “differentiated
value proportion” to focus on financial goal about increasing its return on capital employed for
over 6% within 3 years.
And new strategy was developed – “to reconstruct the organization from a centrally
controlled manufacturer of commodity products to a decentralized, customer-driven
organization”.
All four perspectives to facilitate new target achievement were modeled together with measuring
metrics for every operation. [See Figure 1]
23. • Revenue Growth • Unique mix of
• Productivity products & service
attributes
• Customer relations
• Corporate image
Financial Customer
Perspective Perspective
Internal Learning &
Process Staff
Perspective Development
• Building franchise via • Staff training in
new products and marketing & refining
services development business
• Nurture leadership
skills of managers
Figure 1. BSC in EXXON MOBIL
The Financial Perspective comprised two main levers: Revenue Growth & Productivity.
The revenue growth strategy was to expand sales outside of gasoline by suggesting products
such as: oil, antifreeze, wiper fluid, tires & wiper blades together with supplementary automotive
services as: car washes, oil changes and minor repairs. Moreover, ExxonMobil decided to sell
more premium brands to customers to increase profitability.
Measurement tools for implementation were adopted accordingly. They were:
Revenue of non-gasoline products
Profit Margin
Compared Sales Volume
Ratio of Premium products sold to Regular ones
As for Productivity lever, ExxonMobil intended to slash operating expenses per gallon sold to
the lowest level in the industry sector, as well as extracting more from existing assets by the way
of reducing the downtime of oil refineries and increasing their yields.
Corresponding measurement tools were implemented.
Mobil‟s per gallon cost comparison with the rests in the market
Actual cash flow compared to the rest of the business plan
Customer Perspective
24. One of the main business strategies of the ExxonMobil was customer value proposition by
offering unique mix of products of service attributes, excelling customer relations & corporate
image, which helped to attract and improve relationships with targeted customers by giving
premium quality customer service. [See Figure 2]
Metrics to measure were set as:
Share of targeted customer segments
Mystery shopper rating
Dealer profitability
Dealer satisfaction
Complete customer
strategy
Motivating
Revenue growth for
independent dealers
Company's
to deliver a great
Financial strategy
buying experience
Customers buy Attract more
products & services Customers
at premium prices
Figure 2 Customer Strategy Cycle.
Internal Process Perspective objectives comprised building franchise via new products &
services development which was achieved by learning customer segments better to build best-in-
class franchise teams, by improving hardware performance and inventory management, by on-
time delivery & being industry cost leader, as well as implementing Corporate-Citizen policy in
order to eliminate environmental accidents.
Metrics for measuring effectiveness in the operation were:
New product acceptance rate
Return on investment rate of new product
Target market share
Dealer quality rating
25. Refinery yield gap
Unplanned downtime
Inventory levels
Stock out rate
ABC versus the competition
Reduction of environmental incidents & safety accidents in numbers
For Learning & Development perspective ExxonMobil defined to excel personnel
understanding of the marketing and refining business. Besides, company focused to nurture
leadership skills to company managers to articulate the vision of the company, as well as
personnel development. The productivity of activities was measured by:
Ration of strategic skills to job coverage
On-time deployment of systems
Personnel BSC
Employee feedback
Above given strategy map for four major perspectives were deployed in all business units &
service departments with the purpose of developing & launching their own detailed maps
respectively. Implementation of the Balanced Scorecard at lower levels of the organization
helped ExxonMobil to detect and fill major gaps and pitfalls in the strategies.
3.3 Balanced Scorecard strategy in BP
Business strategy of BP is “to grow value of shareholders by helping to meet the world’s
growing energy needs safely and responsibly” and it utilizes about 10 points of measurement
to evaluate performance of the company. The plan starts with focusing on importance of safety
and centres on focusing BP‟s strengths: gas value chains, exploration, giant fields, deepwater,
world class downstream, technology & relationships. CEO of the company Bob Dudley defined
plan details at the beginning of 2012. [5]
Expectation plan is as follows:
Inexorable focus on safety & risks management
Course on strengths
BP performance much Stronger and more Focused
Simpler and more Standardized performance
Transparency of values
26. Measurement metrics on target achievement:
Portfolio Management
Double the 2011 average of unit operating cash margins for new upstream projects
Generate around 50% of annual operating cash flow in comparison to 2011 by 2014 at
$110 per barrel
Half of incremental operating cash to use for re-investment and half for distribution, other
business purposes
Focusing on balance sheet and frequency of gearing
• Strong balance sheet with
gearing in the lower half of the
10-20% range over time
• Generate around 50% more • Continue active
annually in operating cash flow portfolio
by 2014 versus 2011 at $100 management
per barrel
• Visibility and
• New upstream projects transparency to
onstream with unit value
operating cash margins Financial Customer • Standartized service
double the 2011 average
Perspective Perspective
• Cash flow distriburion:
• half for re-investment
and half for other
business purposes
Internal Learning &
Process Staff
Perspective Development • Serious approach to
knowledge management
• Playing to our strengths • To become a great
• Relentless focus on employer
safety & managing risks • To maintain the trust of
people inside and
outside of the company
BP mainly focuses a simpler business organization which support economic development and
help to improve quality of life for millions of people. Moreover, BP „s activities also generates
jobs, investment, infrastructure and revenues for governments and local communities depending
on the needs of society where it operates. BP cares deeply about how it delivers energy to the
world.
27. V. CONCLUSION
(Recommend-ns from Kseniya)
As a summary to investment options, it is important to emphasize that the assumptions to Oil &
Gas industry development are continuous and changing as far as this sector is one of the core
industry sectors that touches political, economical, environmental & social aspects in the country
or region.
References:
[1] 19th World Energy Congress, Sydney, Australia (2004) Social responsibility in Energy
Companies. Available at
http://www.worldenergy.org/documents/congresspapers/metallog0904.pdf [Accessed 5 Dec.
2012]
[2] NPR/News/Business (2012) by Wendy Kaufman: Exxon after Valdez: Lessons for BP?
Available at http://www.npr.org/templates/story/story.php?storyId=128691405&ft=1&f=1006
[Accessed 3 Dec. 2012]
[3] ValueWalk Magazine (2012) by ValueWalk Staff: ExxonMobil Offers More Value Than BP,
RDSA or CVX Available at: http://www.valuewalk.com/2012/07/exxon-mobil-offers-more-
value-than-bp-rdsa-or-cvx/ [Accessed 30 Nov. 2012]
[4]Balanced Scorecard and Strategy Map at Mobil North America Marketing and Refining (NA
M&R) Available at: http://www.executivemanagementskills.com/pdf/mobil.pdf
[Accessed 5 Dec. 2012]
[5] BP (2012) 2012 Annual General Meeting: CEO’s Speech, Bob Dudley
Available at: http://www.bp.com/genericarticle.do?categoryId=98&contentId=7074117
[Accessed 7 Dec. 2012]
28. References
Baker H.K. and Powell G. (2009). Understanding Financial Management: A Practical Guide.
Bull R. (2007). Financial Ratios: How to use financial ratios to maximise value and success.
Cooper R. (1996). Look Out, Management Accountants. Management Accounting. May 1996,
pp. 20–26.
Gervais M., Levant, Y. and Ducrocq C. (2010). Time-Driven Activity-Based Costing (TDABC):
An Initial Appraisal through a Longitudinal Case Study. JAMAR. Vol.8, No.2, pp. 1-20.
Gibson C.H. (2010). Financial Reporting and Analysis: Using Financial Accounting
Information.
KPMG. (2007). Rethinking Cost Structures: Creating a Sustainable Cost Advantage.
KPMG, p.60.
On Target. Empowerment Accounting not just the numbers An Influencing Role for
management Accountants, Jun/July 2009, pp. 1-3.
Peterson P.P. and Fabozzi F.J. (1999). Analysis of Financial Statements.
Ram Yadav A. (1986). Financial Ratios and the Prediction of Corporate Failure.
Soliman M.T. (2008). The Use of DuPont Analysis by Market Participants. The Accounting
Review. Vol. 83, No. 3, pp. 823-853.
White G.I., Sondhi A.C. and Fried D. (2003). The Analysis and Use of Financial Statements.
(3rd edn). Wiley. p.111.
29. Wiehle U., Diegelmann M., Deter H., Schömig P.N. and Rolf M. (2006). 100 IFRS Financial
Ratios.
Agarwala S., Pruitt D., Sanders K. and Wang L. (). Comparative Operational and Financial
Analysis. Available at
http://www.bauer.uh.edu/centers/uhgemi/documents/Group%202%20Financial%20Analysis%20
Presentation.pdf [Accessed ]
BP. (2012). BP Statistical Review of World Energy June 2012. Available at
http://129.10.70.18/videoplayer/statistical_review_of_world_energy_full_report_2012.pdf?ich_u
_r_i=df839a8673d71ac6fe3ffd00b83c2e00&ich_s_t_a_r_t=0&ich_e_n_d=0&ich_k_e_y=124511
8930750563512472&ich_t_y_p_e=1&ich_d_i_s_k_i_d=10&ich_u_n_i_t=1 [Accessed 30 Nov.
2012]
DBRS. (2011). Rating oil and gas companies. Available at
http://www.dbrs.com/research/228875 [Accessed 29 Nov. 2012]
Economist Intelligence Unit. (2012). Big spenders. The outlook for the oil and gas industry
2012. Available at http://www.slideshare.net/Management-Thinking/big-spenders-the-outlook-
for-the-oil-and-gas-industry-in-2012 [Accessed 29 Nov. 2012]
Frecknall- Hughes J., Simpson M. and Padmore J. (2007). Inherent Limitations in Using
Financial Ratio Analysis to Assess Small and Medium Sized Company Performance. Available at
http://www.shef.ac.uk/content/1/c6/06/89/64/2007-01.pdf [Accessed ]
Kont K-R. Jantson S. (2011). Activity-Based Costing (ABC) and Time-Driven Activity-Based
Costing (TDABC): Applicable Methods for University Libraries?. Available at
https://ejournals.library.ualberta.ca/index.php/EBLIP/article/view/10156/9380 [Accessed ]
Lin Y.B. (2005). Research Assignment Financial Analysis: Apple Computer Inc. Available at
http://people.bu.edu/beelin/TermPaper-AppleCom.pdf [Accessed ]
OPEC. (2012). World Oil Outlook 2012. Available at
http://129.10.70.18/videoplayer/WOO2012.pdf?ich_u_r_i=22b9570da4a0a7d5a3e7235840a507b
2&ich_s_t_a_r_t=0&ich_e_n_d=0&ich_k_e_y=1245118930750763192424&ich_t_y_p_e=1&ic
h_d_i_s_k_i_d=3&ich_u_n_i_t=1 [Accessed 29 Nov. 2012]
30. U.S. Energy Information Administration. (2012). Annual Energy Outlook 2012. Available at
http://www.eia.gov/forecasts/aeo/ [Accessed 29 Nov. 2012]
Babson College Faculty. (2012). How to Calculate a Beta. Available at
http://faculty.babson.edu/academic/Beta/CalculateBeta.htm [Accessed ]
BP. (2012). Available at http://www.bp.com [Accessed 1 Dec. 2012]
Central Intelligence Agency . (2012). CIA World Factbook. Available at
https://www.cia.gov/library/publications/the-world-factbook/ [Accessed 8 Dec. 2012]
ExxonMobile. (2012). Available at http://www.exxonmobil.com/Corporate/ [Accessed 1 Dec.
2012]
Forbes. (2012). The World Biggest Public Companies. Available at
http://www.forbes.com/global2000/list/#p_1_s_a0_Oil%20&%20Gas%20Operations_All%20co
untries_All%20states_ [Accessed 9 Dec. 2012]
Gauging Corporate Financial Results. (2012). Cash Management Gauge. Available at
http://www.financial-gauges.com/p/cash-management-gauge.html [Accessed ]
New York Stock Exchange. (2012). Available at https://nyse.nyx.com/ [Accessed ]
Petroleum Online. (2012). Overview. Available at
http://www.petroleumonline.com/content/overview.asp?mod=1 [Accessed 3 Dec. 2012]
Stock Analysis on Net. (2012). Available at http://www.stock-analysis-on.net/ [Accessed ]
U. S. Energy Information Administration. (2012). Country Overview. Available at
http://www.eia.gov/countries/index.cfm?topL=con [Accessed 8 Dec. 2012]
32. APPENDIXES
Long term operating analysis of BP
Ratios and 2011 2010 2009 2008 2007
Net Fixed AssetTurnover
BP 2.05 1.83 1.51 2.38 2.03
Oil and gas industry 1.80 1.58 1.42 2.40 2.08
Total Asset Turnover
BP 1.28 1.09 1.01 1.58 1.20
Oil and gas industry 1.00 0.87 0.82 1.31 1.09
Equity Turnover
BP 3.37 3.13 2.35 3.96 3.04
Oil and gas industry 2.08 1.80 1.72 2.77 2.27
Long term operating analysis
Ratios and 2011 2010 2009 2008 2007
Net Fixed AssetTurnover
XOM 2.18 1.85 2.17 3.79 3.23
Oil and gas industry 1.80 1.58 1.42 2.40 2.08
Total Asset Turnover
XOM 1.41 1.22 1.29 2.02 1.61
Oil and gas industry 1.00 0.87 0.82 1.31 1.09
Equity Turnover
XOM 3.02 2.52 2.73 4.07 3.21
Oil and gas industry 2.08 1.80 1.72 2.77 2.27
33. Profitability Analysis of BP
Ratios and 2011 2010 2009 2008 2007
Operating Profit Margin
BP 10.6% -1.2% 11.0% 9.8% 11.4%
Oil and gas industry 15.0% 13.1% 12.3% 14.5% 18.0%
Net Profit Margin
BP 6.8% -1.3% 6.9% 5.9% 7.3%
Oil and gas industry 8.6% 7.6% 6.8% 7.4% 10.5%
Return on Equity
BP 23.06% -3.92% 16.31% 23.17% 22.25%
Oil and gas industry 17.9% 13.7% 11.7% 20.3% 23.9%
Return on Assets
BP 8.8% -1.4% 7.0% 9.3% 8.8%
Oil and gas industry 8.6% 6.7% 5.6% 9.7% 11.4%
Profitability Analysis
Ratios and 2011 2010 2009 2008 2007
Operating Profit Margin
XOM 0.16 0.14 0.12 0.18 0.18
Oil and gas industry 0.15 0.13 0.12 0.14 0.18
Net Profit Margin
XOM 0.09 0.08 0.06 0.10 0.10
Oil and gas industry 0.09 0.08 0.07 0.07 0.11
34. Return on Equity
XOM 0.27 0.21 0.17 0.40 0.33
Oil and gas industry 0.18 0.14 0.12 0.20 0.24
Return on Assets
XOM 0.12 0.10 0.08 0.20 0.17
Oil and gas industry 0.09 0.07 0.06 0.10 0.11
Long term debt and solvency ratios
Ratios and 2011 2010 2009 2008 2007
Debt-to -Equity
BP 39.7% 47.7% 34.1% 36.4% 33.1%
Oil and gas industry 31.0% 31.0% 33.0% 28.0% 24.0%
Debt-to-Capital
BP 28.4% 32.3% 25.4% 26.7% 24.9%
Oil and gas industry 24.0% 24.0% 25.0% 22.0% 20.0%
Interest Coverage
BP 3216.69% -312.39% 2363.42% 2316.10% 2369.27%
Oil and gas industry 4431.0% 3401.0% 2679.0% 4446.0% 3735.0%
Long term debt and solvency ratios
Ratios and 2011 2010 2009 2008 2007
Debt-to -Equity
XOM 0.11 0.10 0.09 0.08 0.08
Oil and gas industry 0.31 0.31 0.33 0.28 0.24
35. Debt-to-Capital
XOM 0.10 0.09 0.08 0.08 0.07
Oil and gas industry 0.24 0.24 0.25 0.22 0.20
Interest Coverage
XOM 297.59 205.47 64.46 124.92 179.70
Oil and gas industry 44.31 34.01 26.79 44.46 37.35
Liquidity Analysis
Ratios and 2011 2010 2009 2008 2007
Current ratio
BP 115.7% 112.3% 114.0% 95.1% 103.8%
Oil and gas industry 119.0% 120.0% 117.0% 114.0% 121.0%
Quick ratio
BP 68.9% 67.8% 64.3% 53.9% 54.1%
Oil and gas industry 77.0% 77.0% 72.0% 70.0% 78.0%
Super quick ratio
BP 17.02% 23.95% 14.06% 11.74% 4.61%
Oil and gas industry 27.0% 29.0% 24.0% 25.0% 23.0%
Liquidity Analysis
36. Ratios and 2011 2010 2009 2008 2007
Current ratio
XOM 0.94 0.94 1.06 1.47 1.47
Oil and gas industry 1.19 1.20 1.17 1.14 1.21
Quick ratio
XOM 0.67 0.65 0.74 1.14 1.21
Oil and gas industry 0.77 0.77 0.72 0.70 0.78
Super quick ratio
XOM 0.17 0.13 0.21 0.64 0.58
Oil and gas industry 0.27 0.29 0.24 0.25 0.23
Short term operating analysis
Ratios and 2011 2010 2009 2008 2007
Inventory Turnover Ratio
BP 1463.4% 1133.2% 1058.5% 2147.0% 0.0%
Oil and gas industry 1658.0% 1487.0% 1319.0% 2354.0% 1596.0%
Receivables Turnover Ratio
BP 1344.5% 1224.9% 1058.5% 1579.2% 861.4%
Oil and gas industry 1130.0% 1036.0% 978.0% 1487.0% 930.0%
Payables Turnover Ratio
BP 1258.9% 1080.0% 1045.5% 1794.1% 925.2%
37. Oil and gas industry 1161.0% 1069.0% 1039.0% 1645.0% 1054.0%
Working Capital Turnover Ratio
BP 1580.5% 1293.9% 1071.9% 1846.2% 986.3%
Oil and gas industry 1595.0% 1424.0% 1222.0% 2043.0% 1328.0%
Average inventory processing period
BP 2494.2% 3220.9% 3448.3% 1704.7%
Oil and gas industry 2200.0% 2500.0% 2800.0% 1600.0%
Average receivable collection period
BP 2714.7% 2979.8% 3448.2% 2317.7% 4237.3%
Oil and gas industry 3200.0% 3500.0% 3700.0% 2500.0% 3900.0%
Operating Cycle
BP 5208.9% 6200.7% 6896.5% 4022.4% 0.0%
Oil and gas industry 5400.0% 6000.0% 6500.0% 4000.0% 0.0%
Short term operating analysis
Ratios and 2011 2010 2009 2008 2007
Inventory Turnover Ratio
XOM 31.09 28.52 26.10 39.46 0.00
Oil and gas industry 16.58 14.87 13.19 23.54 15.96
Receivables Turnover Ratio
XOM 15.54 14.55 13.59 24.57 12.68
Oil and gas industry 11.30 10.36 9.78 14.87 9.30
Payables Turnover Ratio
XOM 13.75 12.02 12.44 21.69 13.35
Oil and gas industry 11.61 10.69 10.39 16.45 10.54
38. Working Capital Turnover Ratio
XOM 42.08 48.48 31.73 50.16 30.92
Oil and gas industry 15.95 14.24 12.22 20.43 13.28
Average inventory processing period
XOM 11.74 12.80 13.99 9.27
Oil and gas industry 22.00 25.00 28.00 16.00
Average receivable collection period
XOM 23.48 25.09 26.86 14.90 28.78
Oil and gas industry 32.00 35.00 37.00 25.00 39.00
Operating Cycle
XOM 35.22 37.88 40.84 24.17 0.00
Oil and gas industry 54.00 60.00 65.00 40.00 0.00
Five-component disaggregation of ROE
Tax Interest EBIT Asset
Year ROE = × × × × Leverage
Burden Burden Margin Turnover
2011 23.06% 0.66 0.98 10.60% 1.28 2.63
2010 0.00% 0.77 -1.25% 1.09 2.87
2009 16.31% 0.66 0.95 11.04% 1.01 2.32
2008 23.17% 0.62 0.97 9.76% 1.58 2.50
2007 22.25% 0.66 0.98 11.38% 1.20 2.52
Five-component disaggregation of ROE
Tax Interest EBIT Asset
Year ROE = × × × × Leverage
Burden Burden Margin Turnover
2011 26.59% 0.56 1.00 15.74% 1.41 2.14
2010 0.00% 0.58 0.00 14.38% 1.22 2.06
2009 17.44% 0.55 0.98 11.72% 1.29 2.11
2008 40.03% 0.54 0.99 18.29% 2.02 2.02
39. 2007 33.35% 0.57 0.99 18.42% 1.61 1.99
BP PLC, Common-Size Consolidated Statement of Financial Position, Assets
Dec 31, Dec 31, Dec 31, Dec 31, Dec 31,
Property, plant and 2011 2010 2009 2008 2007
equipment 40.68% 40.46% 45.89% 45.22% 41.51%
Goodwill 4.13% 3.16% 3.65% 4.33% 4.66%
Intangible assets 7.20% 5.25% 4.89% 4.50% 2.82%
Group share of net assets
of jointly controlled 9.16% 8.65% 10.86% 10.92% 8.14%
entities and associates
Loans made by group
companies to jointly
0.67% 0.76% 1.12% 1.27% 1.47%
controlled entities and
associates
Investments in jointly
controlled entities and 9.83% 9.41% 11.98% 12.19% 9.61%
associates
Other investments 0.72% 0.44% 0.66% 0.37% 0.78%
Loans 0.30% 0.33% 0.44% 0.44% 0.42%
Other receivables 1.48% 2.31% 0.73% 0.31% 0.41%
Derivative financial
1.72% 1.55% 1.68% 2.21% 1.58%
instruments
Prepayments 0.43% 0.53% 0.60% 0.59% 0.46%
Deferred tax assets 0.21% 0.19% 0.22% – –
Defined benefit pension
0.01% 0.80% 0.59% 0.76% 3.78%
plan surpluses
Non-current assets 66.70% 64.43% 71.33% 70.91% 66.03%
Loans 0.08% 0.09% 0.11% 0.07% 0.07%
Inventories 8.76% 9.63% 9.58% 7.37% 11.25%
Trade receivables 9.53% 8.91% 9.58% 10.02% 13.98%
Other receivables 5.32% 4.52% 2.94% 2.80% 2.12%
Trade and other 14.85% 13.42% 12.51% 12.82% 16.10%
40. receivables
Derivative financial
1.32% 1.60% 2.10% 3.73% 2.68%
instruments
Prepayments 0.44% 0.58% 0.74% 1.34% 1.52%
Current tax receivable 0.08% 0.25% 0.09% 0.17% 0.30%
Other investments 0.10% 0.56% – – –
Cash and cash equivalents 4.80% 6.82% 3.53% 3.59% 1.51%
Assets classified as held
2.87% 2.62% – – 0.54%
for sale
Current assets 33.30% 35.57% 28.67% 29.09% 33.97%
Total assets 100.00% 100.00% 100.00% 100.00% 100.00%
BP PLC, Common-Size Consolidated Statement of Financial Position, Assets
%
Dec 31, Dec 31, Dec 31, Dec 31, Dec 31,
2011 2010 2009 2008 2007
Property, plant and equipment 40.68% 40.46% 45.89% 45.22% 41.51%
Goodwill 4.13% 3.16% 3.65% 4.33% 4.66%
Intangible assets 7.20% 5.25% 4.89% 4.50% 2.82%
Group share of net assets of
jointly controlled entities and 9.16% 8.65% 10.86% 10.92% 8.14%
associates
Loans made by group companies
to jointly controlled entities and 0.67% 0.76% 1.12% 1.27% 1.47%
associates
Investments in jointly
controlled entities and Jan 0, 1900 Jan 0, 1900 Jan 0, 1900 Jan 0, 1900 Jan 0, 1900
associates
Other investments 0.72% 0.44% 0.66% 0.37% 0.78%
Loans 0.30% 0.33% 0.44% 0.44% 0.42%
Other receivables 1.48% 2.31% 0.73% 0.31% 0.41%
Derivative financial instruments 1.72% 1.55% 1.68% 2.21% 1.58%
Prepayments 0.43% 0.53% 0.60% 0.59% 0.46%
41. Deferred tax assets 0.21% 0.19% 0.22% – –
Defined benefit pension plan
0.01% 0.80% 0.59% 0.76% 3.78%
surpluses
Non-current assets Jan 0, 1900 Jan 0, 1900 Jan 0, 1900 Jan 0, 1900 Jan 0, 1900
Loans 0.08% 0.09% 0.11% 0.07% 0.07%
Inventories 8.76% 9.63% 9.58% 7.37% 11.25%
Trade receivables 9.53% 8.91% 9.58% 10.02% 13.98%
Other receivables 5.32% 4.52% 2.94% 2.80% 2.12%
Trade and other receivables Jan 0, 1900 Jan 0, 1900 Jan 0, 1900 Jan 0, 1900 Jan 0, 1900
Derivative financial instruments 1.32% 1.60% 2.10% 3.73% 2.68%
Prepayments 0.44% 0.58% 0.74% 1.34% 1.52%
Current tax receivable 0.08% 0.25% 0.09% 0.17% 0.30%
Other investments 0.10% 0.56% – – –
Cash and cash equivalents 4.80% 6.82% 3.53% 3.59% 1.51%
Assets classified as held for sale 2.87% 2.62% – – 0.54%
Current assets Jan 0, 1900 Jan 0, 1900 Jan 0, 1900 Jan 0, 1900 Jan 0, 1900
Total assets Jan 1, 1900 Jan 1, 1900 Jan 1, 1900 Jan 1, 1900 Jan 1, 1900
Group balance sheet
$ million
2011 2010* 2009 2008 2007
Non-current assets
Property, plant and
119,214 110,163 108,275 103,200 97,989
equipment
Goodwill 12,100 8,598 8,620 9,878 11,006
Intangible assets 21,102 14,298 11,548 10,260 6,652
Investments in jointly
15,518 14,927 15,296 23,826 18,113
controlled entities
Investments in
13,291 13,335 12,963 4,000 4,579
associates
42. Other investments 2,117 1,191 1,567 855 1,830
Fixed assets 183,342 162,512 158,269 152,019 140,169
Loans 884 894 1,039 995 999
Trade and other
4,337 6,298 1,729 710 968
receivables
Derivative financial
5,038 4,210 3,965 5,054 3,741
instruments
Prepayments 1,255 1,432 1,407 1,338 1,083
Deferred tax assets 611 528 516 –
Defined benefit
17 2,176 1,390 1,738 8,914
pension plan surpluses
195,484 178,050 168,315 161,854 155,874
Current assets
Loans 244 247 249 168 165
Inventories 25,661 26,218 22,605 16,821 26,554
Trade and other
43,526 36,549 29,531 29,261 38,020
receivables
Derivative financial
3,857 4,356 4,967 8,510 6,321
instruments
Prepayments 1,286 1,574 1,753 3,050 3,589
Current tax receivable 235 693 209 377 705
Other investments 288 1,532
Cash and cash
14,067 18,556 8,339 8,197 3,562
equivalents
89,164 89,725 67,653 66,384 78,916
Assets classified as held
8,420 4,487 1,286
for sale
97,584 94,212 67,653 66,384 80,202
Total assets 293,068 272,262 235,968 228,238 236,076
Current liabilities
Trade and other
52,405 46,329 35,204 33,644 43,152
payables
Derivative financial
3,220 3,856 4,681 8,977 6,405
instruments
43. Accruals 5,932 5,612 6,202 6,743 6,640
Finance debt 9,044 14,626 9,109 15,740 15,394
Current tax payable 1,941 2,920 2,464 3,144 3,282
Provisions 11,238 9,489 1,660 1,545 2,195
83,780 82,832 59,320 69,793 77,068
Liabilities directly
associated with assets
538 1,047 163
classified as held for
sale
84,318 83,879 59,320 69,793 77,231
Non-current liabilities
Other payables 3,437 14,285 3,198 3,080 1,251
Derivative financial
3,773 3,677 3,474 6,271 5,002
instruments
Accruals 389 637 703 784 959
Finance debt 35,169 30,710 25,518 17,464 15,651
Deferred tax liabilities 15,078 10,908 18,662 16,198 19,215
Provisions 26,404 22,418 12,970 12,108 12,900
Defined benefit
pension plan and other
12,018 9,857 10,010 10,431 9,215
post-retirement benefit
plan deficits
96,268 92,492 74,535 66,336 64,193
Total liabilities 180,586 176,371 133,855 136,129 141,424
Net assets 112,482 95,891 102,113 92,109 94,652
Equity
BP shareholders‟
111,465 94,987 101,613 91,303 93,690
equity
Minority interest 1,017 904 500 806 962
Total equity 112,482 95,891 102,113 92,109 94,652
*Adjusted following the termination of the Pan American Energy LLC sale agreement, as
described in Note 4.
44. Group balance sheet
$ million
2011 2010 2009 2008 2007
Cash and cash equivalents 12,664 7,825 10,693 31,437 33,981
Cash and cash equivalents,
404 628 0 0 0
restricted
Trade notes and accounts
receivable, less estimated 30044 25439 22186 18707 30775
doubtful amounts
Other notes and accounts
receivable, less estimated 8598 6845 5459 5995 5675
doubtful amounts
Trade notes and accounts
38,642 32,284 27,645 24,702 36,450
receivable
Inventories 15,024 12,976 11,553 11,646 11,089
Other current assets 6,229 5,271 5,344 4,481 4,443
Current assets 72963 58984 55235 72266 85963
Companies carried at equity
26,708 26,715 24,411 22,030 22,053
in underlying assets
Companies carried at cost or
less and stock investments 1,544 1,557 1,577 1,636 1,647
carried at fair value
Long-term receivables and
miscellaneous investments at 6,081 7,066 5,677 4,890 4,494
cost or less, net of reserves
Investments, advances and
34,333 35,338 31,665 28,556 28,194
long-term receivables
Property, plant and
equipment, at cost, less
214,664 199,548 139,116 121,346 120,869
accumulated depreciation and
depletion
45. Other assets, including
9,092 8,640 7,307 5,884 7,056
intangibles, net
Long-term assets 258,089 243,526 178,088 155,786 156,119
Total assets 331,052 302,510 233,323 228,052 242,082
Total assets 331052 302510 233323 228052 242082
Notes and loans payable 7,711 2,787 2,476 2,400 2,383
Trade payables 33,969 30,780 24,236 21,190 29,239
Payables to equity companies 5,553 5,450 4,979 3,552 3,556
Accrued taxes other than
7,123 6,778 5,921 5,866 6,485
income taxes
Other 10,422 7,026 6,139 6,035 5,995
Accounts payable and
57,067 50,034 41,275 36,643 45,275
accrued liabilities
Income taxes payable 12,727 9,812 8,310 10,057 10,654
Current liabilities 77,505 62,633 52,061 49,100 58,312
Long-term debt 9,322 12,227 7,129 7,025 7,183
Postretirement benefits
24,994 19,367 17,942 20,729 13,278
reserves
Deferred income tax liabilities 36,618 35,150 23,148 19,726 22,899
Other long-term obligations 21,869 20,454 17,651 13,949 14,366
Long-term liabilities 92,803 87,198 65,870 61,429 57,726
Total liabilities 170308 149831 117931 110529 116038
Common stock without par
9,512 9,371 5,503 5,314 4,933
value
Earnings reinvested 330,939 298,899 276,937 265,680 228,518
Accumulated other
-9,123 -4,823 -5,461 -9,931 1,989
comprehensive income (loss)
Common stock held in
-176,932 -156,608 -166,410 -148,098 -113,678
treasury
ExxonMobil share of equity 154,396 146,839 110,569 112,965 121,762
Noncontrolling interests 6,348 5,840 4,823 4,558 4,282
Total equity 160,744 152,679 115,392 117,523 126,044
Total liabilities and equity 331052 302510 233323 228052 242082
46. Group cash flow statement
$ million
For the year ended 31 December 2011 2010 2009 2008 2007
Operating activities
Profit (loss) before taxation (4,825)
38,834 25,124 34,283 31,611
Adjustments to reconcile profit
(loss) before taxation to net cash
provided by operating activities
Exploration expenditure
written off 1,024 375 593 385 347
Depreciation, depletion and
amortization 11,135 11,164 12,106 10,985 10,579
Impairment and (gain) loss
on sale of businesses and fixed (2,072) (4,694) (808)
160 380
assets
Earnings from jointly
(6,220) (4,757) (3,901) (3,821) (3,832)
controlled entities and associates
Dividends received from
jointly controlled entities and
5,381 3,277 3,003 3,728 2,473
associates
Interest receivable (198) (277) (258) (407) (489)
Interest received
216 205 203 385 500
Finance costs
1,246 1,170 1,110 1,547 1,393
Interest paid (1,110) (912) (909) (1,291) (1,363)
Net finance expense (income)
relating to pensions and other (263) (47) (591) (652)
192
post-retirement benefits
Share-based payments (88)
47. 197 450 459 420
Net operating charge for
pensions and other post-retirement
benefits, less contributions
and benefit payments for
(1,004) (959) (887) (173) (404)
unfunded plans
Net charge for provisions,
(298) (92)
less payments 2,976 19,217 650
(Increase) decrease in
(3,988) (3,895) (5,363) (7,255)
inventories 9,010
(Increase) decrease in other
(9,913) (15,620)
current and non-current assets 7,595 2,439 5,210
Increase (decrease) in other
(5,767) (5,828) (6,101) (3,857)
current and non-current liabilities 20,607
Income taxes paid (8,035) (6,610) (6,324) (12,824) (9,072)
Net cash provided by operating
activities 22,154 13,616 27,716 38,095 24,709
Investing activities
Capital expenditure (17,845) (18,421) (20,650) (22,658) (17,830)
Acquisitions, net of cash
(10,909) (2,468) (395) (1,225)
acquired 1
Investment in jointly controlled
(857) (461) (578) (1,009) (428)
entities
Investment in associates (55) (65) (164) (81) (187)
Proceeds from disposals of fixed
assets 3,500 7,492 1,715 918 1,749
Proceeds from disposals of
(768)
businesses, net of cash disposed a 9,462 966 11 2,518
Proceeds from loan repayments
301 501 530 647 192
Other (200)
– – 47 374
Net cash used in investing
(26,633) (3,960) (18,133) (22,767) (14,837)
activities
48. Financing activities
Net issue of shares (2,567) (7,113)
74 169 207
Proceeds from long-term
financing 11,600 11,934 11,567 7,961 8,109
Repayments of long-term
(9,102) (4,702) (6,021) (3,821) (3,192)
financing
Net increase (decrease) in short-
(3,619) (4,405) (1,315)
term debt 2,227 1,494
Dividends paid
BP shareholders (4,072) (2,627) (10,483) (10,342) (8,106)
Minority interest (245) (315) (416) (425) (227)
Net cash provided by (used in)
(9,551) (10,509) (9,035)
financing activities 482 840
Currency translation differences
relating to cash and cash (492) (279) (184)
110 135
equivalents
Increase (decrease) in cash and
(4,489)
cash equivalents 10,217 142 4,635 972
Cash and cash equivalents at
beginning of year 18,556 8,339 8,197 3,562 2,590
Cash and cash equivalents at
end of year 14,067 18,556 8,339 8,197 3,562
*2010 included a deposit received in advance of $3,530 million in respect of the expected sale of
our interest in Pan American Energy LLC; 2011 includes the repayment of the same amount
following the termination of the sale agreement as described in Note 4.
Exxon Mobil Corp., Consolidated Statement of Cash Flows
USD $ in millions
2011 2010 2009 2008 2007
Net income including non-controlling
42,206 31,398 19,658 46,867 41,615
interests
49. Depreciation and depletion 15,583 14,760 11,917 12,379 12,250
Deferred income tax charges (credits) 142 -1,135 – 1,399 124
Postretirement benefits expense in
544 1,700 -1,722 57 -1,314
excess of (less than) payments
Other long-term obligation provisions in
-151 160 731 -63 1,065
excess of (less than) payments
Dividends received greater than (less
than) equity in current earnings of equity -273 -596 -483 921 -714
companies
Adjustments for noncash transactions 15845 14889 10443 14693 11411
(Increase) reduction - Notes and
-7,906 -5,863 -3,170 8,641 -5,441
accounts receivable
(Increase) reduction - Inventories -2,208 -1,148 459 -1,285 72
(Increase) reduction - Other current
222 913 132 -509 280
assets
Increase (reduction) - Accounts and
8,880 9,943 1,420 -5,415 6,228
other payables
Changes in operational working
-1012 3845 -1159 1432 1139
capital, excluding cash and debt
Net (gain) on asset sales -2,842 -1,401 -488 -3,757 -2,217
All other items, net 1,148 -318 -16 490 54
Net cash provided by operating
55345 48413 28438 59725 52002
activities
Additions to property, plant and
-30,975 -26,871 -22,491 -19,318 -15,387
equipment
Proceeds associated with sales of
subsidiaries, property, plant and
11,133 3,261 1,545 5,985 4,204
equipment, and sales and returns of
investments
(Increase) decrease in restricted cash and
224 -628 – – 4,604
cash equivalents
Additional investments and advances -3,586 -1,239 -2,752 -2,495 -3,038
Collection of advances 1,119 1,133 724 574 391
Additions to marketable securities -1,754 -15 -16 -2,113 -646