
Recommended
More Related Content
What's hot
What's hot (20)
Similar to ABG
Similar to ABG (20)
More from krishna dhakal
More from krishna dhakal (8)
Recently uploaded
Recently uploaded (20)
ABG
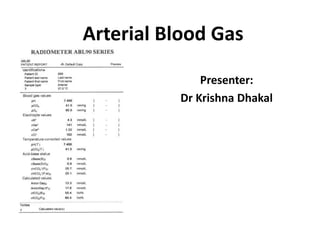
- 1. Arterial Blood Gas Presenter: Dr Krishna Dhakal
- 2. Objectives • Identify the indications/contraindications for blood gas sampling • Discuss the process of ABG • Highlight Acid base Regulation , ABG parameters and Acid base disorder • To know the step wise approach of of acid base analysis of ABG
- 3. Milestones • 1921 Barcroft and Nagahashi - aerotonometry for direct measurement of the partial pressure of oxygen in blood. • Roughton and Scholander (1943) - idea of a one- piece syringe and gas analyser • Clark's electrode(1956)- development of present commercial blood gas systems THE DEVELOPMENT OF BLOOD GAS ANALYSIS-C. S. BREATHNACH
- 4. Is Clinical Acid-base Interpretation Still a Problem • A study in Australia from 2010- 29% of ABGs incorrectly interpreted by EM doctors. • 31% incorrectly interpreted by critical care nurses (2011 Utah, USA) • However, using graphical tools the result - approx. only 17% incorrectly interpreted. • Austin K et al. Accuracy of interpretation of arterial blood gases by emergency medicine doctors. Emergency Medicine Australasia 2010;22:159-165 • Doig AK et al. Graphical Arterial Bloood Gas Visualization Tool Supports Rapid and Accurate Data Interpretation. Computers Informatics Nursing 2011;29:204-211
- 6. • The results of ABG sampling only reflect the physiological state of the patient at the time of sampling • It is important they are correlated with the evolving clinical scenario and changes in a patient’s treatment
- 8. Hazards
- 9. Procedure for Radial Artery Puncture • The radial artery is the one most often used in practice in the acute care setting because of easy access and the fact that the artery is superficial and easily palpated. • Prior to any attempt at arterial puncture the practitioner must perform the Modified Allen’s Test
- 10. Modified Allen’s Test • To determine that collateral circulation is present from the ulnar artery in the event of thrombosis of the radial artery. • Position the patient’s arm on a firm flat surface with the wrist extended (Compress both the radial and ulnar arteries with the index and middle fingers of both hands • Ask the patient to clench and unclench fist until blanching of distal skin occurs • Release pressure over the ulnar artery and assess skin colour and refill – approximately 5 seconds after release of the artery, the extended hand should blush owing to capillary refilling. • If blanching occurs, palmar arch circulation is inadequate and sampling could lead to ischaemia of the hand
- 12. pH stat management • pH and pC02 of hypothermic blood to normal • In Cardiopulm bypass- addition of Co2 via oxygenator • Temperature correction of blood gas samples is required to interpret the values from a hypothermic patient but measured at 37 degree Celsius • Used in congenital heart disease especially in cooling prior to hypothermic circulatory arrest
- 13. Alpha stat management • Alpha- refers to charge portion of histidine in imidazole residue • Objective- to maintain biologic neutrality by preserving the alpha imidazole and protein charge state OH/H ratio and enzyme function during hypothermia • Most common strategy in adult cardiopulmonary bypass • Doesn’t invove supplement co2 • Doesn’t require temperature correction
- 14. NORMAL VALUES pH 7.35 - 7.45 PaCO2 35 - 45 mm Hg PaO2 70 - 100 mm Hg SaO2 93 - 98% HCO3 ¯ 22 - 26 mEq/L Base excess -2.0 to 2.0 mEq/L
- 15. After sampling ABG analysis • Alveolar ventilation Oxygenation • PaO2 • Sa02 • PaO2 / FiO2 ratio • arterial-Alveolar O2 gradient • a-A O2 ratio • Acid base balance
- 16. Alveolar Ventillation PaCO2=K*(VCO2/VA)= k* [VCO2/VE(1-VD/VT)] PaCO2- 35 - 45 mm Hg • Hypercapnea > 45 mm Hg (Hypoventilation) Respiratory Acidosis • Hypocapnea < 35 mm Hg (Hyperventilation) Respiratory Alkalosis
- 17. Oxygenation Pao2 • 80-108 mm hg • PaO2 = 120 − Age/3 HYPOXEMIA Mild (60-80) mmHg Moderate(40-60) mmHg Severe <40 mmHg
- 18. Oxygenation • The Alveolar arterial gradient(A-a PO2 Gradient) • A-a PO2=[ PIO2 –PaCO2/RQ]- PaO2 = [ FIO2(PB-PH20)-(PaCO2/RQ)]-Pa02 =[0.21 (760-47)- (40/0.8)]-90= 10 mmHg
- 19. The Alveolar arterial gradient PAO2=104 mmHg PaO2=100mmHg Venous admixture A-a = 4 -25 mm Hg Alveolar Air Arterial Blood
- 20. PaO2/FiO2 ratio • Another common measure of oxygenation • Most often employed in ventilated patients. • PaO2/FiO2 ratio – • 300 to 500 mmHg Normal • < 300 mmHg abnormal gas exchange • <200 mmHg hypoxemia
- 22. Brownsted- lowry concept • An acid is a proton donor and a base is a proton acceptor
- 23. • Hydrogen Ion Concentration and pH(in aqueous solution) pH = -log [H+] [H+]nEq/L = 24 x (PCO2 / [HCO3]) Henderson-Hasselbalch equation pH = 6.1 + log HCO3 0.03 x PCO2
- 24. Abnormal acid-base balance • Acid-base imbalances can be defined as acidosis or alkalosis. • Acidosis is a state of excess H+ • Acidemia results when the blood pH is less than 7.35 • Alkalosis is a state of excess HCO3- • Alkalemia results when the blood pH is greater than 7.45
- 25. Acid base Regulation Three mechanisms to maintain pH – Respiratory (CO2) – Buffer (in the blood: carbonic acid/bicarbonate, phosphate buffers, Hgb) – Renal (HCO3 -)
- 26. • A buffer is a substance that can give or accept protons • i.e. H+, in a manner that tends to minimise changes in the pH of the solution. • Usually buffers are composed of a weak acid (proton donor) and a weak base (proton acceptor) as shown in the following equation. Acid base Regulation
- 27. Classification of Acid base disorder
- 28. Secondary Response • Designed to limit the change in H+ produced by primary change in acid base disorder • Accomplished by changing the other component of paCO2/ HCO3 ratio in same direction • Is not compensatory response
- 30. Response to metabolic Acid Base Disorder Involves change in minute ventilation mediated by peripheral chemoreceptors located in carotid bifurcation and response to brain pH Metabolic acidosis: • Increase in minute ventillaion (Vt and RR)- • Subsequent decrease in PaCO2 • Appears in 30-120 minutes and take upto 24 hrs PaCO2= 1.2* HCO3 Expected PaCO2= 40-[1.2 * (24- current HCO3)]
- 32. Response to metabolic Acid Base Disorder Metabolic Alkalosis • Decrease in Minute ventilation and increase in PaCO2 • Not vigorous as response to metabolic acidosis – peripheral stimulator not active PaCO2= 0.7* HCO3 Expected PaC02=40+[0.7*(current HCO3-24)]
- 33. Response to Respiratory acid base disorder • Secondary response to change in PaCO2 occurs in the kidneys – HCO3 absorption in proximal tubules adjusted to produce change in plasma HCO3 • Relatively slow and can take 2-3 days to reach completion
- 34. Response to Respiratory acid base disorder Acute Respiratory disorder • Acute change in PaCO2 have small effect on plasma HCO3 • Acute Respiratory Acidosis HCO3=0.1* PaCO2 • Acute Respiratory alkalosis HCO3=0.2* PaCO2
- 35. Response to Respiratory acid base disorder Chronic Respiratory disorders • Increase in PaCO2- increase HC03 reabsorption in proximal tubules- raises HCO3 • Decrease in PaC02- lowers HCO3 reabsorption – lowers plasma HCO3 HCO3=0.4* PaCO2 Chronic Respiratory acidosis Expected HCO3=24 + [ 0.4*(current PaCO2-40)]
- 36. Response to Respiratory acid base disorder Chronic respiratory alkalosis • Expected HCO3=24-[0.4*(40-current PaCO2)]
- 40. STEPWISE APPROACH TO ACID-BASE ANALYSIS Stage I: Identify the Primary Acid-Base Disorder • PaCO2 and pH are used to identify the primary acid base disorder. Rule 1: • If the PaCO2 and/or the pH outside the normal range- acid-base disorder.
- 41. STEPWISE APPROACH TO ACID-BASE ANALYSIS Rule 2(ROME) • If the PaCO2 and pH are both abnormal- the directional change is compared • 2a. If the PaCO2 and pH change in the same direction, there is a primary metabolic acid-base disorder. • 2b. If the PaCO2 and pH change in opposite directions, there is a primary respiratory acid-base disorder.
- 42. • pH- 7.12 • PaCO2- 23.7 mm HG • Primary metabolic acidosis
- 43. • pH – 7.33 • PaC02-56.4 mm hg • Primary Resp disorder • Primary respiratory acidosis
- 44. Response to Respiratory acid base disorder Rule 3 • pH or PaCO2 is abnormal- mixed metabolic and respiratory disorder (i.e., equal and opposite disorders). • 3a • If the PaCO2 is abnormal, the directional change of PaCO2 identifies the type of respiratory disorder (e.g., high PaCO2 indicates a respiratory acidosis), and the opposing metabolic disorder • 3b. • If the pH is abnormal, the directional change in pH identifies the type of metabolic disorder (e.g., low pH indicates a metabolic acidosis) and the opposing respiratory disorder.
- 45. • Ph-7.37 and PaCO2- 27.2 mmhg • PaCO2- abnormal • Mixed metabolic and resp disorder • PaC02- low –resp alkalosis • metabolic disorder- acidosis • Primary metabolic acidosis with respiratory alkalosis
- 46. STEPWISE APPROACH TO ACID-BASE ANALYSIS Stage II: Evaluate the Secondary Responses • The goal in Stage II - determine if there is an additional acid base disorder. Rule 4: • For a primary metabolic disorder, if the measured PaCO2 is higher than expected-secondary respiratory acidosis • If the measured PaCO2 is less than expected- secondary respiratory alkalosis.
- 47. Primary metabolic Acidosis Measured PaCO2= 23.7 mm Hg • Expected PaCO2= 40- [1.2( 24-7.3)] = 19.96 mm Hg • Measured PaCO2 > expected • Secondary -Respiratory Acidosis
- 48. STEPWISE APPROACH TO ACID-BASE ANALYSIS Rule 5: • For a primary respiratory disorder, a normal or near-normal HCO3 indicates that the disorder is acute.
- 49. STEPWISE APPROACH TO ACID-BASE ANALYSIS Rule 6: • For a primary respiratory disorder HCO3 is abnormal, the expected HCO3 for a chronic respiratory disorder is determined 6a. Chronic respiratory acidosis, • HCO3 <expected, -incomplete renal response • HCO3>expected-secondary metabolic alkalosis 6b. chronic respiratory alkalosis, if the HCO3 > expected- an incomplete renal response, HCO3< expected -secondary metabolic acidosis.
- 50. If primary disorder is respiratory < 0.3–Chronic >0.8–acute 0.3–0.8–acute on chronic
- 51. 50-40 = 10 = 0.2 88-40 48 Imp- CHRONIC pH = 7.3 : H+=50
- 52. pH= 7.33 [H+] = 45 45-40 = 5 = 0.3125 56-40 16 Imp- Acute on Chronic
- 53. STEPWISE APPROACH TO ACID-BASE ANALYSIS • Stage III: Use The “Gaps” to Evaluate a Metabolic Acidosis • The final stage of this approach is for patients with a metabolic acidosis, where the use of measurements called gaps can help
- 54. GAPS Anion gap The difference between unmeasured anion and cation • Rough estimation of relative abundance of unmeasured anion • Measured cation – measured anion • AG(UA-UC)= Na- (Cl+ HCO3) • 8-16 meq/L
- 55. GAPS Influence of albumin • Albumin is principle unmeasured anion .. • weak acid contribute 3meq/l to AG for each 1gm/dl albumin in plasma • AGc(corrected AG) =AG+2.5*(4.5-Albumin)
- 57. Gap Gap Ratio (delta ratio) • In the presence of High anion Gap metabolic acidosis – presence of another metabolic acid base disorder • Delta rato=AG excess/HCO3 Deficit =(AG-12)/ (24-HCO3)
- 58. Gap Gap Ratio (delta ratio)
- 59. Base excess and deficit • Defined as the amount of acid (or base) required to be added to whole blood to achieve a pH of 7.4 at 37˚C and paCO2 of 40mmHg. • -2 to + 2 If the base is in excess- • may be due to decrease in metabolic acids • may be due to increase in buffers (e.g. HCO3-) If the base is in deficit • may be due to excess metabolic acids
- 60. • Samples ABG -1 , 2 and 3 • What is the primary acid base disorder?? • What is the compensation • What is the secondary response?? • Final impression??
- 61. • Can there be negative anion Gap??
- 63. • Samples were obtained from 4 climbers who had just submitted Mount Everest at 8400 meter without 02 • PB of 272 mm hg and PI02 of 47 mm Hg • Alveolar o2 – 30 mmhg and had increased A-a gradient • All had normal psychomotor function-result of aclimatization • Pa02 – normal once they descended to 7000 meter Grocott MP et al . Arterial Blood Gases and Oxygen content in Climbers on Mount Everest. N Engl J Med. 2009 Jan 8; 360 (2) :140-9.
- 64. Summary • ABG-quantifies response to therapeutic intervention, diagnostic evaluations , assess early goal-directed therapy and monitor severity and progression of documented disease processes • Ventilation Status • Oxgenation Status • Normal , Acidemia Or Alkalemia? • Respiratory Or Metabolic Or Mixed? • If Respiratory – Acute Or Chronic? • If Metabolic – Anion Gap/Delta Gap? • Is Compensation Adequate?
- 65. Summary • ABG sampling- reflect the physiological state of the patient -correlation with the evolving clinical scenario and changes in a patient’s treatment
- 66. References • The ICU Book 4th edition- Marino • Clinical Anesthesiology- Morgan 5th Edition • The Development of Blood Gas Analysis --C. S. Breathnach • www.acutecaretesting.org • www.derrangedphysiology.com • Blood Gas and Critical Care Analyte Analysis
Editor's Notes
- In this method the oxygen, carbon monoxide and nitrogen of the blood and reagents were extracted that measure pH, carbon dioxide tension (PCO2), and PO2 and calculate many derived variables.
- The impact of this ABG-interpreting inadequacy may cause trouble in the ICU as well as ED The results of ABG sampling only reflect the physiological state of the patient at the time of sampling – it is important they are correlated with the evolving clinical scenario and changes in a patient’s treatment (Danckers & Fried, 2013).
- the need to further evaluate the adequacy of a patient's ventilatory (PaCO2), acid base (pH), and oxygenation (PaO2 and O2Hb) status, the oxygen-carrying capacity (PaO2, O2Hb, tHb, and dyshemoglobin saturations) and intrapulmonary shunt (Qsp/Qt); the need to quantify the response to therapeutic intervention (e.g., supplemental oxygen administration, mechanical ventilation) or diagnostic evaluations (e.g., exercise desaturation) the need to assess early goal-directed therapy (EGDP) measuring ScvO2 in patients with sepsis, septic shock and after major surgery the need to monitor severity and progression of documented disease processes
- Supra therapeutic coagulopathy ? Infusion of thrombolytic agents ? Needle stick / Indwelling catheter insertion? Relative contraindication INR ≥3, aPTT ≥ 100 sec – Avoid repeating But absolute contraindication to catheter insertion Platelet count? For needle stick / Catheterisation? If >50,000 – can be performed 30-50,000 - needle stick performed with increased compression time, catheterisation contraindicated <30,000 – generally avoided
- Hyperextension of the wrist should be avoided, as it will obliterate a palpable pulse)
- that have demonstrated that equilibration of oxygen between blood and air causes a time-dependent in vitro change in pO2. Typically, the effect is to increase pO2; pO2 increases if initial pO2 is less than that of ambient air (i.e. ~ 150 mmHg, 20kPa), and decreases if initial pO2 is greater than that of ambient air. Air vs glass syringe but that glass syringes preserve pO2 values better than plastic syringes. This difference is likely due to the relatively higher oxygen permeability of plastic [24]. Movement of oxygen from ambient air across the plastic syringe-wall to the blood sample can cause an artefactual, time and temperature dependent, increase in pO2. Liquid heparin best avoided because their use is associated with risk of over diluting blood samples, which can cause erroneously low pCO2 result 0.05ml heparin= 1ml of blood 3ml syringe- 22G needle 1-2ml blood As soon as possible If delay > 20 min Iced samples(up to 2 hr) More delay-O2 consumed CO2 produced, lactic acid generation Venous -No Pulsatile filling Lacking Flash of blood Low PaO2 high PaCO2 Clinically not correlating Venous pH is usually 0.03 to 0.05 pH units lower than the arterial pH Venous pCO2 is usually 4 to 5 mmHg higher Little or no increase in HCO3 Peripheral Venous pH is approximately 0.02 to 0.04 pH units lower than the arterial pH Venous pCO2 is approximately 3 to 8 mmHg higher Venous serum HCO3 concentration is approximately 1 to 2 meq/L higher Risk of alteration of results with: 1) size of syringe/needle 2) volume of sample Syringes must have > 50% blood Use only 3ml or less syringe 25% lower values if 1 ml sample taken in 10 ml syringe (0.25 ml heparin in needle) Air Bubbles pO2 150 mm Hg & pCO2 0 mm Hg Contact with AIR BUBBLES increase pO2 & decrease pCO2 Seal syringe immediately after sampling WBC Counts 0.01 ml O2 consumed/dL/min Marked increase in high TLC/plt counts : pO2 Chilling / immediate analysis Temp less than 37 °C - 5mmHg paO2/1 ° C - 2mmHg paCO2/1 °C + 0.012 pH /1 ° C
- Advantage : cerebral blood flow increase
- a
- %MetHb < 2.0% %COHb < 3.0%
- Lactate Hemoglobin Electrolytes- Na . K Ionized calcium Hypercapnea > 45 mm Hg (Hypoventilation) Respiratory Acidosis Hypocapnea < 35 mm Hg (Hyperventilation) Respiratory Alkalosis
- Vco2-rate of carbondioxide production
- PAO2 = partial pressure of oxygen in alveolar gas, PB = barometric pressure (760mmHg) Ph2o = water vapor pressure (47 mm Hg) FiO2 = fraction of inspired oxygen PCO2 = partial pressure of CO2 in the ABG R = respiratory quotient (0.8) HYPOXEMIA Mild (60-80) mmHg Moderate(40-60) mmHg Severe <40 mmHg The normal A-a gradient varies with age and can be estimated from the following equation, assuming the patient is breathing room air A-a gradient = 2.5 + 0.21 x age in years Also, A-a gradient = (Age/4)+ 4 The A-a gradient increases with higher FiO2. When a patient receives a high FiO2, both PAO2 and PaO2 increase. However, the PAO2increases disproportionately, causing the A-a gradient to increase
- The A–a gradient for O2 depends on the amount of right-to-left shunting, the amount of V/Q mismatch, and mixed venous O2 tension
- refers to the blood entering the arterial system without passing through ventilated areas of lung causing the PO2 of arterial blood to be less than that of alveolar PO2. Normally 15mmhg A-a gradient for o2 is directly proportional to the rt-lt shunting , but progressively increases with age up to 20–30 mm Hg
- The hydrogen ion concentration [H+] in extracellular fluid is determined by the balance between the partial pressure of carbon dioxide (PCO2) and the concentration of bicarbonate [HCO3-] in the fluid. This relationship is expressed as follows the stability of the extracellular pH is determined by the stability of the PCO2/HCO3- ratio.
- Blood buffer – 48 mmol l-1
- 1.2 meq/l decrease in paco2
- o.7 increase in hco3
- Due to delay in secondary response – respiratory acid base disorder - Acute and chronic disorders
- Expected change – 1 meq/l per 10 mm hg increase in pa co2 and 2 m eq/l per 10 mmm hg decrease in paco2
- Expected change – 4 meq/l increase in hco3 per 10 mm hg times increase in Paco2
- 4 meq/l decrease in hco3 per 10 mm hg decrease in paco2
- Paco2 up and ph low –resp acidosis Pavo2 low-ph-high-resp alkalosis
- Ph low and paco2 high –resp and ph high pco2 low- resp alkalosis Pco2 low ph high – resp alk Ph low- resp and ph high -metabolic
- PH-7.37 pCo2-27.2 mm hg Po2-144 mm hg HCO3- 15.4 mmol/L
- Na+ UC= (Cl+HCO3)+UA If metabolic acidosis due to accumulation of non volatile acids or primary loss of bicarbonate
- Albumin is principle unmeasured anion ..weak acid contribute 3meq/l to AG for each 1gm/dl albumin in plasma Low level lower AG-mask presence of unmeasured anion (lactate) that is contributing to metabolic acidosis 4.5 represent normal concentration of albumin
- HCO3 is not reliable in DKA because isotonic saline produce hyperchloremic acidosis that prevent bicarbonate from rising despite resolving ketoacidosis. Ratio-1 pure anion gap acidosis Reaches 0 when ketones
- Siggard and Andersen in 1963 Standard base excess accounts for non bicarbonate buffers-somewhat correct Sbe is concentration of titrable base when blood is tirated back to normal plsma ph at normal pco2 at actual o2 saturation Base excess in blood or actual base excess- the concentration of titrable base when blood is titrated with strong base or acid to a plasma of 7.4 at pco2 of 40 mm hg Postitive value-e relative deficit of non carbonic carbonic acids . Base deficit –relative excess of non carbonic acids Base exces in ecf or standard base excess C base ecf=16.2*(ph-7.40)-24.8+cHCO3 effect of oxygen saturation c base (oxygenated)= cbase actual-0.2*ctHB(1-SO2)
- Presence of unmeasured cation lead to abnormally low or even negative anion gap Pregnant woman on magnesium sulphate Patient on lithium carbonate or citrate Citrate is easily metabolized….lithium is strong unmeasured cation ..it will influence the anion gap Even polymixin B which is strongly polycationic even THAM..
- Moderate to severe alkalaemia Profound hypoxia Severe respiratory alkalosis Marked metabolic acidosis