SlideShare a Scribd company logo
1 of 30
Introduction to Data Science in Python
(Visualization ver.)
廻船孝行 (KAISEN Takayuki)
PyCon mini Hiroshima 2018
Contact: ksn0215@gmail.com
Ver. 3.1
Repository: https://github.com/ksnt/pycon_hiro_2018
Overview
1. Geographic Data Analysis
2. Interactive Graph and Application
3. Discussion
Python 3.6.3
Pip 10.0.1
Development Environment
Ubuntu 17.10
・ Injury due to an accident
Notice
・ Hard to pronounce some
words
・ Appreciate for
your cooperation in advance!
0. WHO ARE YOU?
⚫ Favorite Languages
⚪ Python, R, Scala
⚫ Interests
⚪SNA, CSS, CMC, ABM,
Complex Systems,
Data Science, ...
⚫ Python Conference Attendance
⚪PyCon mini JP (2010?)
⚪PyConJP 2011
⚪Tokyo.Scipy (2011?)
⚫ Love Online Learning
⚫ Oct 2017 - HiroshimaFreeman, L. (2004). The development of social network analysis. A Study in the
Sociology of Science, 1.
1. Social network analysis is motivated by a structural in-
tuition based on ties linking social actors,
2. It is grounded in systematic empirical data,
3. It draws heavily on graphic imagery, and
4. It relies on the use of mathematical and/or computation-
al models.
Takeaways: All I am Talking to You
1. It is incredibly easy to make use of
geographic data with Python
(Folium)
2. It is incredibly easy to develop data
driven web application with Python
(Plotly and Dash)
1. Geographic Data Analysis
2. Interactive Graph and Application
3. Discussion
How to use geographic data
GIS = Geographic Information System
“A geographic information system (GIS) is a system designed to capture,
store, manipulate, analyze, manage, and present spatial or geographic
data. “ Wikipedia
YOU DON’T HAVE TO USE GIS!
Reference: “Python Geospatial Development – Third Edition” Chapter2
How to make use of Geographic
data in Python
・ArcGIS, QGIS (PyQGIS)
・Geopandas
・Folium (Leaflet)
・Geopy
・And so forth…
(reference) https://qiita.com/aimof/items/b4e4551d27abaf5bb258
⚪ Do not need knowledge on GIS
⚪ Can easily create Web map
How to install folium
$ pip install folium
$ conda install -c conda-forge folium
or
Data & Visualization(1)
https://nbviewer.jupyter.org/github/ksnt/Predictor-of-blights-in-
Detroit/blob/master/Final_Report_1.1.ipynb
HERE!
Data & Visualization(2)
df = pd.Dataframe()
df = df.attend(crime_data[‘LAT’])
df = df.attend(crime_data[‘LON’])
df = df.T
df = df.reset_index(drop=True)
df[‘LAT’] = round(df[‘LAT’],3)
df[‘LON’] = round(df[‘LON’],3)
df.head()
Data & Visualization(3)
from folium.plugins import HeatMap
from IPython.display import HTML
import folium
map_detroit = folium.Map(location=(42.40,-83.01))
data = []
for i in range(len(df)):
data.append((df['LAT'][i],df['LON'][i]))
HeatMap(data,radius=9).add_to(map_detroit)
map_detroit.save('crimes.html')
HTML(r'<iframe width="800" height="500"
frameborder="0" allowfullscreen
src="./crimes.html"></iframe>')
https://nbviewer.jupyter.org/github/ksnt/Predictor-of-blights-in-
Detroit/blob/master/Final_Report_1.1.ipynb
Data & Visualization(4)
How to visualize geographical data with folium
1. Data cleaning
2. Create map
3. Put the data into the map!
(4. Save the map as a HTML file )
(5. Draw the HTML file )
HeatMap(data,radius=9).add_to(map_detroit)
1. Geographic Data Analysis
2. Interactive Graph and Application
3. Discussion
Data Visualization in Python
⚫ seaborn: cool
⚫ bokeh: cool, interactive
⚫ plotly: cool, interactive, reactive
⚫ matplotlib: standard
⚫ PixieDust (IBM?): interactive, …?
>>> plotly.__version__
'2.4.1'
>>> dash.__version__
'0.21.0'
⚫ mpld3: cool, interactive
How to Use Plotly and Dash
$ pip install plotly
$ pip install dash
$ python
>>> import plotly
>>> import dash
Interactive Graph For Scatter Plot
(Optional)
https://nbviewer.jupyter.org/gist/ksnt/340910aae39670202e4f790213e7afdc
Interactive Graph for Bar Plot
import pandas as pd
import plotly
import plotly.graph_objs as go
df2 = pd.read_excel('globalterrorismdb_0616dist.xlsx',header=0)
data = [go.Bar(
x=df2["country_txt"].value_counts()[:20].index,
y=df2["country_txt"].value_counts()[:20]
)]
layout = go.Layout(
title="Top 20 Frequency of Terrorism Incidents 1970 - 2015",
xaxis={"title":"Country"},
yaxis={"title":"Occurence of terrorism"},
)
fig = go.Figure(data=data, layout=layout) # Preparation of plot by Plotly
plotly.offline.iplot(fig, filename='basic-bar') # not online figure
You have to prepare for this data!
https://nbviewer.jupyter.org/gist/ksnt/eb8ac99dd69ecc5dc5774bf673977ceb
Interactive Graph for Time Series Plot
layout = plotly.graph_objs.Layout(
title="Occurence of Terrorism Incidents",
xaxis={"title":"Year"},
yaxis={"title":"Occurence of terrorism"},
)
iraq_incidents = df2[df2["country_txt"] == "Iraq"]
iraq_incidents_count = iraq_incidents['iyear'].value_counts()
iraq_incidents_count = iraq_incidents_count.sort_index()
iraq = go.Scatter(
x=iraq_incidents_count.index,
y=iraq_incidents_count,
name = "Iraq",
line = dict(color="black"),
Opacity = 0.8)
year = [i for i in range(1970,2016)]
data = [iraq,us,pakistan,india,afghanistan,colombia,peru,phil,el,uk,turkey,spain,sri,somalia,nigeria,algeria,
france,yemen,lebanon]
fig = plotly.graph_objs.Figure(data=data, layout=layout)
plotly.offline.iplot(fig, show_link=False,config={"displaylogo":False, "modeBarButtonsToRemove":
["sendDataToCloud"]})
https://nbviewer.jupyter.org/gist/ksnt/eb8ac99dd69ecc5dc5774bf673977ceb
Additional Example – MonteCarlo
Simulation (Optional)
https://nbviewer.jupyter.org/gist/ksnt/101a44cc21b0eb990f96dc1d640dbd42
Plotly Dash
“”” Dash is Shiny for Python “””
― Chris Parmer, Dash: Shiny for Python
https://youtu.be/5BAthiN0htc
“ Dash is a Python framework for building web application”
・ Flask
・ React.js
・ Ideal for building data visualization apps
Monte Carlo Simulator (1)
https://montecarlo-dash-app.herokuapp.com/
Monte Carlo Simulator (2)
Krauth, W. (2006). Statistical mechanics: algorithms and computations (Vol. 13). OUP Oxford.
Covered by points
Num of all points →S(□) = 4
r=1 r=1
Num of point in the circle
→ S(○) = π
Num of all points
Num of point in the circle
S(○)
S(□)
=
4
π
Count up these points!
Points = {x,y}, x,y 〜 U(-1,1)
Useful article about Monte Carlo Simulation in Japanese is:
—モンテカルロ法の前線 サイコロを振って積分する方法 福島 孝治
https://www.smapip.is.tohoku.ac.jp/~smapip/2003/tutorial/presentation/koji-hukushima.pdf
Institution
Monte Carlo Simulator (3)
https://montecarlo-dash-app.herokuapp.com/
Monte Carlo Simulator (4)
https://gist.github.com/ksnt/ccd88b6f63081e6d2d11f0daf6d0bc4e
⚫ Import libraries
⚫ app = dash.Dash()
server=app.server
server.secret_key = os.environ.get('secret_key', 'secret')
⚫ app.layout = html.Div( # WRITE LAYOUT)
⚫ @app.callback( #WRITE OPERATION)
⚫ if __name__ == '__main__':
app.run_server(debug=True)
View
Controller
Python vs R
as Data Visualization Tool
Speed Extensibility Price Packages/ Libraries
(for Data Analysis)
Python ○ ◎ Free ML
R △ △
OOP
(S3,S4,R5(>=2.12))
Free Statistics
Tableau ? △?
For EDA?
¥18000/year
¥51000/year
¥102000/year
¥0/year students
and teachers
?
Kibana, Superset, Redash, Metabase, Splunk, KNIME, Google Charts, etc…
Julia, Matlab, Scilab, Octave, etc...
3 – 2ε. Welcome to Plotly Dash
Document Translation Project!
https://goo.gl/wnjHA6 HERE!
3 – ε. I am looking for new
opportunities!
・ Places: Anywhere
・ Salary & Benefits: Negotiable
・ Feel free to talk to me!
・ Like: International, Diverse, Python,
Data analysis
1. Geographic Data Analysis
2. Interactive Graph and Application
3. Discussion
Discussion

More Related Content

Similar to Pyconmini Hiroshima 2018

Geospatial Data Analysis and Visualization in Python
Geospatial Data Analysis and Visualization in PythonGeospatial Data Analysis and Visualization in Python
Geospatial Data Analysis and Visualization in PythonHalfdan Rump
 
Python Pyplot Class XII
Python Pyplot Class XIIPython Pyplot Class XII
Python Pyplot Class XIIajay_opjs
 
Python tools to deploy your machine learning models faster
Python tools to deploy your machine learning models fasterPython tools to deploy your machine learning models faster
Python tools to deploy your machine learning models fasterJeff Hale
 
Using the Kinect for Fun and Profit by Tam Hanna
Using the Kinect for Fun and Profit by Tam HannaUsing the Kinect for Fun and Profit by Tam Hanna
Using the Kinect for Fun and Profit by Tam HannaCodemotion
 
Letswift18 워크숍#1 스위프트 클린코드와 코드리뷰
Letswift18 워크숍#1 스위프트 클린코드와 코드리뷰Letswift18 워크숍#1 스위프트 클린코드와 코드리뷰
Letswift18 워크숍#1 스위프트 클린코드와 코드리뷰Jung Kim
 
An Introduction to Game Programming with Flash: An Introduction to Flash and ...
An Introduction to Game Programming with Flash: An Introduction to Flash and ...An Introduction to Game Programming with Flash: An Introduction to Flash and ...
An Introduction to Game Programming with Flash: An Introduction to Flash and ...Krzysztof Opałka
 
Atari Game State Representation using Convolutional Neural Networks
Atari Game State Representation using Convolutional Neural NetworksAtari Game State Representation using Convolutional Neural Networks
Atari Game State Representation using Convolutional Neural Networksjohnstamford
 
carrow - Go bindings to Apache Arrow via C++-API
carrow - Go bindings to Apache Arrow via C++-APIcarrow - Go bindings to Apache Arrow via C++-API
carrow - Go bindings to Apache Arrow via C++-APIYoni Davidson
 
Automated ML Workflow for Distributed Big Data Using Analytics Zoo (CVPR2020 ...
Automated ML Workflow for Distributed Big Data Using Analytics Zoo (CVPR2020 ...Automated ML Workflow for Distributed Big Data Using Analytics Zoo (CVPR2020 ...
Automated ML Workflow for Distributed Big Data Using Analytics Zoo (CVPR2020 ...Jason Dai
 
Deep Learning as a Cat/Dog Detector
Deep Learning as a Cat/Dog DetectorDeep Learning as a Cat/Dog Detector
Deep Learning as a Cat/Dog DetectorRoelof Pieters
 
(120303) #fitalk ip finder and geo ip for fun
(120303) #fitalk   ip finder and geo ip for fun(120303) #fitalk   ip finder and geo ip for fun
(120303) #fitalk ip finder and geo ip for funINSIGHT FORENSIC
 
(120303) #fitalk ip finder and geo ip for fun
(120303) #fitalk   ip finder and geo ip for fun(120303) #fitalk   ip finder and geo ip for fun
(120303) #fitalk ip finder and geo ip for funINSIGHT FORENSIC
 
Synthetic Data and Graphics Techniques in Robotics
Synthetic Data and Graphics Techniques in RoboticsSynthetic Data and Graphics Techniques in Robotics
Synthetic Data and Graphics Techniques in RoboticsPrabindh Sundareson
 
#OSSPARIS19 - Computer Vision framework for GeoSpatial Imagery: RoboSat.pink ...
#OSSPARIS19 - Computer Vision framework for GeoSpatial Imagery: RoboSat.pink ...#OSSPARIS19 - Computer Vision framework for GeoSpatial Imagery: RoboSat.pink ...
#OSSPARIS19 - Computer Vision framework for GeoSpatial Imagery: RoboSat.pink ...Paris Open Source Summit
 
Designing Interactive Web Based AR Experiences
Designing Interactive Web Based AR ExperiencesDesigning Interactive Web Based AR Experiences
Designing Interactive Web Based AR ExperiencesFITC
 
David Mertz. Type Annotations. PyCon Belarus 2015
David Mertz. Type Annotations. PyCon Belarus 2015David Mertz. Type Annotations. PyCon Belarus 2015
David Mertz. Type Annotations. PyCon Belarus 2015Alina Dolgikh
 
Three Functional Programming Technologies for Big Data
Three Functional Programming Technologies for Big DataThree Functional Programming Technologies for Big Data
Three Functional Programming Technologies for Big DataDynamical Software, Inc.
 
닷넷 개발자를 위한 패턴이야기
닷넷 개발자를 위한 패턴이야기닷넷 개발자를 위한 패턴이야기
닷넷 개발자를 위한 패턴이야기YoungSu Son
 
Exploring Google (Cloud) APIs with Python & JavaScript
Exploring Google (Cloud) APIs with Python & JavaScriptExploring Google (Cloud) APIs with Python & JavaScript
Exploring Google (Cloud) APIs with Python & JavaScriptwesley chun
 

Similar to Pyconmini Hiroshima 2018 (20)

Geospatial Data Analysis and Visualization in Python
Geospatial Data Analysis and Visualization in PythonGeospatial Data Analysis and Visualization in Python
Geospatial Data Analysis and Visualization in Python
 
Binary Analysis - Luxembourg
Binary Analysis - LuxembourgBinary Analysis - Luxembourg
Binary Analysis - Luxembourg
 
Python Pyplot Class XII
Python Pyplot Class XIIPython Pyplot Class XII
Python Pyplot Class XII
 
Python tools to deploy your machine learning models faster
Python tools to deploy your machine learning models fasterPython tools to deploy your machine learning models faster
Python tools to deploy your machine learning models faster
 
Using the Kinect for Fun and Profit by Tam Hanna
Using the Kinect for Fun and Profit by Tam HannaUsing the Kinect for Fun and Profit by Tam Hanna
Using the Kinect for Fun and Profit by Tam Hanna
 
Letswift18 워크숍#1 스위프트 클린코드와 코드리뷰
Letswift18 워크숍#1 스위프트 클린코드와 코드리뷰Letswift18 워크숍#1 스위프트 클린코드와 코드리뷰
Letswift18 워크숍#1 스위프트 클린코드와 코드리뷰
 
An Introduction to Game Programming with Flash: An Introduction to Flash and ...
An Introduction to Game Programming with Flash: An Introduction to Flash and ...An Introduction to Game Programming with Flash: An Introduction to Flash and ...
An Introduction to Game Programming with Flash: An Introduction to Flash and ...
 
Atari Game State Representation using Convolutional Neural Networks
Atari Game State Representation using Convolutional Neural NetworksAtari Game State Representation using Convolutional Neural Networks
Atari Game State Representation using Convolutional Neural Networks
 
carrow - Go bindings to Apache Arrow via C++-API
carrow - Go bindings to Apache Arrow via C++-APIcarrow - Go bindings to Apache Arrow via C++-API
carrow - Go bindings to Apache Arrow via C++-API
 
Automated ML Workflow for Distributed Big Data Using Analytics Zoo (CVPR2020 ...
Automated ML Workflow for Distributed Big Data Using Analytics Zoo (CVPR2020 ...Automated ML Workflow for Distributed Big Data Using Analytics Zoo (CVPR2020 ...
Automated ML Workflow for Distributed Big Data Using Analytics Zoo (CVPR2020 ...
 
Deep Learning as a Cat/Dog Detector
Deep Learning as a Cat/Dog DetectorDeep Learning as a Cat/Dog Detector
Deep Learning as a Cat/Dog Detector
 
(120303) #fitalk ip finder and geo ip for fun
(120303) #fitalk   ip finder and geo ip for fun(120303) #fitalk   ip finder and geo ip for fun
(120303) #fitalk ip finder and geo ip for fun
 
(120303) #fitalk ip finder and geo ip for fun
(120303) #fitalk   ip finder and geo ip for fun(120303) #fitalk   ip finder and geo ip for fun
(120303) #fitalk ip finder and geo ip for fun
 
Synthetic Data and Graphics Techniques in Robotics
Synthetic Data and Graphics Techniques in RoboticsSynthetic Data and Graphics Techniques in Robotics
Synthetic Data and Graphics Techniques in Robotics
 
#OSSPARIS19 - Computer Vision framework for GeoSpatial Imagery: RoboSat.pink ...
#OSSPARIS19 - Computer Vision framework for GeoSpatial Imagery: RoboSat.pink ...#OSSPARIS19 - Computer Vision framework for GeoSpatial Imagery: RoboSat.pink ...
#OSSPARIS19 - Computer Vision framework for GeoSpatial Imagery: RoboSat.pink ...
 
Designing Interactive Web Based AR Experiences
Designing Interactive Web Based AR ExperiencesDesigning Interactive Web Based AR Experiences
Designing Interactive Web Based AR Experiences
 
David Mertz. Type Annotations. PyCon Belarus 2015
David Mertz. Type Annotations. PyCon Belarus 2015David Mertz. Type Annotations. PyCon Belarus 2015
David Mertz. Type Annotations. PyCon Belarus 2015
 
Three Functional Programming Technologies for Big Data
Three Functional Programming Technologies for Big DataThree Functional Programming Technologies for Big Data
Three Functional Programming Technologies for Big Data
 
닷넷 개발자를 위한 패턴이야기
닷넷 개발자를 위한 패턴이야기닷넷 개발자를 위한 패턴이야기
닷넷 개발자를 위한 패턴이야기
 
Exploring Google (Cloud) APIs with Python & JavaScript
Exploring Google (Cloud) APIs with Python & JavaScriptExploring Google (Cloud) APIs with Python & JavaScript
Exploring Google (Cloud) APIs with Python & JavaScript
 

Recently uploaded

20240419 - Measurecamp Amsterdam - SAM.pdf
20240419 - Measurecamp Amsterdam - SAM.pdf20240419 - Measurecamp Amsterdam - SAM.pdf
20240419 - Measurecamp Amsterdam - SAM.pdfHuman37
 
Customer Service Analytics - Make Sense of All Your Data.pptx
Customer Service Analytics - Make Sense of All Your Data.pptxCustomer Service Analytics - Make Sense of All Your Data.pptx
Customer Service Analytics - Make Sense of All Your Data.pptxEmmanuel Dauda
 
Predicting Salary Using Data Science: A Comprehensive Analysis.pdf
Predicting Salary Using Data Science: A Comprehensive Analysis.pdfPredicting Salary Using Data Science: A Comprehensive Analysis.pdf
Predicting Salary Using Data Science: A Comprehensive Analysis.pdfBoston Institute of Analytics
 
Heart Disease Classification Report: A Data Analysis Project
Heart Disease Classification Report: A Data Analysis ProjectHeart Disease Classification Report: A Data Analysis Project
Heart Disease Classification Report: A Data Analysis ProjectBoston Institute of Analytics
 
9654467111 Call Girls In Munirka Hotel And Home Service
9654467111 Call Girls In Munirka Hotel And Home Service9654467111 Call Girls In Munirka Hotel And Home Service
9654467111 Call Girls In Munirka Hotel And Home ServiceSapana Sha
 
Consent & Privacy Signals on Google *Pixels* - MeasureCamp Amsterdam 2024
Consent & Privacy Signals on Google *Pixels* - MeasureCamp Amsterdam 2024Consent & Privacy Signals on Google *Pixels* - MeasureCamp Amsterdam 2024
Consent & Privacy Signals on Google *Pixels* - MeasureCamp Amsterdam 2024thyngster
 
Generative AI for Social Good at Open Data Science East 2024
Generative AI for Social Good at Open Data Science East 2024Generative AI for Social Good at Open Data Science East 2024
Generative AI for Social Good at Open Data Science East 2024Colleen Farrelly
 
Call Girls In Dwarka 9654467111 Escorts Service
Call Girls In Dwarka 9654467111 Escorts ServiceCall Girls In Dwarka 9654467111 Escorts Service
Call Girls In Dwarka 9654467111 Escorts ServiceSapana Sha
 
Saket, (-DELHI )+91-9654467111-(=)CHEAP Call Girls in Escorts Service Saket C...
Saket, (-DELHI )+91-9654467111-(=)CHEAP Call Girls in Escorts Service Saket C...Saket, (-DELHI )+91-9654467111-(=)CHEAP Call Girls in Escorts Service Saket C...
Saket, (-DELHI )+91-9654467111-(=)CHEAP Call Girls in Escorts Service Saket C...Sapana Sha
 
Effects of Smartphone Addiction on the Academic Performances of Grades 9 to 1...
Effects of Smartphone Addiction on the Academic Performances of Grades 9 to 1...Effects of Smartphone Addiction on the Academic Performances of Grades 9 to 1...
Effects of Smartphone Addiction on the Academic Performances of Grades 9 to 1...limedy534
 
NLP Data Science Project Presentation:Predicting Heart Disease with NLP Data ...
NLP Data Science Project Presentation:Predicting Heart Disease with NLP Data ...NLP Data Science Project Presentation:Predicting Heart Disease with NLP Data ...
NLP Data Science Project Presentation:Predicting Heart Disease with NLP Data ...Boston Institute of Analytics
 
High Class Call Girls Noida Sector 39 Aarushi 🔝8264348440🔝 Independent Escort...
High Class Call Girls Noida Sector 39 Aarushi 🔝8264348440🔝 Independent Escort...High Class Call Girls Noida Sector 39 Aarushi 🔝8264348440🔝 Independent Escort...
High Class Call Girls Noida Sector 39 Aarushi 🔝8264348440🔝 Independent Escort...soniya singh
 
EMERCE - 2024 - AMSTERDAM - CROSS-PLATFORM TRACKING WITH GOOGLE ANALYTICS.pptx
EMERCE - 2024 - AMSTERDAM - CROSS-PLATFORM  TRACKING WITH GOOGLE ANALYTICS.pptxEMERCE - 2024 - AMSTERDAM - CROSS-PLATFORM  TRACKING WITH GOOGLE ANALYTICS.pptx
EMERCE - 2024 - AMSTERDAM - CROSS-PLATFORM TRACKING WITH GOOGLE ANALYTICS.pptxthyngster
 
How we prevented account sharing with MFA
How we prevented account sharing with MFAHow we prevented account sharing with MFA
How we prevented account sharing with MFAAndrei Kaleshka
 
Indian Call Girls in Abu Dhabi O5286O24O8 Call Girls in Abu Dhabi By Independ...
Indian Call Girls in Abu Dhabi O5286O24O8 Call Girls in Abu Dhabi By Independ...Indian Call Girls in Abu Dhabi O5286O24O8 Call Girls in Abu Dhabi By Independ...
Indian Call Girls in Abu Dhabi O5286O24O8 Call Girls in Abu Dhabi By Independ...dajasot375
 
dokumen.tips_chapter-4-transient-heat-conduction-mehmet-kanoglu.ppt
dokumen.tips_chapter-4-transient-heat-conduction-mehmet-kanoglu.pptdokumen.tips_chapter-4-transient-heat-conduction-mehmet-kanoglu.ppt
dokumen.tips_chapter-4-transient-heat-conduction-mehmet-kanoglu.pptSonatrach
 
专业一比一美国俄亥俄大学毕业证成绩单pdf电子版制作修改
专业一比一美国俄亥俄大学毕业证成绩单pdf电子版制作修改专业一比一美国俄亥俄大学毕业证成绩单pdf电子版制作修改
专业一比一美国俄亥俄大学毕业证成绩单pdf电子版制作修改yuu sss
 
From idea to production in a day – Leveraging Azure ML and Streamlit to build...
From idea to production in a day – Leveraging Azure ML and Streamlit to build...From idea to production in a day – Leveraging Azure ML and Streamlit to build...
From idea to production in a day – Leveraging Azure ML and Streamlit to build...Florian Roscheck
 

Recently uploaded (20)

20240419 - Measurecamp Amsterdam - SAM.pdf
20240419 - Measurecamp Amsterdam - SAM.pdf20240419 - Measurecamp Amsterdam - SAM.pdf
20240419 - Measurecamp Amsterdam - SAM.pdf
 
Customer Service Analytics - Make Sense of All Your Data.pptx
Customer Service Analytics - Make Sense of All Your Data.pptxCustomer Service Analytics - Make Sense of All Your Data.pptx
Customer Service Analytics - Make Sense of All Your Data.pptx
 
Predicting Salary Using Data Science: A Comprehensive Analysis.pdf
Predicting Salary Using Data Science: A Comprehensive Analysis.pdfPredicting Salary Using Data Science: A Comprehensive Analysis.pdf
Predicting Salary Using Data Science: A Comprehensive Analysis.pdf
 
E-Commerce Order PredictionShraddha Kamble.pptx
E-Commerce Order PredictionShraddha Kamble.pptxE-Commerce Order PredictionShraddha Kamble.pptx
E-Commerce Order PredictionShraddha Kamble.pptx
 
Heart Disease Classification Report: A Data Analysis Project
Heart Disease Classification Report: A Data Analysis ProjectHeart Disease Classification Report: A Data Analysis Project
Heart Disease Classification Report: A Data Analysis Project
 
9654467111 Call Girls In Munirka Hotel And Home Service
9654467111 Call Girls In Munirka Hotel And Home Service9654467111 Call Girls In Munirka Hotel And Home Service
9654467111 Call Girls In Munirka Hotel And Home Service
 
Consent & Privacy Signals on Google *Pixels* - MeasureCamp Amsterdam 2024
Consent & Privacy Signals on Google *Pixels* - MeasureCamp Amsterdam 2024Consent & Privacy Signals on Google *Pixels* - MeasureCamp Amsterdam 2024
Consent & Privacy Signals on Google *Pixels* - MeasureCamp Amsterdam 2024
 
Generative AI for Social Good at Open Data Science East 2024
Generative AI for Social Good at Open Data Science East 2024Generative AI for Social Good at Open Data Science East 2024
Generative AI for Social Good at Open Data Science East 2024
 
Call Girls In Dwarka 9654467111 Escorts Service
Call Girls In Dwarka 9654467111 Escorts ServiceCall Girls In Dwarka 9654467111 Escorts Service
Call Girls In Dwarka 9654467111 Escorts Service
 
Saket, (-DELHI )+91-9654467111-(=)CHEAP Call Girls in Escorts Service Saket C...
Saket, (-DELHI )+91-9654467111-(=)CHEAP Call Girls in Escorts Service Saket C...Saket, (-DELHI )+91-9654467111-(=)CHEAP Call Girls in Escorts Service Saket C...
Saket, (-DELHI )+91-9654467111-(=)CHEAP Call Girls in Escorts Service Saket C...
 
Effects of Smartphone Addiction on the Academic Performances of Grades 9 to 1...
Effects of Smartphone Addiction on the Academic Performances of Grades 9 to 1...Effects of Smartphone Addiction on the Academic Performances of Grades 9 to 1...
Effects of Smartphone Addiction on the Academic Performances of Grades 9 to 1...
 
NLP Data Science Project Presentation:Predicting Heart Disease with NLP Data ...
NLP Data Science Project Presentation:Predicting Heart Disease with NLP Data ...NLP Data Science Project Presentation:Predicting Heart Disease with NLP Data ...
NLP Data Science Project Presentation:Predicting Heart Disease with NLP Data ...
 
High Class Call Girls Noida Sector 39 Aarushi 🔝8264348440🔝 Independent Escort...
High Class Call Girls Noida Sector 39 Aarushi 🔝8264348440🔝 Independent Escort...High Class Call Girls Noida Sector 39 Aarushi 🔝8264348440🔝 Independent Escort...
High Class Call Girls Noida Sector 39 Aarushi 🔝8264348440🔝 Independent Escort...
 
EMERCE - 2024 - AMSTERDAM - CROSS-PLATFORM TRACKING WITH GOOGLE ANALYTICS.pptx
EMERCE - 2024 - AMSTERDAM - CROSS-PLATFORM  TRACKING WITH GOOGLE ANALYTICS.pptxEMERCE - 2024 - AMSTERDAM - CROSS-PLATFORM  TRACKING WITH GOOGLE ANALYTICS.pptx
EMERCE - 2024 - AMSTERDAM - CROSS-PLATFORM TRACKING WITH GOOGLE ANALYTICS.pptx
 
How we prevented account sharing with MFA
How we prevented account sharing with MFAHow we prevented account sharing with MFA
How we prevented account sharing with MFA
 
Indian Call Girls in Abu Dhabi O5286O24O8 Call Girls in Abu Dhabi By Independ...
Indian Call Girls in Abu Dhabi O5286O24O8 Call Girls in Abu Dhabi By Independ...Indian Call Girls in Abu Dhabi O5286O24O8 Call Girls in Abu Dhabi By Independ...
Indian Call Girls in Abu Dhabi O5286O24O8 Call Girls in Abu Dhabi By Independ...
 
dokumen.tips_chapter-4-transient-heat-conduction-mehmet-kanoglu.ppt
dokumen.tips_chapter-4-transient-heat-conduction-mehmet-kanoglu.pptdokumen.tips_chapter-4-transient-heat-conduction-mehmet-kanoglu.ppt
dokumen.tips_chapter-4-transient-heat-conduction-mehmet-kanoglu.ppt
 
专业一比一美国俄亥俄大学毕业证成绩单pdf电子版制作修改
专业一比一美国俄亥俄大学毕业证成绩单pdf电子版制作修改专业一比一美国俄亥俄大学毕业证成绩单pdf电子版制作修改
专业一比一美国俄亥俄大学毕业证成绩单pdf电子版制作修改
 
Call Girls in Saket 99530🔝 56974 Escort Service
Call Girls in Saket 99530🔝 56974 Escort ServiceCall Girls in Saket 99530🔝 56974 Escort Service
Call Girls in Saket 99530🔝 56974 Escort Service
 
From idea to production in a day – Leveraging Azure ML and Streamlit to build...
From idea to production in a day – Leveraging Azure ML and Streamlit to build...From idea to production in a day – Leveraging Azure ML and Streamlit to build...
From idea to production in a day – Leveraging Azure ML and Streamlit to build...
 

Pyconmini Hiroshima 2018

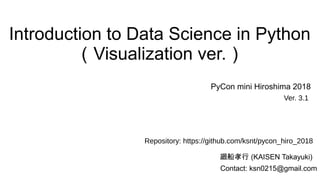
  • 1. Introduction to Data Science in Python (Visualization ver.) 廻船孝行 (KAISEN Takayuki) PyCon mini Hiroshima 2018 Contact: ksn0215@gmail.com Ver. 3.1 Repository: https://github.com/ksnt/pycon_hiro_2018
  • 2. Overview 1. Geographic Data Analysis 2. Interactive Graph and Application 3. Discussion Python 3.6.3 Pip 10.0.1 Development Environment Ubuntu 17.10
  • 3. ・ Injury due to an accident Notice ・ Hard to pronounce some words ・ Appreciate for your cooperation in advance!
  • 4. 0. WHO ARE YOU? ⚫ Favorite Languages ⚪ Python, R, Scala ⚫ Interests ⚪SNA, CSS, CMC, ABM, Complex Systems, Data Science, ... ⚫ Python Conference Attendance ⚪PyCon mini JP (2010?) ⚪PyConJP 2011 ⚪Tokyo.Scipy (2011?) ⚫ Love Online Learning ⚫ Oct 2017 - HiroshimaFreeman, L. (2004). The development of social network analysis. A Study in the Sociology of Science, 1. 1. Social network analysis is motivated by a structural in- tuition based on ties linking social actors, 2. It is grounded in systematic empirical data, 3. It draws heavily on graphic imagery, and 4. It relies on the use of mathematical and/or computation- al models.
  • 5. Takeaways: All I am Talking to You 1. It is incredibly easy to make use of geographic data with Python (Folium) 2. It is incredibly easy to develop data driven web application with Python (Plotly and Dash)
  • 6. 1. Geographic Data Analysis 2. Interactive Graph and Application 3. Discussion
  • 7. How to use geographic data GIS = Geographic Information System “A geographic information system (GIS) is a system designed to capture, store, manipulate, analyze, manage, and present spatial or geographic data. “ Wikipedia YOU DON’T HAVE TO USE GIS! Reference: “Python Geospatial Development – Third Edition” Chapter2
  • 8. How to make use of Geographic data in Python ・ArcGIS, QGIS (PyQGIS) ・Geopandas ・Folium (Leaflet) ・Geopy ・And so forth… (reference) https://qiita.com/aimof/items/b4e4551d27abaf5bb258 ⚪ Do not need knowledge on GIS ⚪ Can easily create Web map
  • 9. How to install folium $ pip install folium $ conda install -c conda-forge folium or
  • 11. Data & Visualization(2) df = pd.Dataframe() df = df.attend(crime_data[‘LAT’]) df = df.attend(crime_data[‘LON’]) df = df.T df = df.reset_index(drop=True) df[‘LAT’] = round(df[‘LAT’],3) df[‘LON’] = round(df[‘LON’],3) df.head()
  • 12. Data & Visualization(3) from folium.plugins import HeatMap from IPython.display import HTML import folium map_detroit = folium.Map(location=(42.40,-83.01)) data = [] for i in range(len(df)): data.append((df['LAT'][i],df['LON'][i])) HeatMap(data,radius=9).add_to(map_detroit) map_detroit.save('crimes.html') HTML(r'<iframe width="800" height="500" frameborder="0" allowfullscreen src="./crimes.html"></iframe>') https://nbviewer.jupyter.org/github/ksnt/Predictor-of-blights-in- Detroit/blob/master/Final_Report_1.1.ipynb
  • 13. Data & Visualization(4) How to visualize geographical data with folium 1. Data cleaning 2. Create map 3. Put the data into the map! (4. Save the map as a HTML file ) (5. Draw the HTML file ) HeatMap(data,radius=9).add_to(map_detroit)
  • 14. 1. Geographic Data Analysis 2. Interactive Graph and Application 3. Discussion
  • 15. Data Visualization in Python ⚫ seaborn: cool ⚫ bokeh: cool, interactive ⚫ plotly: cool, interactive, reactive ⚫ matplotlib: standard ⚫ PixieDust (IBM?): interactive, …? >>> plotly.__version__ '2.4.1' >>> dash.__version__ '0.21.0' ⚫ mpld3: cool, interactive
  • 16. How to Use Plotly and Dash $ pip install plotly $ pip install dash $ python >>> import plotly >>> import dash
  • 17. Interactive Graph For Scatter Plot (Optional) https://nbviewer.jupyter.org/gist/ksnt/340910aae39670202e4f790213e7afdc
  • 18. Interactive Graph for Bar Plot import pandas as pd import plotly import plotly.graph_objs as go df2 = pd.read_excel('globalterrorismdb_0616dist.xlsx',header=0) data = [go.Bar( x=df2["country_txt"].value_counts()[:20].index, y=df2["country_txt"].value_counts()[:20] )] layout = go.Layout( title="Top 20 Frequency of Terrorism Incidents 1970 - 2015", xaxis={"title":"Country"}, yaxis={"title":"Occurence of terrorism"}, ) fig = go.Figure(data=data, layout=layout) # Preparation of plot by Plotly plotly.offline.iplot(fig, filename='basic-bar') # not online figure You have to prepare for this data! https://nbviewer.jupyter.org/gist/ksnt/eb8ac99dd69ecc5dc5774bf673977ceb
  • 19. Interactive Graph for Time Series Plot layout = plotly.graph_objs.Layout( title="Occurence of Terrorism Incidents", xaxis={"title":"Year"}, yaxis={"title":"Occurence of terrorism"}, ) iraq_incidents = df2[df2["country_txt"] == "Iraq"] iraq_incidents_count = iraq_incidents['iyear'].value_counts() iraq_incidents_count = iraq_incidents_count.sort_index() iraq = go.Scatter( x=iraq_incidents_count.index, y=iraq_incidents_count, name = "Iraq", line = dict(color="black"), Opacity = 0.8) year = [i for i in range(1970,2016)] data = [iraq,us,pakistan,india,afghanistan,colombia,peru,phil,el,uk,turkey,spain,sri,somalia,nigeria,algeria, france,yemen,lebanon] fig = plotly.graph_objs.Figure(data=data, layout=layout) plotly.offline.iplot(fig, show_link=False,config={"displaylogo":False, "modeBarButtonsToRemove": ["sendDataToCloud"]}) https://nbviewer.jupyter.org/gist/ksnt/eb8ac99dd69ecc5dc5774bf673977ceb
  • 20. Additional Example – MonteCarlo Simulation (Optional) https://nbviewer.jupyter.org/gist/ksnt/101a44cc21b0eb990f96dc1d640dbd42
  • 21. Plotly Dash “”” Dash is Shiny for Python “”” ― Chris Parmer, Dash: Shiny for Python https://youtu.be/5BAthiN0htc “ Dash is a Python framework for building web application” ・ Flask ・ React.js ・ Ideal for building data visualization apps
  • 22. Monte Carlo Simulator (1) https://montecarlo-dash-app.herokuapp.com/
  • 23. Monte Carlo Simulator (2) Krauth, W. (2006). Statistical mechanics: algorithms and computations (Vol. 13). OUP Oxford. Covered by points Num of all points →S(□) = 4 r=1 r=1 Num of point in the circle → S(○) = π Num of all points Num of point in the circle S(○) S(□) = 4 π Count up these points! Points = {x,y}, x,y 〜 U(-1,1) Useful article about Monte Carlo Simulation in Japanese is: —モンテカルロ法の前線 サイコロを振って積分する方法 福島 孝治 https://www.smapip.is.tohoku.ac.jp/~smapip/2003/tutorial/presentation/koji-hukushima.pdf Institution
  • 24. Monte Carlo Simulator (3) https://montecarlo-dash-app.herokuapp.com/
  • 25. Monte Carlo Simulator (4) https://gist.github.com/ksnt/ccd88b6f63081e6d2d11f0daf6d0bc4e ⚫ Import libraries ⚫ app = dash.Dash() server=app.server server.secret_key = os.environ.get('secret_key', 'secret') ⚫ app.layout = html.Div( # WRITE LAYOUT) ⚫ @app.callback( #WRITE OPERATION) ⚫ if __name__ == '__main__': app.run_server(debug=True) View Controller
  • 26. Python vs R as Data Visualization Tool Speed Extensibility Price Packages/ Libraries (for Data Analysis) Python ○ ◎ Free ML R △ △ OOP (S3,S4,R5(>=2.12)) Free Statistics Tableau ? △? For EDA? ¥18000/year ¥51000/year ¥102000/year ¥0/year students and teachers ? Kibana, Superset, Redash, Metabase, Splunk, KNIME, Google Charts, etc… Julia, Matlab, Scilab, Octave, etc...
  • 27. 3 – 2ε. Welcome to Plotly Dash Document Translation Project! https://goo.gl/wnjHA6 HERE!
  • 28. 3 – ε. I am looking for new opportunities! ・ Places: Anywhere ・ Salary & Benefits: Negotiable ・ Feel free to talk to me! ・ Like: International, Diverse, Python, Data analysis
  • 29. 1. Geographic Data Analysis 2. Interactive Graph and Application 3. Discussion

Editor's Notes

  1. 1.RはOOPで書きづらい ※ただし私が知っているのはS3クラスというものを使うやりかたで、S4やR5といった別のものを使えばそこまで書きづらくもないのかもしれない  参考: https://sites.google.com/site/scriptofbioinformatics/r-tong-ji-guan-xi/rnoobujekuto-zhi-xiangnitsuite-r 2. Rでオレオレグラフを作るのがしんどかった経験 ggplot2を拡張するコードを書いたことがあるがしんどすぎてメゲそうになった。実際に作者であるWickham自身もggplot2の作りについて反省している。 参考:http://yutannihilation.github.io/ggplot2-vignette-ja/extending-ggplot2.html  ただ、一方で例えばPythonmatplotlibを拡張しようとしたときに簡単にできるのかという疑問はある。